
From Data to Impact: Why Data Visualization Matters in Agriculture
A lot has been said about the importance of data and data-driven decision-making. However, having data isn’t enough; what matters is being able to understand it and apply it to enable better decisions.
Research across disciplines has shown strong evidence that visualizing data, rather than presenting numbers alone, significantly enhances how people comprehend and use information. Easy-to-follow visualizations help deliver more information while making it easier for our brains to process, reducing the mental effort required to interpret complex datasets.
In fields such as agriculture, where decisions can have long-term consequences, having user-friendly data tools becomes even more crucial. Decision-makers across various levels, whether they’re farmers in the field or government policymakers, need tools that not only provide data but also make it usable and actionable.
Data visualization training as an entry to data use
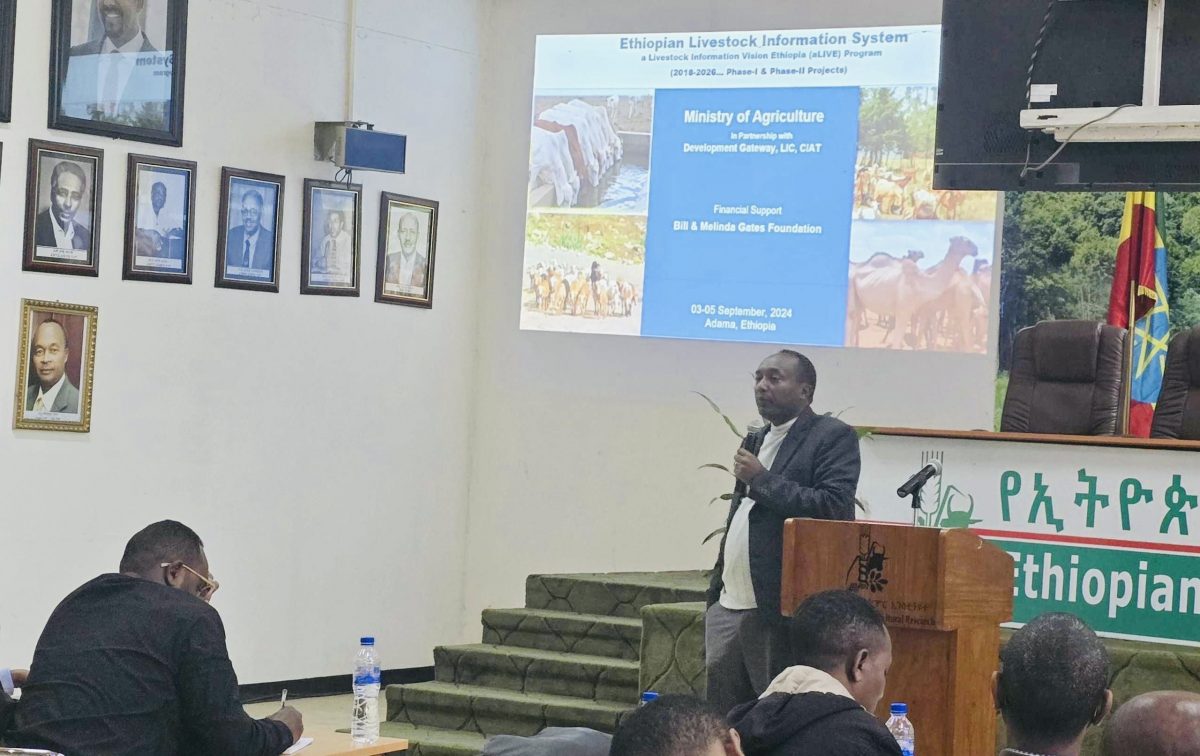
The Ethiopian Ministry of Agriculture (MoA), along with the Ministry of Regional Trade & Integration (MoTRI) and the Livestock Development Institute (LDI) manages significant volumes of livestock data covering disease, markets, and genetics. However, the gap in technical capacity hindered effective data management, analysis, and use in decision-making. To this end, the a Livestock Information Vision for Ethiopia (aLIVE) program, funded by the Gates Foundation, conducted a series of structured and hands-on training in data visualization techniques in November 2023 and January 2024 with the goal of increasing data use.
Federal system owners received training with a focus on practical application in real-world scenarios, utilizing their data generated from their databases. Participants learned how to clean and manage datasets, apply Excel formulas and functions, use PivotTables and PivotCharts for data summarization, and develop interactive visualizations with Power BI. A critical component of the training emphasized key data quality principles, such as validity, integrity, precision, reliability, and timeliness, ensuring that system owners could produce reliable and accurate reports. Many trainees had prior theoretical knowledge but lacked hands-on experience, which this training effectively addressed by allowing them to work with live datasets from their databases.

Visualization improves efficiency in reporting
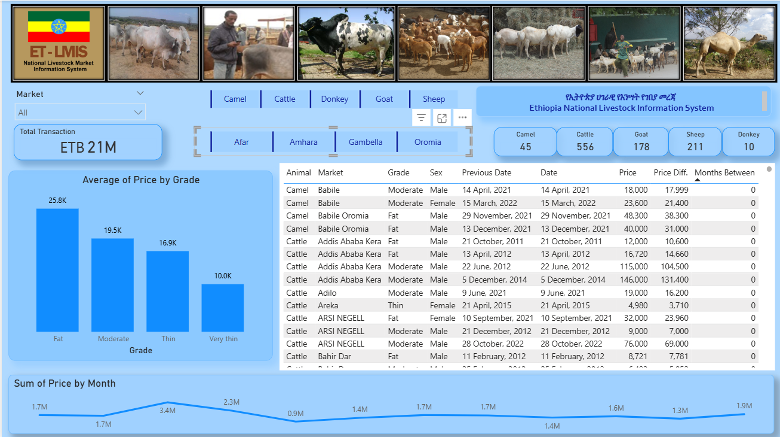
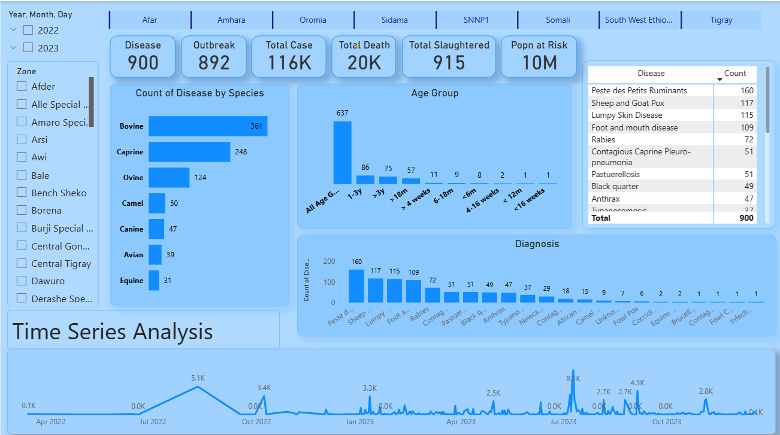
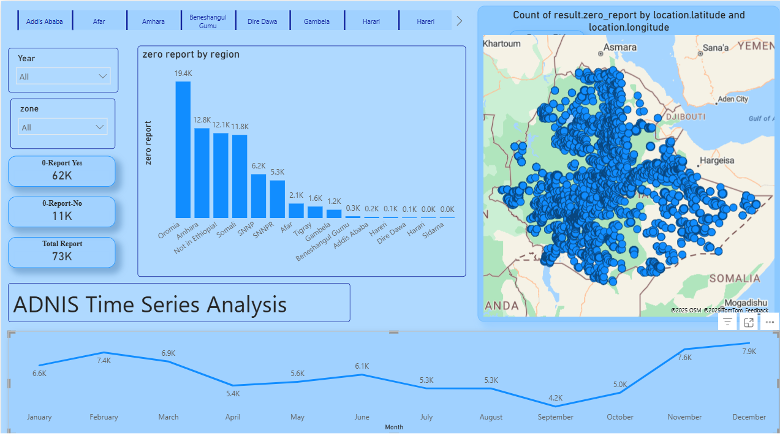
As participants began applying their new data skills, the practical benefits became clear. Being able to visualize data using tools like Power BI and PivotTables in Excel, along with advanced filtering, enabled trainees to enhance the efficiency of utilizing livestock data for various reporting purposes. The trainees reported that data tasks that previously took them several days to complete could now be done in hours or even minutes.
Systems owners as trusted intermediaries
Systems owners play a critical role in connecting and translating information from the ground up, delivering data from farmers and local stakeholders to policymakers. To do this effectively, they must be empowered data users, capable of transforming raw datasets into clear, usable insights for decision-makers. Timely, clear, and well-targeted data visualizations created by system owners are a critical enabler of informed policymaking.
When data is presented in an accessible and actionable format, it becomes far easier for policymakers to reference and utilize it. Conversely, poor decisions often stem not just from low-quality data, but from decision-makers being unable – or unwilling – to engage with overly complex or delayed data.
Through the aLIVE training program, system owners develop the ability to deliver information in a way that enables decision-makers to confidently act upon it. Importantly, this training goes beyond technical capacity. It positions system owners as trusted intermediaries in the livestock value chain – individuals who can translate raw field-level data into national-level insights that shape policies, programs, and investments.
Crucially, the program also employs a training-of-trainers (ToT) model. System owners cascade their knowledge to regional focal points, who in turn are better equipped to interpret and communicate data to local stakeholders, including farmers. For instance, once Dr. Gashaw completed the training, he immediately trained DOVAR-II owners at the Woreda level on data management and analysis.
Additionally, regional focal points now use PivotTables for their own reporting. According to Dr. Tewodros, the Animal Disease Notification and Investigation System (ADNIS) System Owner at MoA, “The fact that aLIVE expanded its training to the regions based on our recommendation has simplified their data reporting and improved our ability to follow up. They have begun using Pivot Tables in their reports, and many are eager for similar and further training.”
This cascading approach helps ensure that data literacy does not remain concentrated only at the federal level but extends through the broader livestock system. By reinforcing accountability, transparency, and empowerment across different levels of governance, this approach protects and entrenches data use for the long term as it moves through the value chain.
Visualized data enables evidence-based decisions at every level
Outside of reporting, visualizing data lowers the barrier to making evidence-based decisions, especially when the visualizations are simple, like bar graphs and simplified charts. This evidence can improve decisions by introducing new insights that can shift prior beliefs, reduce uncertainty, and can be understood from federal to regional to farmer level.
Improvement in data quality awareness was noted, as described by Dr Gashaw from the DOVAR System: “Since we are not data experts, we used to consider quality issues only in relation to outliers. The training has helped me understand data quality very well, including concepts such as integrity and validity. We are now discussing how the data that comes to our system can attain these standards.”
Improving data competency facilitates a data-driven culture
Embedding a data-driven culture requires demonstrating the value of data and building stakeholders’ capacity to use it. Data visualization training serves two purposes: enhancing the utility of data and reducing entry barriers, allowing stakeholders to generate their own visualizations. With improved capacity comes an increased willingness to integrate data into daily workflows.
Improved competency translates into a more confident mindset when working with data and a stronger willingness to engage with data tasks without relying on external support. As a result, participants are better equipped to generate insights quickly. One expert, for instance, went on to create time series analysis to identify trends and patterns, which could help policymakers plan for the future, allocate resources more effectively, and respond to emerging challenges.
Connecting the Dots
In conclusion, visualization is not only a practical tool for data analysis but also a powerful trust-building mechanism, as making data more accessible improves stakeholders’ ability at every level to engage with and interpret information. This demystifies complex livestock systems, empowering all stakeholders to explore data independently and reinforcing both confidence in the data and its use. Dashboards and visualization can enhance communication and coordination throughout the value chain, fostering trust and attracting new, previously disengaged stakeholders who might otherwise be excluded by technical barriers.
…
This is the second blog in our series sharing lessons from the aLIVE program, which is supporting livestock decision-makers in Ethiopia by improving the accessibility and reliability of livestock data. The series examines how data can be made more accessible, actionable, and sustainable to enhance decision-making across government to farm levels.
Read the first blog here.