From Many to One: AMP’s New Reports API
The Aid Management Platform (AMP) – the software component of DG’s Aid Management Program – has a highly complex technical structure to calculate how funding information will be reported throughout the system’s modules. Given the needs of Ministries of Finance (AMP users), funding information needs to be disaggregated at activity level based on sectors, programs, and locations, and then a percentage of incidence is assigned to each activity. This disaggregation is then split among each transaction. When the transaction amount is in a currency different than the one in the report, a currency conversion process is executed.
The problem we faced was that some of AMP’s modules – like dashboards, GIS, activity preview – used to access the data layer directly, with their own funding calculation mechanisms. This approach created some performance issues, since the database was being accessed directly without any specific optimizations. It also made the code difficult to maintain, because in some cases the code that performed the calculations was not separated from the visualization layer. This means it was duplicated both in the reports engine side, as well as in the GIS layer. Having the calculation isolated and duplicated also required increased testing to ensure figures matched correctly with the ones calculated in the reports and other modules.
To address these problems, as part of an AMP software reengineering project, DG created a Reports API. It consists of a set of RESTful endpoints that expose the report engine which allows other modules or systems to make use of it. The Reports API was designed to have a centralized place in which AMP data is exposed, guaranteeing data integrity, accuracy, and maintainability.
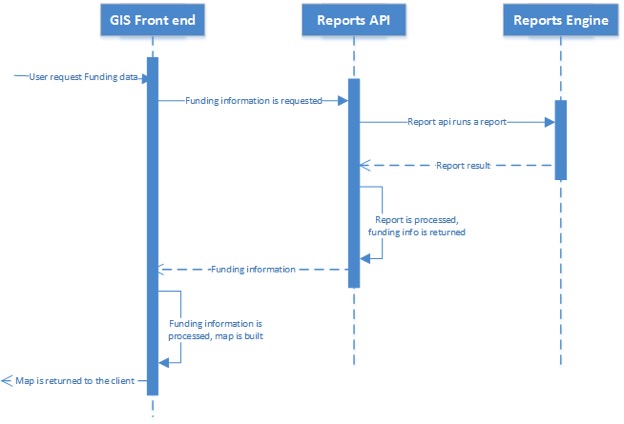
Figure 1: GIS layer consuming a report to calculate funding information
For example, in the Reengineered GIS the funding is calculated in a single place. In order to aggregate funding to be shown in the GIS layer, a programmatic report is created with the same structure and metadata as a report that you could create and run in the report module. This new approach guarantees the accuracy of data, because the funding information was calculated using a report. Hence testing, optimization, and maintenance efforts are centralized in the report module,dramatically lowering the efforts needed in each development cycle.
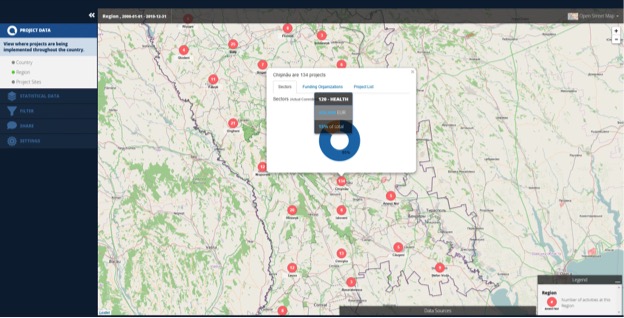
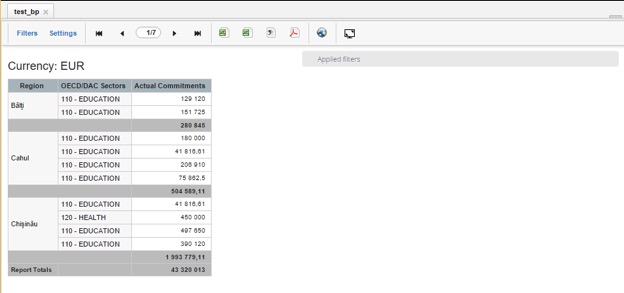
Figure 2: GIS module showing funding information for health sector (above); report matching those GIS figures (below)
One of the advantages of having this centralized implementation of Reports API is that it makes a software developer’s life easier. This simple and unique way of getting data allows team members to focus on the module they are actually working on, for example GIS. DG implemented the Reports API using industry standards, such as modularized code and methods documentation
Another advantage is that it makes easier to modify the underlying report engine, as long as the API is kept compatible.
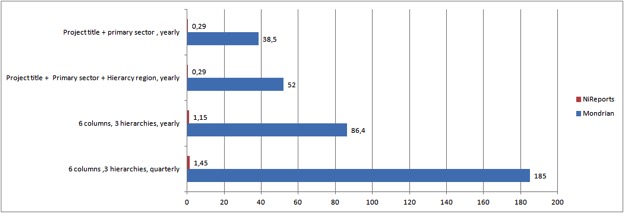
The next release of AMP (2.12) will include a major optimization of the Report Engine, which will have minimal impact in modules that use the Reports API (Dashboards, GIS, Report Renderer, Tabs). By having this API the development team focuses its effort in optimizing the backend, leaving the front-end almost unchanged, improving reports performance by several orders of magnitude.
Share This Post
Related from our library

Beyond Kigali: Where Does Africa Go from Here with AI?
As the AI momentum builds, Development Gateway is asking different questions: where the data comes from, how reliable it is, how legacy systems will supply usable data, and whether governments have the capacity to govern and trust the AI tools they’re being urged to adopt.

How Useful Is AI for Development? Three Key Lessons
The development world is buzzing with excitement over the idea that new and emerging applications of AI can supercharge economic growth, accelerate climate change mitigation, reduce inequalities, and more. But what does this look like in real life?

Stakeholder, Where Art Thou?: Three Insights on Using Governance Structures to Foster Stakeholder Engagement
Through our Tobacco Control Data Initiative (TCDI) program and its sister program Data on Youth and Tobacco in Africa (DaYTA), we have learned that creating governance structures, such as advisory boards or steering committees, is one approach to ensuring that digital solutions appropriately meet stakeholders’ needs and foster future stakeholder engagement. In this blog, we explore three insights on how governance structures can advance buy-in with individual stakeholders while connecting them to one another.