Aligning Technical Solutions with Institutional Constraints: Lessons from Tanzania
In the Results Data Initiative (RDI)’s first cross-ministry co-design workshop, we explored opportunities for greater data-driven decision-making in Tanzania’s health sector. Ultimately, colleagues from the Government of Tanzania — representing the President’s Office of Regional Administration and Local Government, Ministry of Health, Ministry of Finance and Planning, and the National Bureau of Statistics — identified two key priorities:
-
How do we best present relevant, community-level health data to Council Health Management Teams to improve their understanding of and response to common causes of death?
-
How do we best present relevant, facility-level health data to Facility Planning Teams to interpret, prioritize, and respond to the diseases in their catchment and service area?
Wait — How did you identify these priorities?
Previously, we shared the theory of change embedded in our problem-driven, iterative, and adaptive (PDIA) approach.
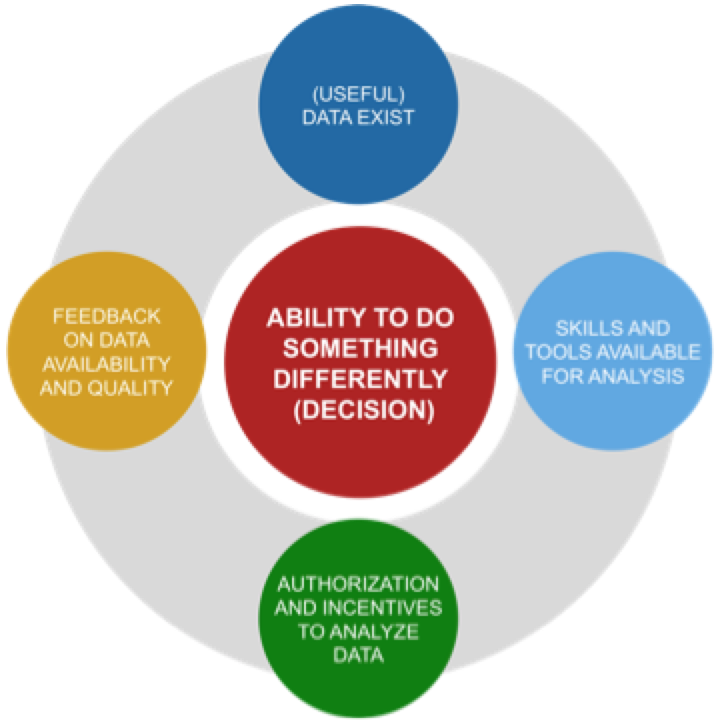
Image 1: Our PDIA Theory of Change
Putting this framework into practice means that — rather than focusing on obstacles — we focus on where the opportunities are for making better decisions. Once we identify those opportunities, we then assess and account for the institutional and technical constraints to meaningful data use (In the case of Tanzania, we had already done the groundwork in understanding data use constraints).
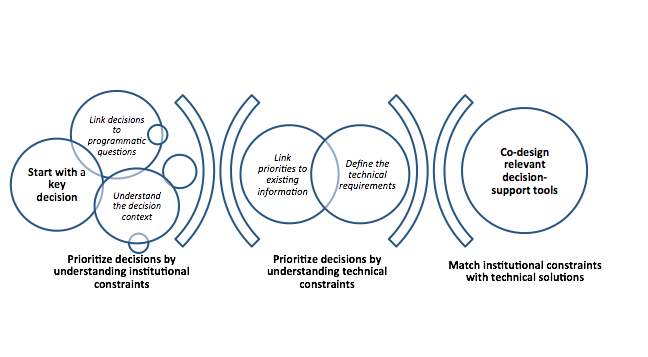
Image 2: Aligning technical solutions with institutional constraints
Next, we brought in the experts — government colleagues themselves — and undertook a five-step process for problem identification and solution co-design. Let’s walk through what this looked like in Tanzania, using the facility-level planning tool as an example:
Step 1: Start with the decision. On the first day, participants formed small brainstorming groups to identify common priorities and decision-making needs from their work. This helped to determine key points in existing processes where data and evidence could support better decision-making. Next, via extensive full group discussions, participants prioritized their lists. For our example case, the priority decision-making need selected was to ensure health facilities can more effectively respond to common diseases.
Step 2. Link decisions to programmatic questions. Next, we connected each decision with a policy or programmatic question. This aimed to help decision-makers more clearly frame their challenges and options, before trying to find an information tool to address them. Without this important context — the “why do I care about having this information?” — applying and interpreting data can become overwhelming.
For example, to better align responses to common diseases, a health facility needs to know local disease prevalence rates as well as the medical and human resources it has at its disposal for treating these diseases. This process took some time and iteration, but is important to understand the linkages between the decisions we face, the questions that can help justify our response, and our ultimate goal.
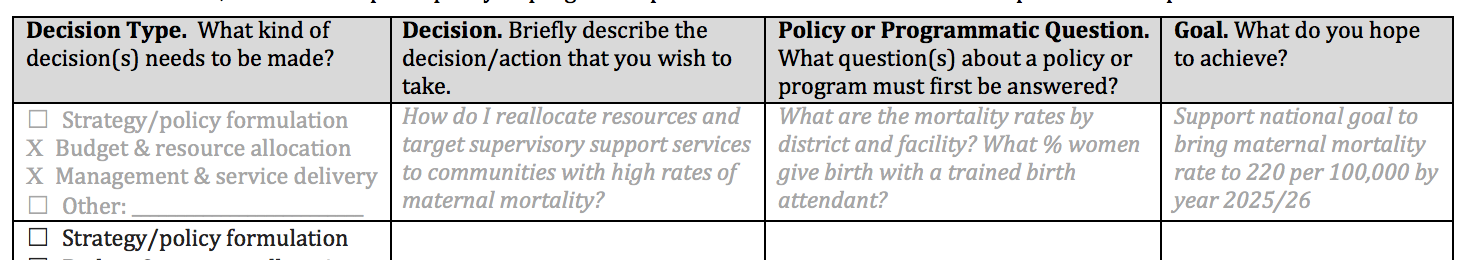
Image 3: Groupwork template to categorize and frame decision-making needs
Step 3. Understand the decision context. We believe that stakeholder analysis is important for understanding the context of decision making, as echoed by other data use methodologies. During the workshop, groups further prioritized decisions based on the feasibility of acting based on new evidence. This included outlining current decision-making processes, focused on the considerations outlined below.
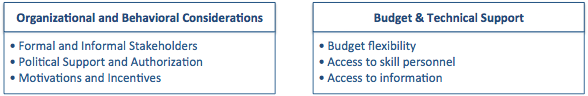
Image 4: Understanding the context of existing decision-making processes
This helped each group further refine priority challenges, and target decision-makers. In our example, Tanzania is moving forward with decentralized service delivery. Therefore, Facility Health Planning Teams would be our audience for a decision-support tool.
Step 4. Link priorities to existing information. Participants next considered what data sources were available and relevant for the prioritized decision and decision-maker. Discussion questions included:
-
Relevance of existing information: What type of data would be most relevant for the target decision?
-
Communication and dissemination: What is the best way to share information with key decision makers(s)? What information formats best link the decision with their work?
-
Data sources and availability: What information is needed by your target audience, and where does this information come from? Are there any constraints to accessing or extracting any of these data? Are there major data quality concerns?
In our example, DHIS2 and HRHIS were identified data sources. They hold monthly data about disease incidence and medical stocks, and annual information about number of skilled health workers by district, respectively.
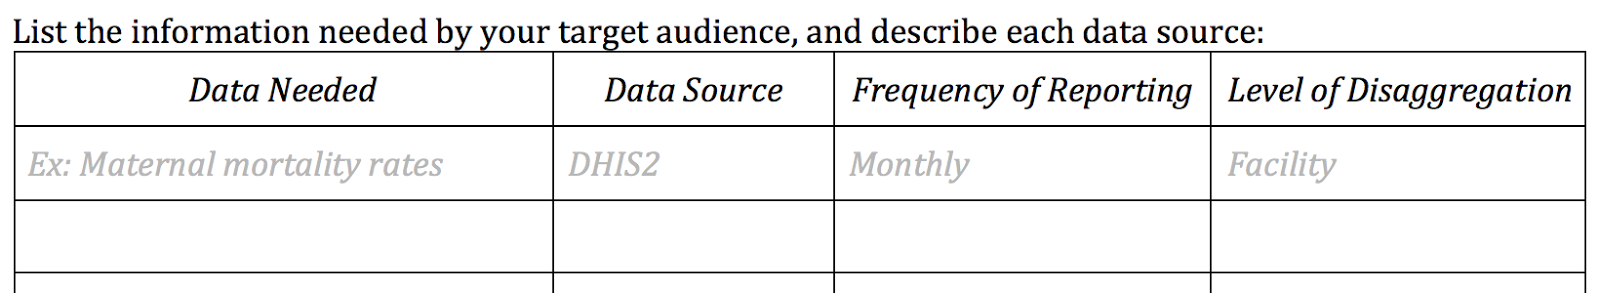
Image 5: Groupwork template to describe available data sources
Step 5. Define the technical requirements. Finally, participants outlined key components of the decision-support tools. In our example, a paper-based report was identified as a useful tool for quarterly Facility Health Planning Team meetings. This report would help visualize gaps in medicine stocks and human resources, against the prevalence of local diseases.
Considerations for identifying and defining the tool features included:
-
Tool Functionalities: What is the best format to communicate information to target users? What specific visualizations/analyses are most relevant? What features are “must haves”? What features are desirable?
-
Design and Layout: What is the first thing users should see? What content is primary? What content is secondary?
How has this changed your thinking on data use?
We learned a lot from facilitating the methodology described above — and about our own ability to remain flexible to participant needs and priorities when diving into the (sometimes scary and uncertain) space between PDIA theory and practice. As technical providers, we appreciate the need to prioritize institutional goals over technical requirements.
Share This Post
Related from our library

Harnessing the Power of Data: Tackling Tobacco Industry Influence in Africa
Reliable, accessible data is essential for effective tobacco control, enabling policymakers to implement stronger, evidence-based responses to evolving industry tactics and public health challenges. This blog explores how Tobacco Industry strategies hinder effective Tobacco control in Africa, and highlights how stakeholders are harnessing TCDI Data to counter industry interference.

Building a Sustainable Cashew Sector in West Africa Through Data and Collaboration
Cashew-IN project came to an end in August 2024 after four years of working with government agencies, producers, traders, processors, and development partners in the five implementing countries to co-create an online tool aimed to inform, support, promote, and strengthen Africa’s cashew industry. This blog outlines some of the key project highlights, including some of the challenges we faced, lessons learned, success stories, and identified opportunities for a more competitive cashew sector in West Africa.

Digital Transformation for Public Value: Development Gateway’s Insights from Agriculture & Open Contracting
In today’s fast-evolving world, governments and public organizations are under more pressure than ever before to deliver efficient, transparent services that align with public expectations. In this blog, we delve into the key concepts behind digital transformation and how it can enhance public value by promoting transparency, informing policy, and supporting evidence-based decision-making.