The VIFAA Kenya Stakeholder Workshop: Open Doors for Engagement
Since November 2018, Development Gateway (DG) has led the Visualizing Insights on Fertilizer for African Agriculture (VIFAA) program, a four-year partnership with the Bill & Melinda Gates Foundation. VIFAA is working to address the supply, demand, and use of fertilizer data at both country and regional levels. To do so, we’re focusing on cross-stakeholder collaboration, filling key data gaps, co-designing dashboards, and supporting data use change management across Kenya and two other countries in Sub-Saharan Africa.
Understanding and addressing key data – and data use – gaps
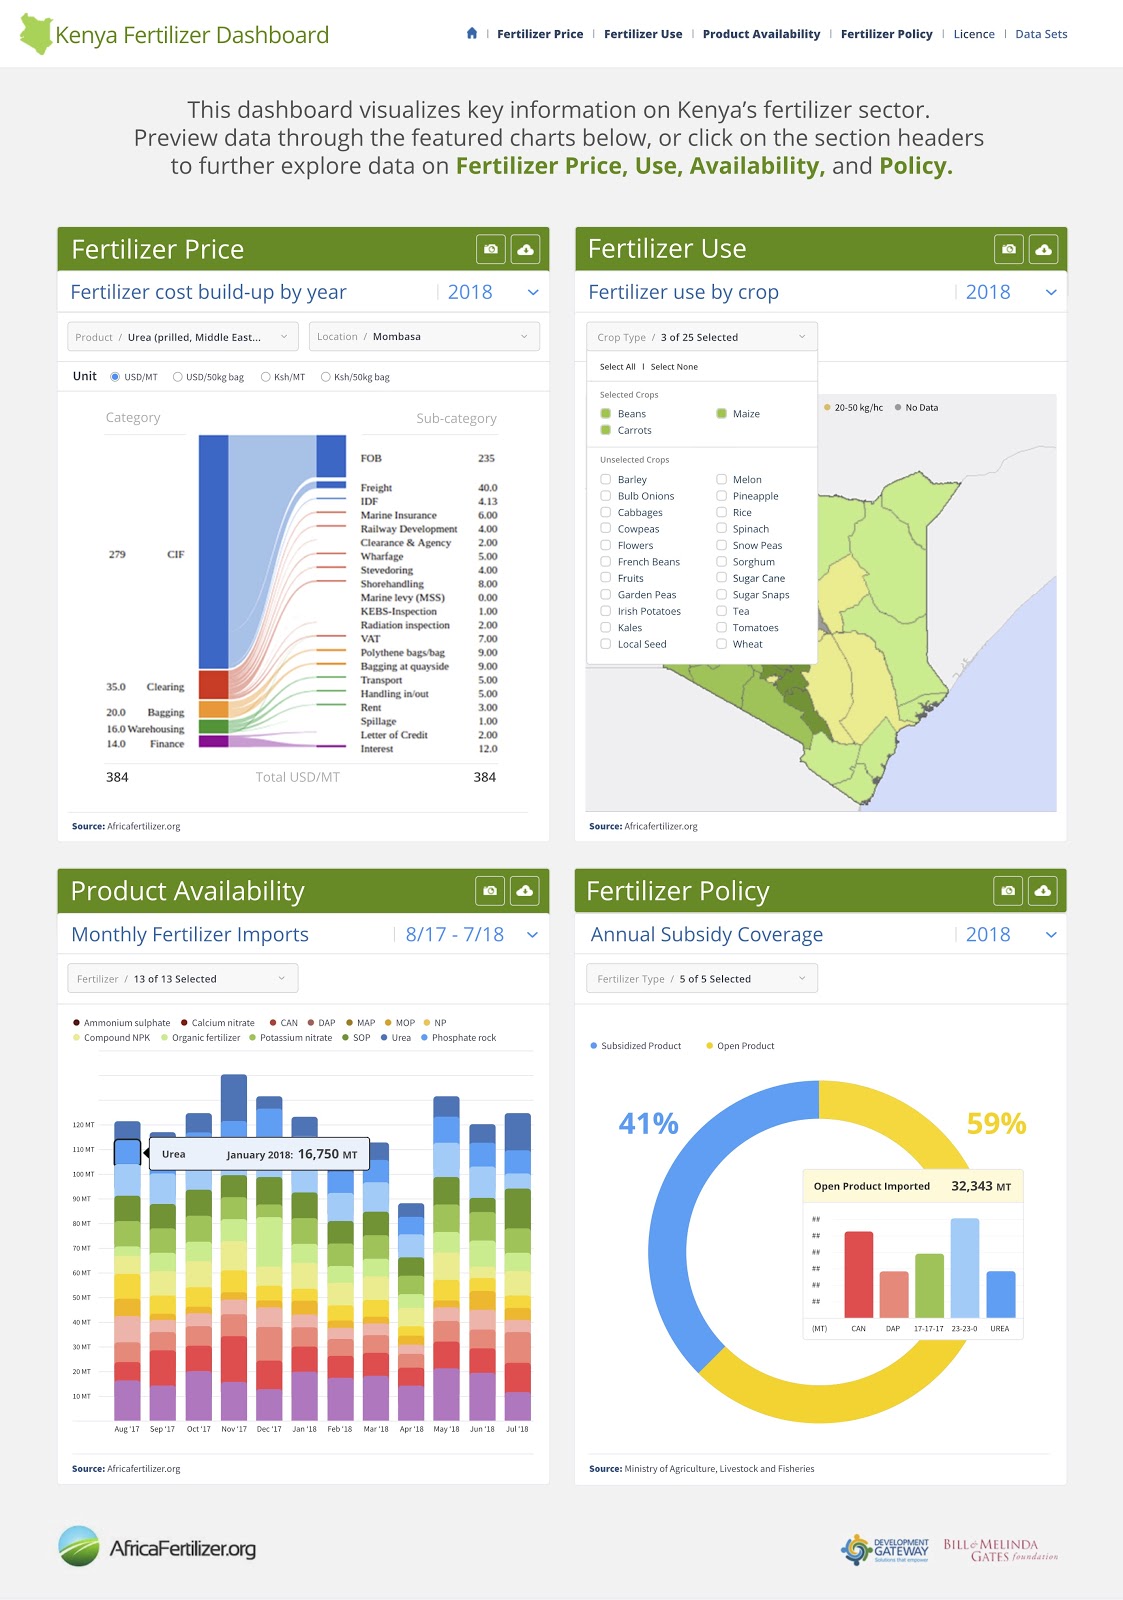
Kicking off the program in Kenya, the VIFAA team has been hard at work developing a prototype of the Kenya fertilizer dashboard homepage. Last month, the VIFAA Kenya team brought together fertilizer stakeholders from across national government, private sector, development partners (DPs), and research institutions to gather feedback on the dashboard. This stakeholder meeting followed up on the VIFAA Kenya kick-off workshop held earlier this summer. Across VIFAA, we’re driving a continuous effort to consult country stakeholders every step of the way to understand and address key data – and data use – gaps.
A workshop tailored to meet stakeholders’ decision-making needs

We focused on ensuring that participants understood the overarching technical approach to dashboard development, including the technical requirements behind calculating and visualizing key indicators, chart filters, and layout. The complete dashboard will include visualizations of 12 shortlisted indicators co-designed with stakeholders in the kick-off meeting – prioritizing key elements like price and production information, product availability and diversity, and consumption data. We also collected feedback on whether design choices for each indicator can effectively inform the use cases previously identified by the participants.
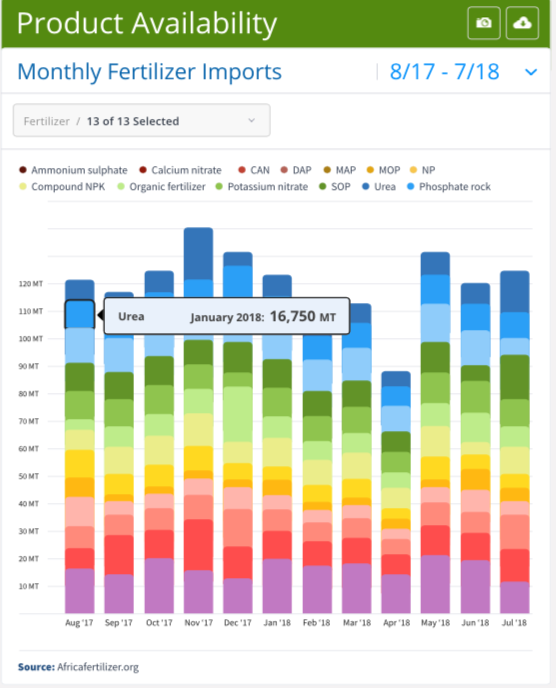
For example, we knew that participants would benefit greatly from monthly import data on all fertilizer products. This would support all stakeholders in import and logistics planning, particularly in the private sector and local government, and would support the national government in subsidy planning.
Participants confirmed that the stacked bar chart DG created addresses these needs, to compare fertilizer quantities imported across different months and years. They can also compare differences in total fertilizer imported across years, and complement this information with crop productivity data to review the effects of fertilizer use.
Design Improvements for User Engagement

The Kenya fertilizer dashboard currently showcases four graphics: fertilizer cost build-up, a breakdown of various import and distribution costs for moving a product from port to a given hub; fertilizer use by crop, the application rate of fertilizers by county and crop type; monthly fertilizer imports, the quantity of fertilizer products available; and annual subsidized fertilizer imports, the percent of product imported for government subsidy versus the open market. In sharing the graphics with stakeholders, we collected feedback to improve the visualizations’ ease of use, ease of interpretation, and usefulness.
We’ll employ useful feedback from the stakeholder meeting to iterate on the user interface. For example, we’ll add tooltips to help users better understand functionalities, and simplify some graphics to further align with user priorities.
Next Steps
Since the kickoff workshop and the feedback meeting, VIFAA participant engagement and project ownership remains strong. Participants also requested to be involved in ensuring tool sustainability. Moving forward, they’ll help us map out data sources to fill remaining data gaps, and will be key to building our engagement strategy for target users.
Continuous stakeholder engagement is key not only at the beginning, but throughout the process. For example, in November we will consult stakeholders on next steps for addressing the data gaps we identified in the last workshop – including data source ownership and accessibility.
The door is open throughout the process, not only in initial tool design. And in the meantime before the next stakeholder meeting, we’re continuing to develop and iterate on the dashboard, incorporating feedback from the September meeting and staying in step with stakeholders to meet their specific needs.
Share This Post
Related from our library

From Standardization to Specificity: Localizing Multi-Country Research
Multi-country research must balance consistency with local realities. While standardization allows reliable comparisons and generalizable insights, local context shapes outcomes. This blog explores how programs can strike that balance effectively.

Economic Toll of Tobacco-Related Diseases in Kenya: New Research Findings
Development Gateway: An IREX Venture (DG) is pleased to announce the publication of a research manuscript on the Economic Costs of Tobacco-Related Illnesses in Kenya. This research was carried out as part of the Tobacco Control Data Initiative (TCDI) activities in Kenya and is part of a broader report on Morbidity and Mortality from Tobacco Use in Kenya.

Unlocking Africa’s Agricultural Potential: Introducing the Soil Nutrient Roadmap
For over a decade, Development Gateway: An IREX Venture (DG) has been at the forefront of digital agriculture, leveraging agricultural data to support input monitoring, value chain analysis, and farmer-centric governance models. With funding from the Gates Foundation, DG is launching the Soil Nutrient Roadmap (SNR), a cutting-edge initiative using geospatial data to estimate current and future soil and crop nutrient requirements.