Data Visualization for Development Planning at European Development Days
The 7th edition of the European Development Days (EDDs) took place in Brussels, Belgium, in October 2012. Organised by the European Commission, the EDDs is the main forum on international affairs and development cooperation in Europe. The forum serves as a veritable melting pot of development advocates, decision-makers and practitioners, bringing together some 6,000 people and 1,500 organisations annually to learn from each other’s best practices, discuss and network.
Over the years, the EDDs have also resulted in forward-looking recommendations ahead of key international summits. For instance, two years after the adoption of the Accra Agenda for Action, key actors assessed the progress made and challenges ahead, which were also discussed at the High Level Forum in Busan in 2011.
Spiros Voyadzis and Anna Lauridsen from Development Gateway International attended the 7th EDDs and presented a session on geocoding entitled “Data Visualization for Development Planning” focused on the Climate Change and African Political Stability Dashboards (CCAPS), which track conflict and environmental conditions across Africa, plus all aid projects in Malawi.
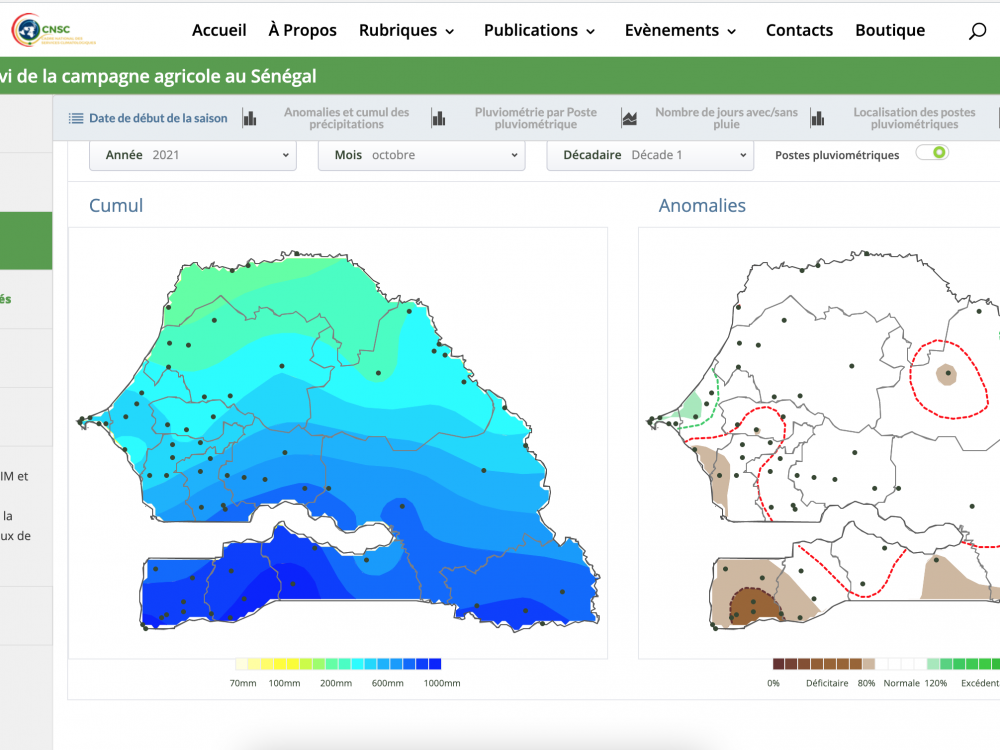
The basis for this work is geocoding, which is the process of tagging aid activity records with precise geographical information, identifying the district, town, or even latitude and longitude where a project is active. While geocoding of aid activities answers questions of who is doing what and where, the dashboards demonstrate how combining open data and visualisation techniques can produce information on the performance and impact of projects. This enables donors, recipients, and civil society organizations to more easily understand where aid activities are taking place, to monitor implementation, and to evaluate their effectiveness.
The session highlighted what the powerful combination of geographical data and visualisation techniques can achieve by demonstrating how investments in various development sectors can be more successfully targeted thanks to better informed decisions based on data visualizations of aid activities. On a larger scale, this also indicates how open data and geocoding can contribute to attaining the EU’s objectives following the Busan HLF on aid effectiveness, by improving donor coordination, facilitating the division of labour, and reducing aid fragmentation in partner countries.
Share This Post
Related from our library

How Useful Is AI for Development? Three Key Lessons
The development world is buzzing with excitement over the idea that new and emerging applications of AI can supercharge economic growth, accelerate climate change mitigation, reduce inequalities, and more. But what does this look like in real life?
At a Glance | Tracking Climate Finance in Africa: Political and Technical Insights on Building Sustainable Digital Public Goods
In order to combat the effects of climate change, financing is needed to fund effective climate fighting strategies. Our white paper, “Tracking Climate Finance in Africa: Political and Technical Insights on Building Sustainable Digital Public Goods,” explores the importance of climate finance tracking, common barriers to establishing climate finance tracking systems, and five insights on developing climate finance tracking systems.
AD3ventures in Mapping
Administrative data – data from civil registration and vital statistics systems, and sectoral (health, education, judicial, social protection) management information systems – is rich with insights on citizen needs and priorities. Though timely and disaggregated administrative data can complement official statistics, it comes with its own data quality, availability, and use challenges.