How IREX and DG’s Data Ecosystem Assessment Tools Advance Local Priorities
IREX and Development Gateway each bring unique tools and expertise to their strategic partnership that expand the range of resources available to support local leaders and communities around the world. Both organizations place a high value on identifying the solutions most relevant to local contexts, which helps us partner seamlessly. This is illustrated in the complementary assessment tools for institutional data ecosystems—IREX’s Data Compass and Development Gateway’s Custom Assessment Landscaping Methodology (CALM).
Both IREX and Development Gateway believe that a strong data ecosystem can support an institution’s ability to systematically increase their impact, particularly at the sub-national and local levels. An institution’s data ecosystem reflects their unique data infrastructure environment (i.e., systems and resources that support the consumption and production of data), staff and their skill sets, processes and policies which work together towards creating value from data, and in some instances, help other stakeholders (e.g., civil society, academia, government, international organizations, private sector, and individual citizens) to benefit from it. Addressing local challenges and issues demands vibrant engagement between these diverse elements to continuously inform activities and adapt to evolving conditions. For local institutions with limited resources to invest, having a clear awareness of the key barriers fostering inefficiencies and opportunities for improvement can facilitate sustainable impact to meet their unique local priorities.
What are data ecosystem assessments?
In global development, there are a wide range of data ecosystem assessment tools that differ in methodology, outputs, and objectives. Some, like Data Compass and CALM, look into how an organization uses data for a specific issue. Others analyze how organizations contribute to data use across a sector (e.g., health or education) or across a system on a specific thematic focus (e.g., transparency or digital ecosystems). The various data assessment tools produce different outputs because there is not much consensus, with the exception of data infrastructure, policies and processes, on which elements and details are important to incorporate when analyzing a data ecosystem. Many of the tools also do not center local priorities. While Data Compass and CALM each produce different outputs based on different needs, both emphasize a methodology that prioritizes local collaboration and development to produce insights and outputs that reflect local priorities and actionable recommendations that institutions can own and implement.
The following adaptive and collaborative exercises are specific examples of how Data Compass and CALM assess data ecosystems to support institutions with activities that are actionable and solutions that are sustainable:
- Mapping the ecosystem and defining the root problem,
- Interviewing local staff and stakeholders,
- Conducting a technical assessment and validating findings, and
- Identifying recommendations and designing solutions with the institution.
What is the Data Compass?
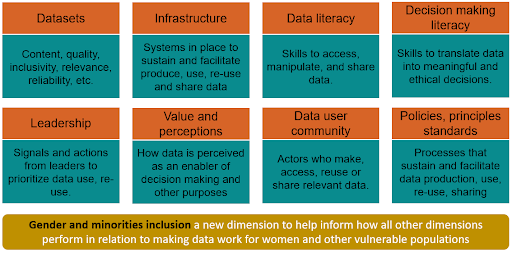
Data Compass assesses eight dimensions of data use relevant to a specific challenge or issue with which an organization routinely deals in order to inform how data is being used to make decisions around the issue, understand it better, learn from it, and/or seek relevant solutions. The dimensions include datasets; infrastructure; data literacy; decision-making literacy; leadership; value and perception; data user community; policies, principles, and standards; and a cross-cutting gender and social inclusion dimension. Rather than providing a prescriptive list of expected capacities, the assessment considers organizations’ unique operating environment, priorities, and limitations.

The final assessment of each dimension informs the “direction” of the activities, providing dimensions with the highest priority of investment for sustainable results, recommendations to achieve those results, baseline metrics to monitor progress, and an action plan designed with local leaders and staff they can commit to implement.
Case study for Data Compass
As part of the Data Zetu project in Tanzania, funded by the Data Collaboratives for Local Impact (DCLI), IREX was commissioned to use Data Compass to assess the ability of rural health facilities to use data as part of the Direct Health Facility Financing system rollout, and provide recommendations that would help facilities maximize the use of the system.
What is CALM?
CALM focuses on assessing the data landscape that an organization operates within to support the organization on their journey to enable better data-driven decision-making, specifically through digital transformation, process improvements, or strategic investments in data. CALM maps the organization’s needs to make decisions and then analyzes the business processes and components needed to enable data-driven decision-making. These components include data availability, quality, and interoperability; capacity and skills; and authority/agency for change. CALM pairs research methods with mixed-methods evaluation tools for user-centered solutions that are anchored by the organization’s strategic priorities, combined with the staff’s needs to make decisions to advance those priorities. The final products from a CALM assessment include:
- A data landscape analysis that identifies the context, opportunities, and challenges for data-driven decision-making,
- An action plan for strategic investments and improvements,
- User journeys based on key personas that can be applied for improvements to the technology and business process improvements,
- Design of data or digital strategies, and
- Design of technology solutions (such as MIS tools or dashboards) and data reporting or management process.

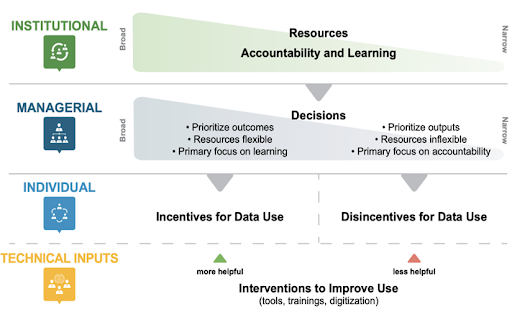
Image 2: Decision-making spaces analyzed with CALM during ecosystem landscapes
Case study for CALM
Development Gateway collaborated with Malawi’s Ministry of Agriculture to complete a landscape analysis of the agriculture sector. Through desk research and key stakeholder interviews, the team mapped the priority decisions, existing data, existing tools, and barriers for data use within the agriculture sector. This information was then used to design the National Agriculture Management Information System (NAMIS).
How do these tools advance local priorities?
Data Compass and CALM are intended for different contexts and produce different outputs, but both meaningfully prioritize collaboration at the sub-national and local levels directly to develop solutions and advance local priorities, which fosters more sustainable impact. This is achieved in the following ways:
- The tools are flexible and customized to the priorities articulated by local leaders.
- Data collection processes ensure accessibility and inclusiveness reflective of the local environment and community.
- Reasonable recommendations are informed by recurring feedback loops with diverse stakeholders.
- Local leadership identifies and commits to the activities to invest.
As the strategic partnership between IREX and Development Gateway unfolds, both organizations are exploring ways to incorporate each of these tools into their projects. Ultimately, Data Compass and CALM will be used to expand IREX and Development Gateway’s contributions to the data ecosystem assessment landscape and advance local priorities with their partner institutions.
Share
Recent Posts

Development Gateway Collaborates with 50×2030 Initiative on Data Use in Agriculture
Development Gateway announces the launch of the Data Interoperability and Governance program to collaborate with the 50x2030 initiative on data use in agriculture in Senegal for evidence-based policymaking.

Strengthening Online Safety Through Prevention in the Philippines
Tech-Facilitated Gender-Based Violence continues to evolve alongside emerging technologies. This blog explores how preventative measures, such as the Safety By Design approach, can be used to create a safer internet.

Preparing Jordan’s Education System for the AI Age
This blog introduces Asas, an early grade education program led by IREX and DG in partnership with Jordan’s Ministry of Education, and explores what AI readiness looks like in early grades and how AI can be integrated safely and sustainably into education systems.