Adaptive Technology: EITI’s New Validation Scorecard
Stephen Hawking famously observed that “Intelligence is the ability to adapt to change.” As with humans, technology tools must also adapt to changes within organizations if they are to remain useful, and, well, “intelligent”. So what does technology adaptation look like in practice, and how can we make the most of it?
For the Extractives Industries Transparency Initiative (EITI), the adaptation at hand was the EITI Validation process—the way in which the EITI Board evaluates the progress of member countries. “In 2016, the EITI Board revised the Validation system to recognize the broader scope of the 2016 EITI Standard and the diversity of EITI implementing countries”, notes Sam Bartlett, the EITI’s Technical Director. “The new Validation system shifts the focus away from a binary “pass-fail” system, toward a more nuanced assessment that recognizes continuous improvement”. This implies moving from a simple rating system to a scorecard with 34 different requirements, a wider range of assessments, and an overall assessment.
Our task? To translate and visualize this new approach on the EITI Data Portal. Before writing a single line of code, our team agreed upon three guiding goals: to create dynamic scorecards that a) people would use, b) make data management easy for EITI staff, and c) consider future needs.
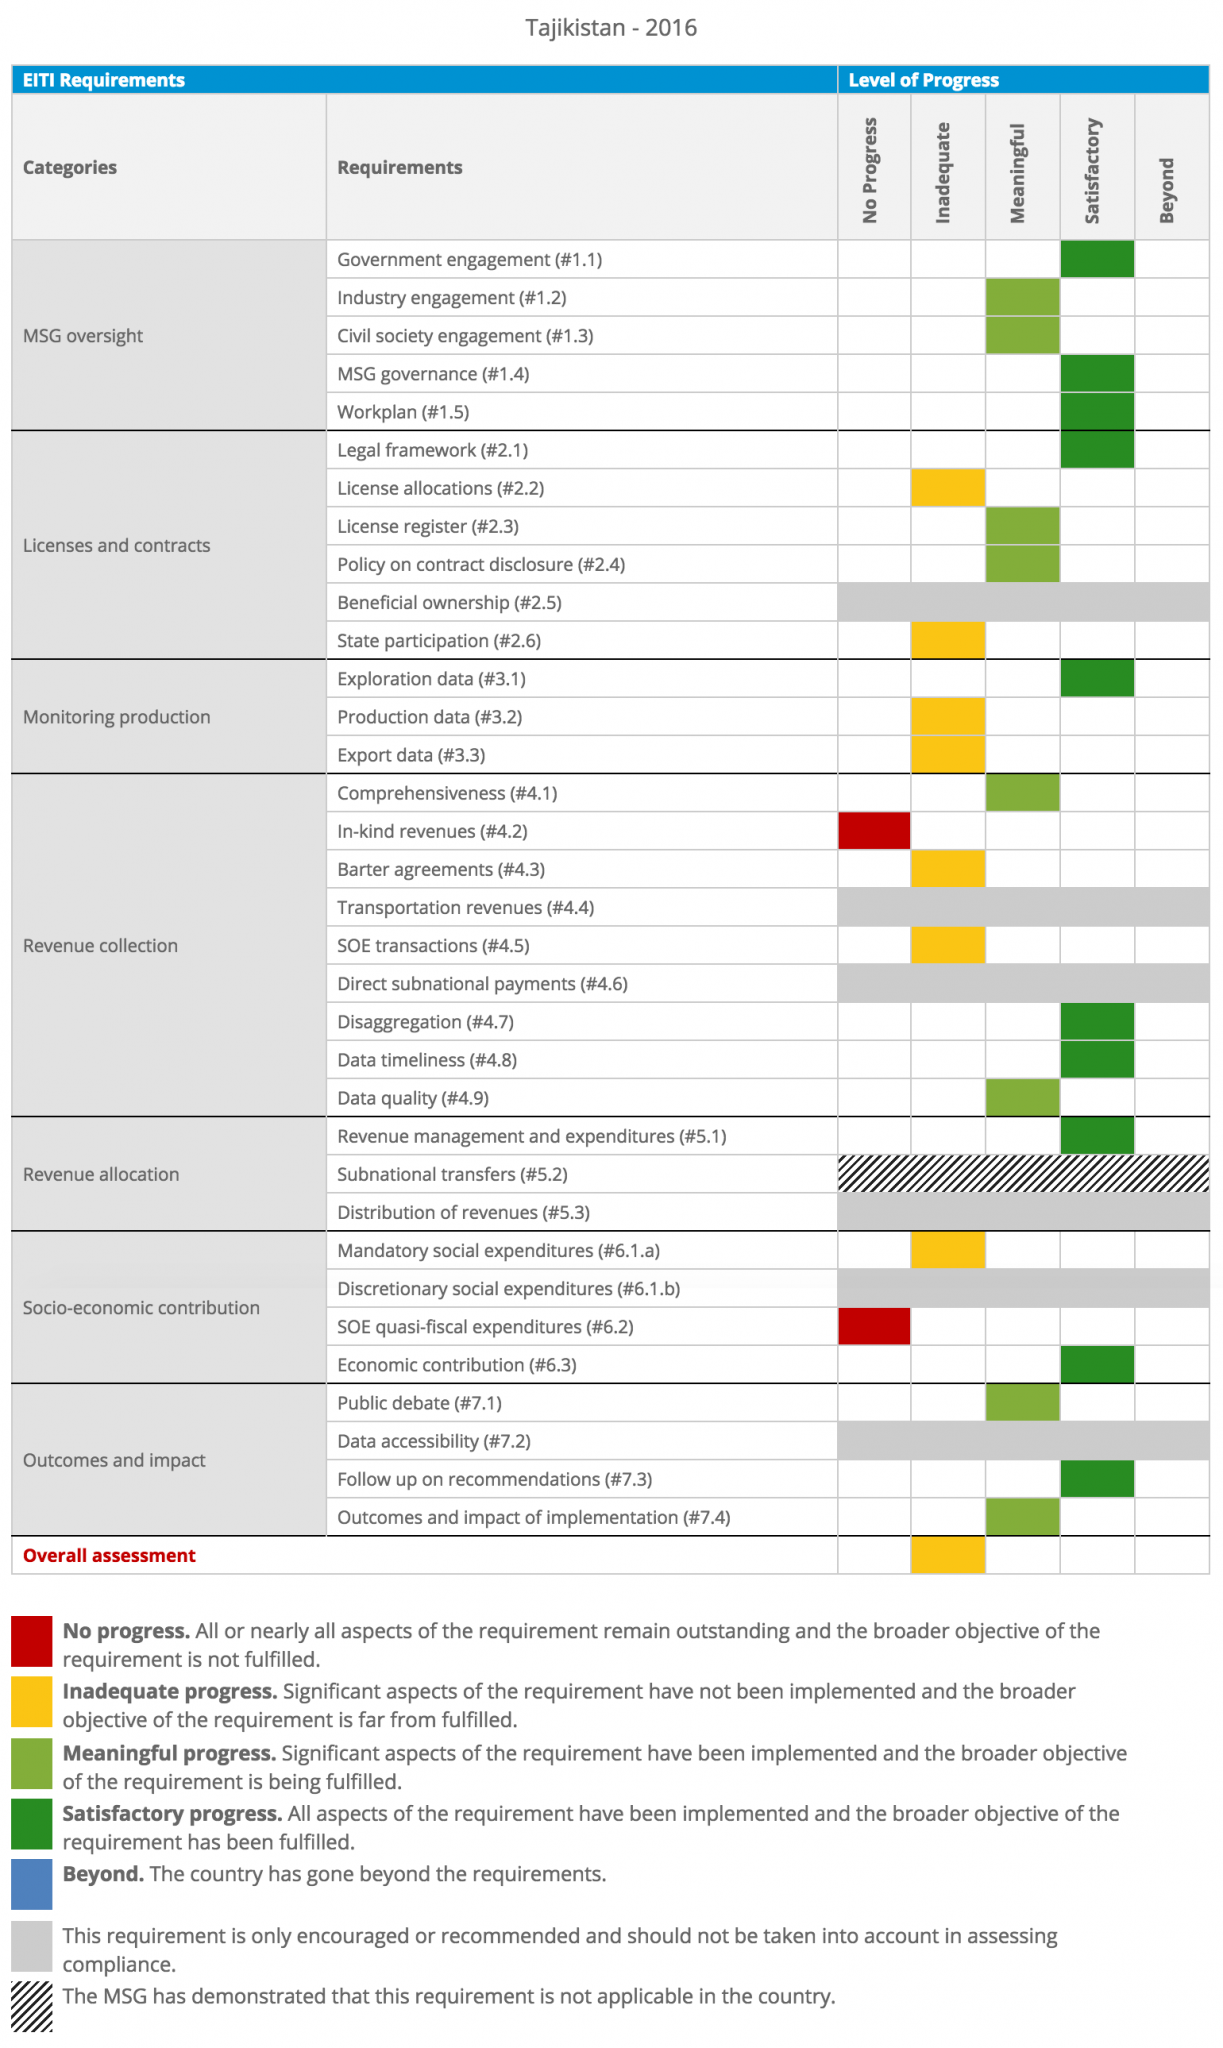
Figure 1: Dynamic Country Validation Scorecard
Creating Dynamic Scorecards
Working hand-in-hand with EITI on the design, we converted mockups into a dynamic template that uses backend data (through an API) to render the scorecards. This mirrored our approach to converting EITI’s Summary Data (previously housed in Google Sheets) into a flexible datastore with an API. The result of moving from content to data? Other organizations, national secretariats, investors, and CSOs can now extract and use the data for visualizations on their own websites, and interact with the raw data using the JSON API. In addition, as more countries advance their validation processes, new data will be dynamically reflected in the scorecard data endpoint.
Intuitive Data Management
When designing data management tools, it’s tempting to get excited about a sleek interface and dynamic visualizations. But it’s equally crucial to consider the human beings who will manage this data each day. We aimed to make the data entry and management process smooth, easy, and intuitive for our EITI colleagues, who are already managing large amounts of data. To do this, we created the data entry form using the same layout and design used in the rest of the platform, making it easy for anyone familiar with the data entry process of the EITI Data portal.
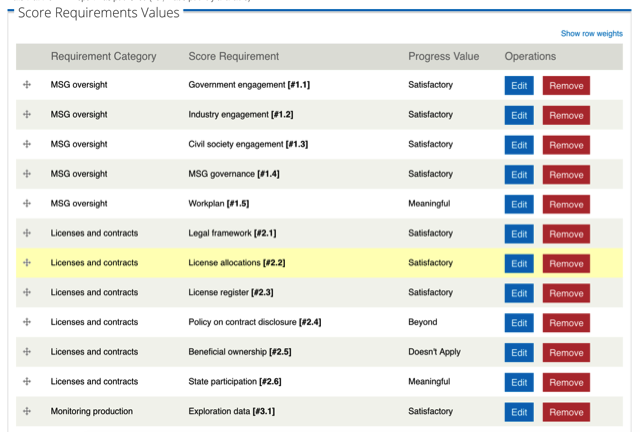
Figure 2: Scorecard – Data Edit Form
Capitalizing on change
Adaptation also creates new opportunities. The new EITI Validation process began recently, and the available data spans one year. However, we’ve positioned the data and technology for some exciting future insights on Validation. In time, as with the new backend created through the new Data Portal, researchers, investors, country governments, and CSOs will be able to visualize and mine time series and disaggregated country data—offering new insights into “what works” for EITI countries moving up the chain.
At DG, accessibility, usability, and use of data is our passion. Building technology with the future in mind means designing tools that can flex and adapt to evolving business practices—while capitalizing on new opportunities for future understanding.
Image: EITI Data Portal Homepage
Share This Post
Related from our library

Introducing The HackCorruption Civic Tech Tools Repository
Introducing the Civic Tech Tools Repository: an open-source hub of digital solutions to fight corruption. Designed for growth through GitHub contributions, it brings together tools, code, and resources across six key areas for HackCorruption teams and beyond.

Beyond Kigali: Where Does Africa Go from Here with AI?
As the AI momentum builds, Development Gateway is asking different questions: where the data comes from, how reliable it is, how legacy systems will supply usable data, and whether governments have the capacity to govern and trust the AI tools they’re being urged to adopt.

Building a Sustainable Cashew Sector in West Africa Through Data and Collaboration
Cashew-IN project came to an end in August 2024 after four years of working with government agencies, producers, traders, processors, and development partners in the five implementing countries to co-create an online tool aimed to inform, support, promote, and strengthen Africa’s cashew industry. This blog outlines some of the key project highlights, including some of the challenges we faced, lessons learned, success stories, and identified opportunities for a more competitive cashew sector in West Africa.