
The Need for Health Taxes to Raise Revenues
The social sector is operating amidst periods of unprecedented uncertainty and a shifting political landscape and priorities. As a result, there is a significant need for increased domestic resource mobilization for foreign aid. Economists have found that as of mid-2025, official development assistance (ODA) has decreased between $41 billion and $60 billion compared to 2023 levels of $228.3 billion. Additionally, countries in sub-Saharan Africa are expected to see a total decline of 16% to 28% by the end of the year.
These deficits lead to an unexpected shock of financial sources that fund essential government services – from education to health. As an example, in Côte d’Ivoire, 8,600 healthcare providers who provide essential services have been terminated. In Southeast Asia, Myanmar terminated its supply of malaria diagnostic tests and drugs, despite a 10 times increase in cases compared to previous years (Source).
Within this context, the UN held the fourth Financing for Development Conference, bringing together more than 60 heads of state, as well as high-ranking officials from development banks and multilateral institutions from around the world, and 15,000 attendees to tackle how countries may address the financing for these services. The conference and outcomes document spoke of a number of measures, including increased financial transparency and a need for innovative blended finance mechanisms. Conversations on these issues will continue from mid-late September in New York during the UN General Assembly (UNGA), and we hope, in particular, one method will receive more attention: the key role health taxes can fill in closing the financing gap.
To speak to this issue, representatives from the World Health Organization (WHO), Tax Justice Network Africa (TJNA), and Development Gateway: An IREX Venture (DG) came together to discuss the critical role of health taxes in mobilizing domestic resources for health.

Development Gateway’s Experience
Development Gateway has direct experience in supporting more effective tax policy through providing access to clear evidence and best practices. Through the Tobacco Control Data Initiative, an ongoing tobacco control program in seven African countries, the program aggregates and visualizes data related to tobacco legislation. DG developed six country-specific websites that display tobacco research through close collaboration with government ministries such as ministries of health, finance, trade, as well as civil society organizations, academics, and local research firms.
Through this process of developing and sharing this information, DG successfully provided key evidence and information in the lead-up to tax reform in several priority countries. For example, Nigeria updated its specific tobacco taxes by 30% in 2022 after consultation with DG and other key stakeholders. In Ethiopia, the Ethiopian Food and Drug Authority and the Ministry of Finance used the tax modeling we had developed – in conjunction with the University of Cape Town – to understand the impact of different tax scenarios. With that information, they updated the excise tax in 2020 and in 2024. The average tax collected per pack was increased from 4.12 Birr to 12.4 (approximately US$0.086), and an 8 Birr Specific tax was added per pack, in line with best practices. These increased tobacco taxes lead directly to increased funding available for health expenditures.
WHO’s Experience
The World Health Organization discussed its launch of a new initiative: the 3 by 35 initiative. This initiative is a bold movement for countries worldwide to increase the real prices by 50% of three unhealthy products – alcohol, tobacco, and sugary drinks – by 2035. This movement showcases how taxes are a critical tool to raise revenue and save lives. WHO states that a “one-time tax increase sufficient to raise prices by 50% could generate up to US$3.7 trillion in new revenue globally within five years, or an average of US$740 billion per year – equivalent to 0.75% of global GDP.”
Tax Justice Network Africa’s Experience
Since 2017, TJNA has worked with national partners in seven African countries (Democratic Republic of Congo, Ghana, Kenya, Nigeria, Senegal, South Africa, Zambia) to implement the Tobacco Tax Advocacy in Africa (TTAA) project. Through targeted policy advocacy, the partners promote increases in tobacco excise tax in order to raise domestic revenue and decrease the affordability and consumption of tobacco and nicotine products. Pivotal to the process is the tax structure implemented in each country. As such, the TTAA partners advocate for specific or mixed tax structures to enhance administrative capacities and price movement.
The TTAA project has yielded various positive results – the most recent being in Ghana with the enactment of the Excise Duty Amendment Act, 2023 (Act 1093). The Act revised the tax structure to include a specific tax component and reduced the ad valorem excise rate from 175% to 50%. A post-enactment assessment reveals that retail prices of cigarettes increased between May 2023 and May 2024 for almost all brands. Tobacco excise revenue increased from GHS189 million in 2022 to GHS252 million (approximately US$20 million) in the first half of 2024. Simultaneously, Kenya, Nigeria, while the South African and Zambian Ministries of Finance announced above-inflation (real) increases in tobacco excise tax.

Next Steps
As nations and partners go into further discussions on financing during UNGA meetings, it’s more important than ever for smart investments and policy decisions to raise needed revenue for critical services. Government agencies have the opportunity to capitalize on this moment of reduced foreign investment to review their tax structure and ensure that their taxes on tobacco products, sugary-sweetened beverages, and tobacco are in line with evidence-based best practices. These include (1) a tax policy that leads to a real price increase on these products and (2) a regular process of updating these taxes to keep up with inflation. As stated by Dr. Jeremy Farrar, Assistant Director-General of WHO, “Health taxes are one of the most efficient tools we have. They cut the consumption of harmful products and create revenue governments can reinvest in health care, education, and social protection.”
For African governments looking for country-specific recommendations on tobacco tax, we recommend the resources available at tobaccocontroldata.org. For other questions, we recommend that government officials reach out to the Tax Justice Network Africa and the Health Taxes Unit in the WHO for individual consultation. The opportunity is now to capitalize on these opportunities to mobilize resources for much-needed healthcare.

From Data to Impact: Why Data Visualization Matters in Agriculture
A lot has been said about the importance of data and data-driven decision-making. However, having data isn’t enough; what matters is being able to understand it and apply it to enable better decisions.
Research across disciplines has shown strong evidence that visualizing data, rather than presenting numbers alone, significantly enhances how people comprehend and use information. Easy-to-follow visualizations help deliver more information while making it easier for our brains to process, reducing the mental effort required to interpret complex datasets.
In fields such as agriculture, where decisions can have long-term consequences, having user-friendly data tools becomes even more crucial. Decision-makers across various levels, whether they’re farmers in the field or government policymakers, need tools that not only provide data but also make it usable and actionable.
Data visualization training as an entry to data use
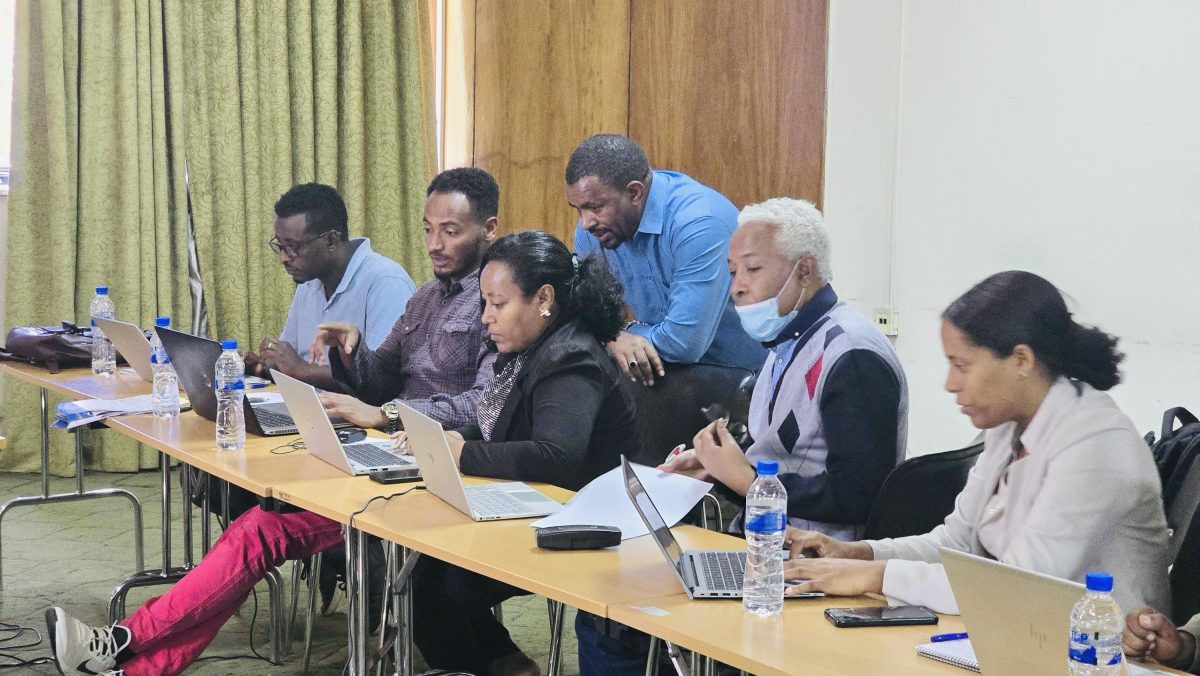
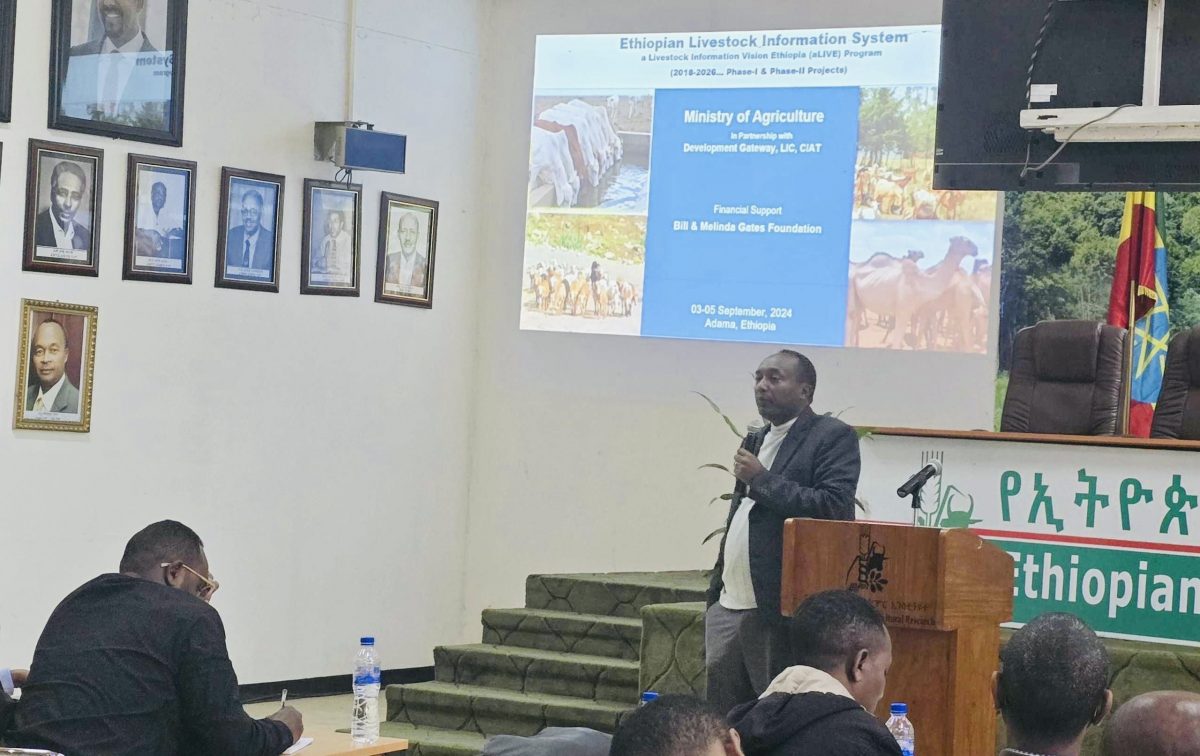
The Ethiopian Ministry of Agriculture (MoA), along with the Ministry of Regional Trade & Integration (MoTRI) and the Livestock Development Institute (LDI) manages significant volumes of livestock data covering disease, markets, and genetics. However, the gap in technical capacity hindered effective data management, analysis, and use in decision-making. To this end, the a Livestock Information Vision for Ethiopia (aLIVE) program, funded by the Gates Foundation, conducted a series of structured and hands-on training in data visualization techniques in November 2023 and January 2024 with the goal of increasing data use.
Federal system owners received training with a focus on practical application in real-world scenarios, utilizing their data generated from their databases. Participants learned how to clean and manage datasets, apply Excel formulas and functions, use PivotTables and PivotCharts for data summarization, and develop interactive visualizations with Power BI. A critical component of the training emphasized key data quality principles, such as validity, integrity, precision, reliability, and timeliness, ensuring that system owners could produce reliable and accurate reports. Many trainees had prior theoretical knowledge but lacked hands-on experience, which this training effectively addressed by allowing them to work with live datasets from their databases.
Visualization improves efficiency in reporting
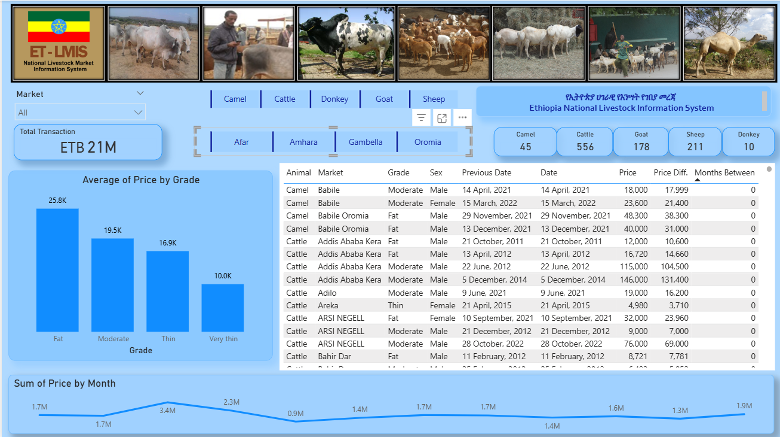
As participants began applying their new data skills, the practical benefits became clear. Being able to visualize data using tools like Power BI and PivotTables in Excel, along with advanced filtering, enabled trainees to enhance the efficiency of utilizing livestock data for various reporting purposes. The trainees reported that data tasks that previously took them several days to complete could now be done in hours or even minutes.
Systems owners as trusted intermediaries
Systems owners play a critical role in connecting and translating information from the ground up, delivering data from farmers and local stakeholders to policymakers. To do this effectively, they must be empowered data users, capable of transforming raw datasets into clear, usable insights for decision-makers. Timely, clear, and well-targeted data visualizations created by system owners are a critical enabler of informed policymaking.
When data is presented in an accessible and actionable format, it becomes far easier for policymakers to reference and utilize it. Conversely, poor decisions often stem not just from low-quality data, but from decision-makers being unable – or unwilling – to engage with overly complex or delayed data.
Through the aLIVE training program, system owners develop the ability to deliver information in a way that enables decision-makers to confidently act upon it. Importantly, this training goes beyond technical capacity. It positions system owners as trusted intermediaries in the livestock value chain – individuals who can translate raw field-level data into national-level insights that shape policies, programs, and investments.
Crucially, the program also employs a training-of-trainers (ToT) model. System owners cascade their knowledge to regional focal points, who in turn are better equipped to interpret and communicate data to local stakeholders, including farmers. For instance, once Dr. Gashaw completed the training, he immediately trained DOVAR-II owners at the Woreda level on data management and analysis.
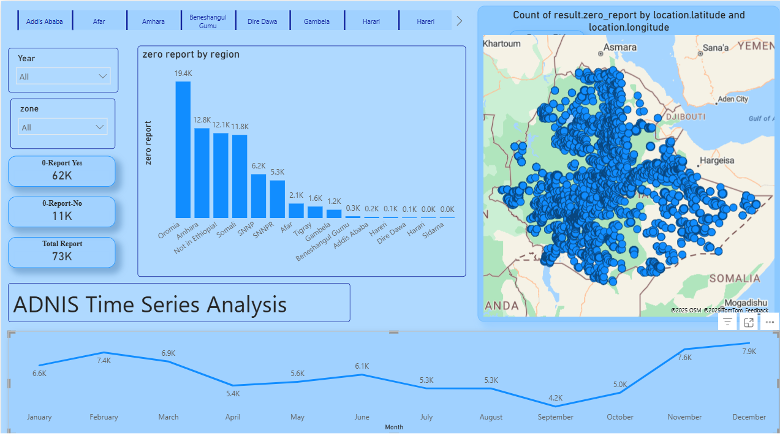
Additionally, regional focal points now use PivotTables for their own reporting. According to Dr. Tewodros, the Animal Disease Notification and Investigation System (ADNIS) System Owner at MoA, “The fact that aLIVE expanded its training to the regions based on our recommendation has simplified their data reporting and improved our ability to follow up. They have begun using Pivot Tables in their reports, and many are eager for similar and further training.”
This cascading approach helps ensure that data literacy does not remain concentrated only at the federal level but extends through the broader livestock system. By reinforcing accountability, transparency, and empowerment across different levels of governance, this approach protects and entrenches data use for the long term as it moves through the value chain.
Visualized data enables evidence-based decisions at every level
Outside of reporting, visualizing data lowers the barrier to making evidence-based decisions, especially when the visualizations are simple, like bar graphs and simplified charts. This evidence can improve decisions by introducing new insights that can shift prior beliefs, reduce uncertainty, and can be understood from federal to regional to farmer level.
Improvement in data quality awareness was noted, as described by Dr Gashaw from the DOVAR System: “Since we are not data experts, we used to consider quality issues only in relation to outliers. The training has helped me understand data quality very well, including concepts such as integrity and validity. We are now discussing how the data that comes to our system can attain these standards.”
Improving data competency facilitates a data-driven culture
Embedding a data-driven culture requires demonstrating the value of data and building stakeholders’ capacity to use it. Data visualization training serves two purposes: enhancing the utility of data and reducing entry barriers, allowing stakeholders to generate their own visualizations. With improved capacity comes an increased willingness to integrate data into daily workflows.
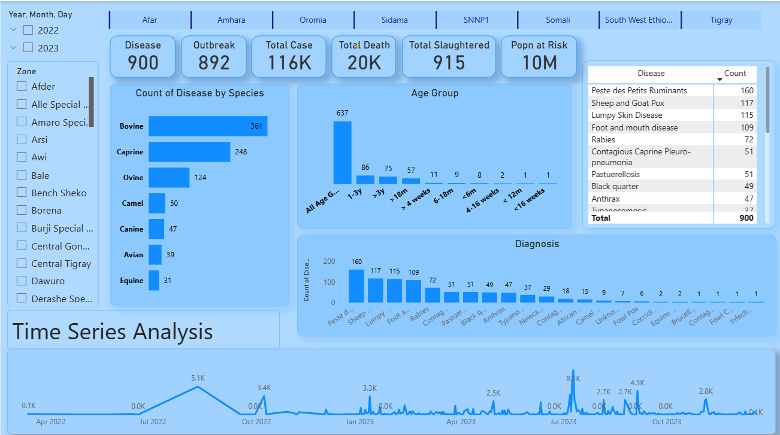
Improved competency translates into a more confident mindset when working with data and a stronger willingness to engage with data tasks without relying on external support. As a result, participants are better equipped to generate insights quickly. One expert, for instance, went on to create time series analysis to identify trends and patterns, which could help policymakers plan for the future, allocate resources more effectively, and respond to emerging challenges.
Connecting the Dots
In conclusion, visualization is not only a practical tool for data analysis but also a powerful trust-building mechanism, as making data more accessible improves stakeholders’ ability at every level to engage with and interpret information. This demystifies complex livestock systems, empowering all stakeholders to explore data independently and reinforcing both confidence in the data and its use. Dashboards and visualization can enhance communication and coordination throughout the value chain, fostering trust and attracting new, previously disengaged stakeholders who might otherwise be excluded by technical barriers.
…
This is the second blog in our series sharing lessons from the aLIVE program, which is supporting livestock decision-makers in Ethiopia by improving the accessibility and reliability of livestock data. The series examines how data can be made more accessible, actionable, and sustainable to enhance decision-making across government to farm levels.
Read the first blog here.

Introducing The HackCorruption Civic Tech Tools Repository
Working to curb corruption requires collaboration. Developers working to create innovative tech tools to increase transparency and flag corruption risks use shared knowledge and open source code to advance tools, building upon one another’s work. As Development Gateway: An IREX Venture and Accountability Lab mentored HackCorruption teams selected during regional hackathons for their innovative digital tool ideas, we noticed that these teams spent time searching for existing tools that could be built upon, as well as open source code that could be leveraged to create new tools.
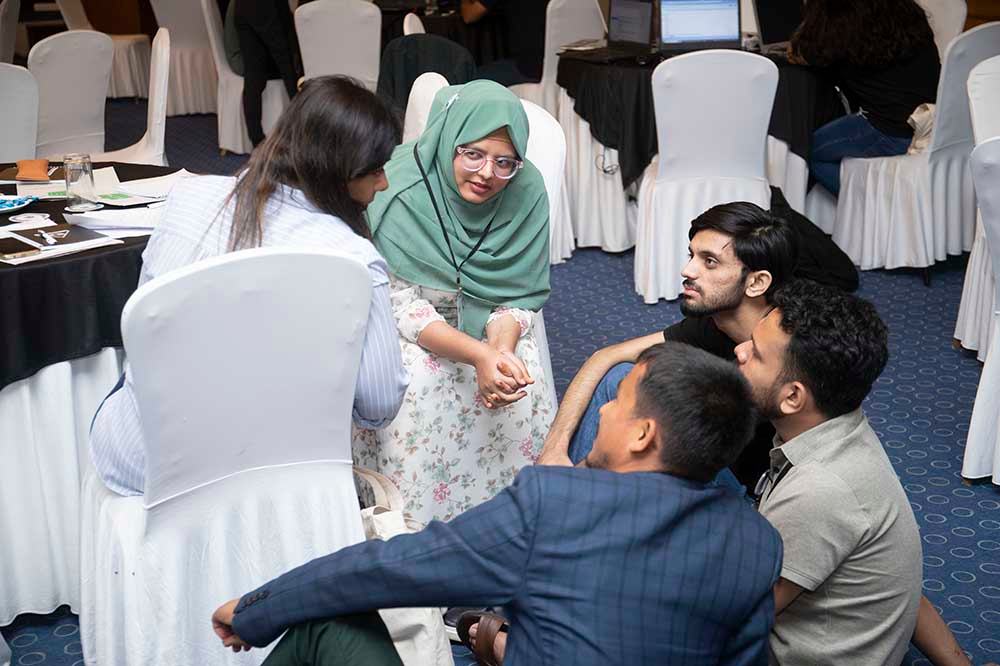 A HackCorruption gathering in Nepal, August 2024
We developed the HackCorruption Civic Tech Tools Repository as a comprehensive, open-source collection of impactful and scalable digital solutions for combating corruption to be used not only by HackCorruption teams but also by any others interested in building or enhancing digital anti-corruption tools. The repository is designed for continuous growth through community contributions via GitHub and is intended to serve as a centralized hub for tools, source code, and resources organized across six key thematic areas:
- Foundational anti-corruption data and metadata management tools
- Beneficial ownership transparency
- Open contracting
- Budget transparency and participatory budgeting
- Climate finance transparency
- Illicit financial flows
Key Features
- 41+ curated tools across multiple categories with direct access to source code
- Open-source accessibility allowing community contributions and continuous updates
- Comprehensive documentation, including technology overviews, deployment examples, intellectual property information, and impact evidence
- Wiki integration providing background information and contributor guidelines
- Global scope with geographic tagging and categorization
We invite developers and others working on anti-corruption tech tools to contribute their open source code and tools to this repository! We hope that this resource can act as a catalyst for the collaboration and cooperation required to create change and curb corruption.
Access the repository below.
Click here to learn more about HackCorruption.

Harnessing the Power of Data: Tackling Tobacco Industry Influence in Africa
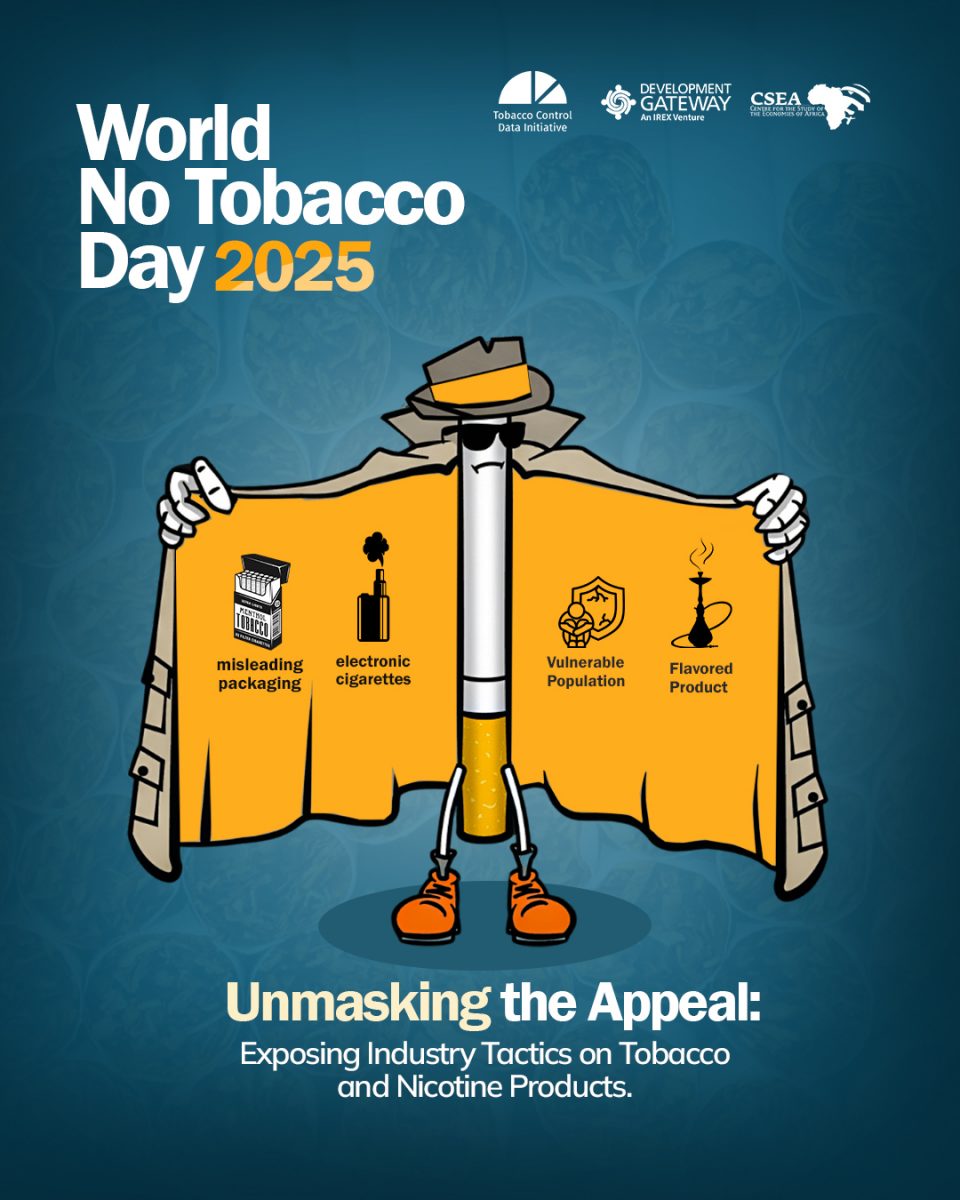
Reliable, accessible data is essential for effective tobacco control, enabling policymakers to implement stronger, evidence-based responses to evolving industry tactics and public health challenges. As spotlighted by this year’s World No Tobacco Day, themed “Unmasking the Appeal: Exposing Industry Tactics on Tobacco and Nicotine Products,” the tobacco industry continues to market its products, especially to youth, through increasingly deceptive strategies.
In support of stronger, data-driven policy responses, Development Gateway’s (DG) Tobacco Control Data Initiative (TCDI), launched in 2019 with funding from the Gates Foundation, developed country-specific websites for Kenya, Nigeria, Zambia, South Africa, Ethiopia, and the DRC. These platforms centralize trustworthy, reliable data on topics ranging from taxation and illicit trade to health burden and industry interference.
Complementing this work, DG’s Data on Youth and Tobacco in Africa (DaYTA) program, which began in 2023, focuses on filling knowledge gaps around tobacco use among 10- to 17-year-olds in Kenya, Nigeria, and the DRC. Together, these initiatives support ongoing efforts across sub-Saharan Africa to counter industry influence and strengthen tobacco control. This blog shares key research findings on tobacco industry interference from TCDI-focus countries.
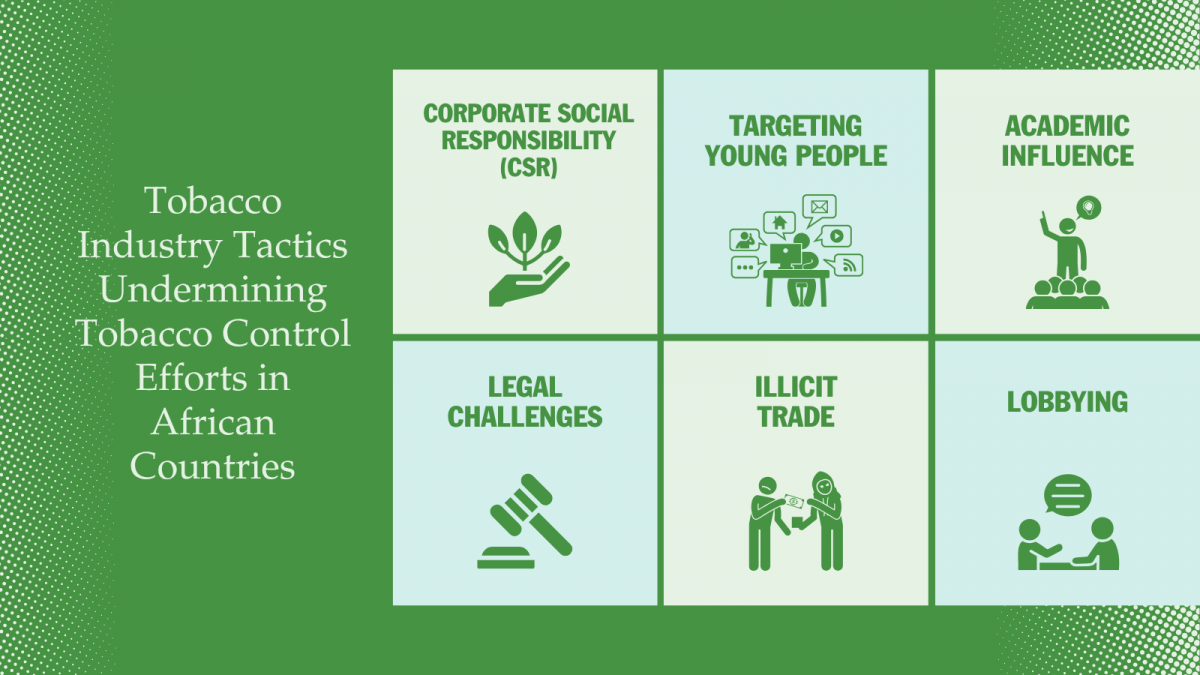
Unmasking the Appeal: How Tobacco Industry Strategies Hinder Effective Tobacco Control in Africa
Across Africa, the tobacco industry continues to employ various strategies aimed at maintaining a favorable operating environment and expanding its customer base. As a profit-driven sector, its approaches often include efforts to influence public perception, delay the implementation of health regulations, or frame its activities in ways that minimize perceived harm. Such practices can complicate policy development and slow the adoption of effective tobacco control measures, posing significant challenges to public health progress.
In Nigeria, for instance, the British American Tobacco Nigeria (BATN) Foundation targets National Youth Service Corps (NYSC) members through agricultural entrepreneurship initiatives, such as the Farmers for the Future Grant and the Graduate Agripreneur Program, reflecting a major tactic the industry uses to deflect attention from the harms of its products.
In Zambia, the Centre for Primary Care Research (CPCR), one of TCDI’s implementing partners, revealed several alarming strategies used by the industry to attract young people to tobacco and nicotine products. In their report “Big Tobacco, Tiny Targets”, published in March 2025, researchers discovered that at least one type of tobacco product was available for purchase in 99% of points of sale (POS) located within 100 meters of schools and playgrounds. In over half of these POS, flavoured cigarettes were available for purchase.
To address these realities, generating reliable, evidence-based insights is crucial in equipping public health actors with the tools needed to critically evaluate industry claims, counter misinformation, and advocate for stronger, more resilient policy and legislative frameworks.
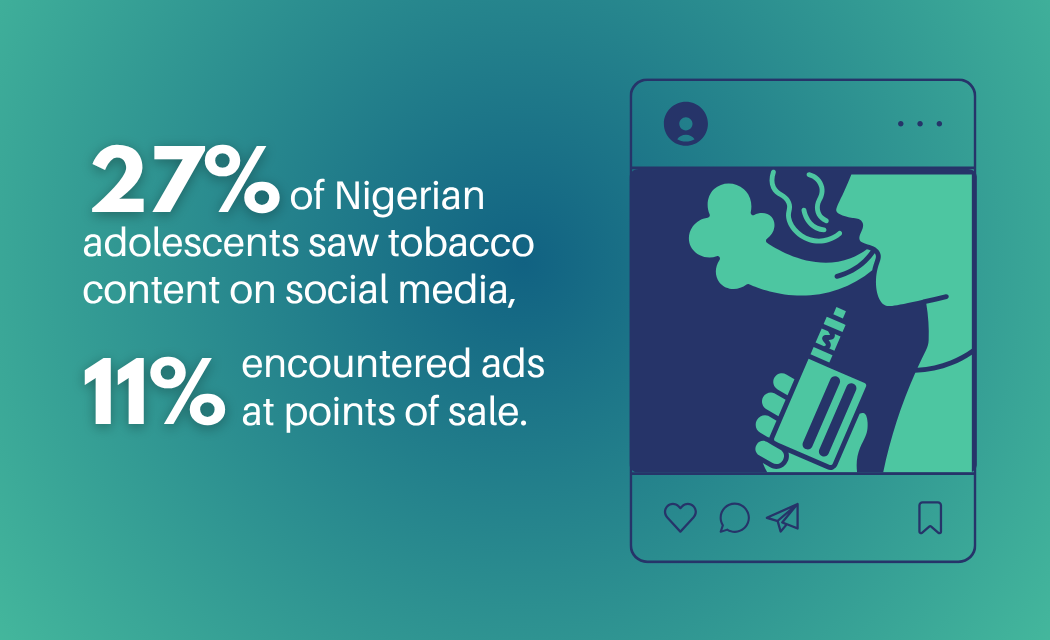
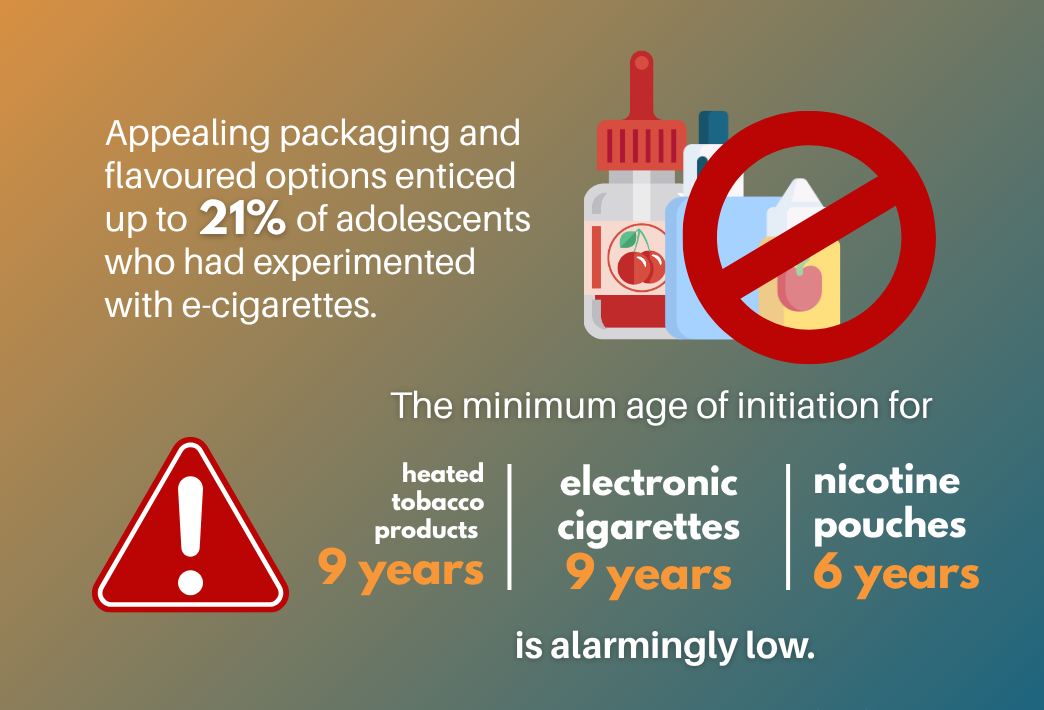
Between April and June 2024, DaYTA conducted a household-based, nationally representative survey that shed light on the reasons for initiating use of tobacco and nicotine products amongst adolescents, as well as the widespread exposure they face through both digital and in-person advertising and promotional channels. The following infographics highlight some of these key insights:
Strengthening Tobacco Control in Zambia and the Democratic Republic of the Congo
In light of the industry’s persistent efforts to obstruct tobacco control, TCDI developed dedicated industry interference pages tailored to each focus country, which compile and analyze common arguments used by the industry. These resources are designed to provide stakeholders with a deeper understanding of industry tactics and support countermeasures rooted in evidence. Timely, context-specific information on these strategies is vital for tobacco control advocates to effectively monitor, expose, and counter industry influence.
As part of TCDI’s primary research across the six focus countries, teams in the DRC and Zambia investigated the prevalence of illicit cigarette trade, a significant barrier to effective tobacco control on both the enforcement and implementation fronts. In 2022, the Zambia study found that 12.2% of over 118,000 discarded packs analyzed were illicit, lacking Zambia Revenue Authority tax stamps, required health warnings, or bearing duty-free labels despite being sold openly. Of particular concern, 10.1% of packs lacked a ZRA stamp, indicating a significant loss of government tax revenue. A summary of the study is available here.
In 2023, 8.6% of the cigarette market in DRC was found to be illicit, surging to over 51% if all imported yellow-stamped packs were included, according to the study. To support enforcement efforts, the team trained 26 provincial health inspectors, one from each province, on both the World Health Organization (WHO) Framework Convention on Tobacco Control (FCTC) and the survey’s key findings. Consequently, during this year’s WNTD, the DRC’s Minister of Health, Dr. Roger Kamba, joined forces with civil society to lead a public march to the National Assembly, where they delivered a formal memorandum urging lawmakers to ratify the Protocol to Eliminate Illicit Trade in Tobacco Products, the first protocol under the WHO FCTC and an independent international treaty designed to combat illicit tobacco trade worldwide.

This primary research represents a critical path forward in generating local evidence to guide policy, offering the most precise picture yet of illicit tobacco trade in Zambia and the DRC. It underscores the urgent need for enhanced border control, better regulation of tobacco distribution, and effective systems to track and trace these products
From Evidence to Action: How Our Stakeholders Are Harnessing TCDI Data to Counter Industry Interference
In Nigeria, the Kano Hadaka Development Initiative (KAHADI), one of TCDI’s civil society partners, has effectively leveraged data from the TCDI website to counter tobacco industry interference through a strategic, multi-pronged approach. By utilizing the platform’s robust insights, KAHADI has pinpointed high-risk populations and designed targeted interventions to reduce tobacco use. The data has also bolstered their advocacy work, equipping them to push for meaningful policy reforms across different levels of government. Guided by findings from the Nigeria portal, KAHADI has launched public awareness campaigns to educate communities on tobacco’s harms while partnering with healthcare providers, educators, and local leaders to broaden their reach and deepen impact.
Highlighting the platform’s accessibility, Suleima Aliyi, KAHADI’s Secretary, said, “The TCDI dashboard is our go-to resource for tracking tobacco use trends. It directly informs the proposals and policy recommendations we develop for government stakeholders. We’ve been able to draft multiple proposals to the Kano State Government, and we’re now preparing for a final policy meeting with the Governor.”
Building on this, Zambia’s experience highlights how data is being used across contexts to support tobacco control. Ahead of an internal legislative committee meeting, the Zambia Ministry of Health and its civil society partners conducted a strategic review of the bill’s most contentious provisions, drawing on data from the TCDI dashboards to pre-empt and counter industry arguments. To challenge claims that graphic health warnings (GHWs) are impractical, the team cited the South Africa dashboard, which features an infographic illustrating the widespread adoption of GHWs across the continent. Similarly, in anticipation of pushback around illicit trade, they referenced the Kenya dashboard to demonstrate how robust enforcement tools such as track-and-trace systems can effectively curb illicit tobacco flows.
In a July 2025 interview conducted by the TCDI Ethiopia team, Bitsat Shimeles, Senior Expert at the Narcotic Drugs, Psychotropic Substances & Tobacco Desk of Ethiopia’s Food and Drug Administration, highlighted how the industry interference page plays a vital role in supporting the government’s mitigation efforts.
Evidence across the TCDI countries points to several core priority actions for countering influence from the industry:
- Enact or fully enforce comprehensive legislation
- Ban/prohibit manipulative tobacco-funded CSR activities
- Establish clear codes of conduct for public officials
- Embrace transparency measures by mandating disclosures of all interactions with the industry and adopting more rigid conflict of interest policies
- Empower civil society to monitor interference and accountability, for both the government and industry alike.
With growing recognition of the need to address industry interference and enforce tobacco control laws, data-driven strategies, such as those supported through TCDI, underscore the value of accessible, reliable evidence that can be adapted and shared across countries facing similar tobacco control challenges.
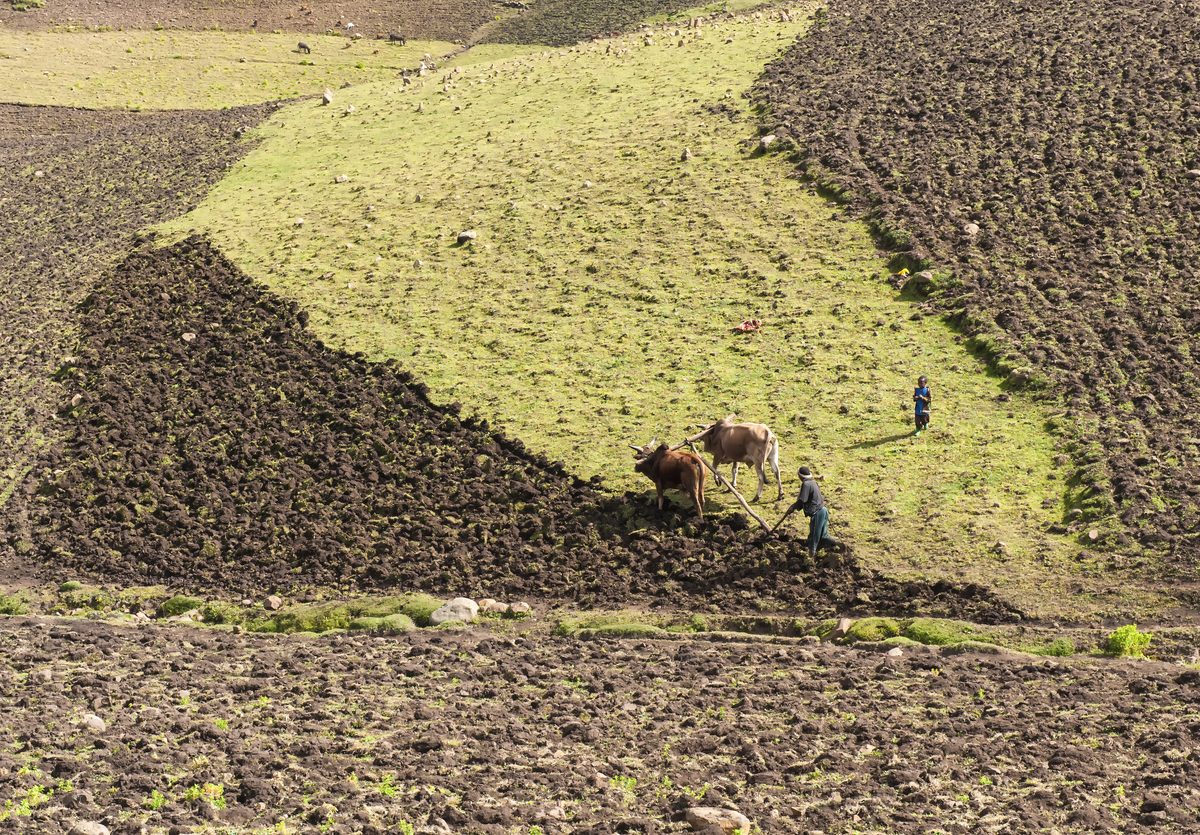
The Future of Food Systems: Spotlight on Ethiopia
When we discuss food systems, we are not just talking about farms; we are referring to the entire food supply chain. We are talking about how people eat, live, and navigate an increasingly volatile climate.
The upcoming 2025 UN Food Systems Stocktaking Moment (UNFSS+4) provides a global platform to take stock of this complexity, and Ethiopia’s role as host is significant, offering a concrete case study to assess progress not only in policy but also in the lived realities of farmers, students, researchers, and urban households. While Ethiopia’s experience is specific, the challenges and innovations it reveals are common across many low- and middle-income countries.
This blog post analyzes Ethiopia’s national food systems strategy as an example of where the UNFSS can go next in strengthening global food security.
What People Often Miss About Food Systems
Food systems are often misunderstood as being limited to agriculture alone. In truth, they touch nearly every aspect of life, including land use, climate resilience, nutrition, hunger reduction, and economic opportunity. At their core, food systems have the potential to end hunger not just in Ethiopia, but around the world. By strengthening how food is produced, processed, distributed, and consumed, global food systems can ensure that more people have consistent access to affordable, nutritious food.
Strong, inclusive systems can support smallholder farmers, improve distribution networks, and create safety nets that protect the most vulnerable from food insecurity.
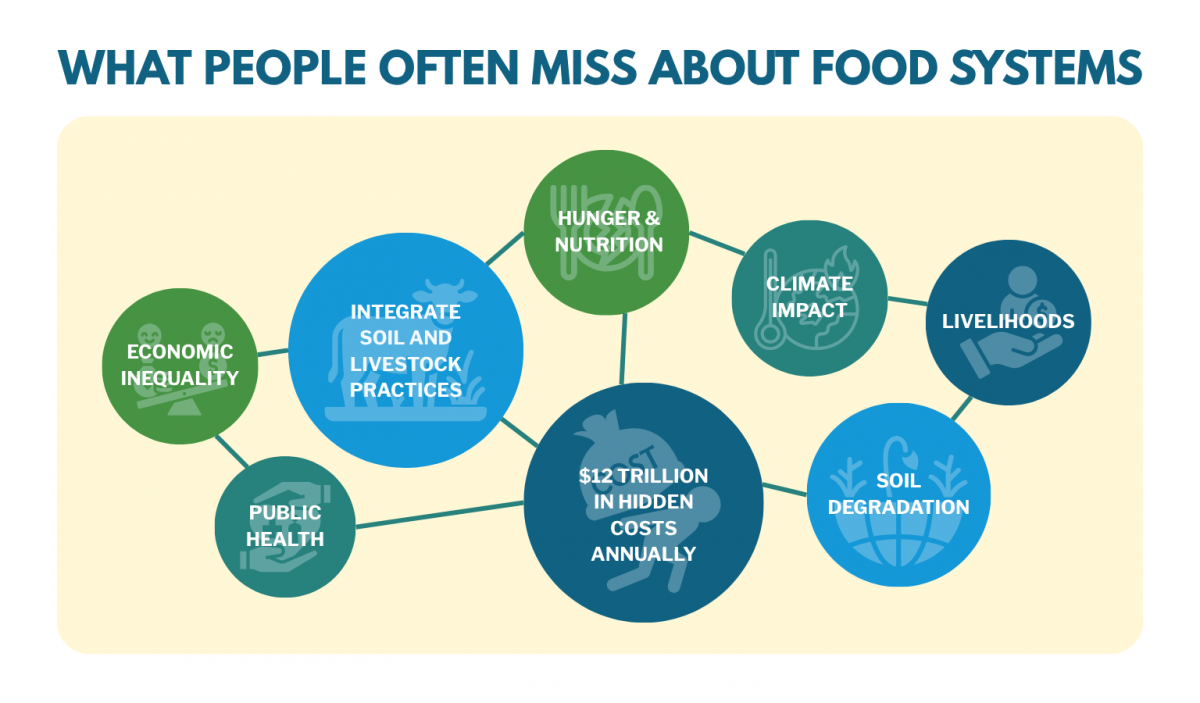
At the same time, food systems are contributing to rising rates of chronic disease and environmental degradation. These patterns not only strain ecosystems but also increase the burden on public health systems. Meanwhile, today’s food systems are estimated to generate over $12 trillion in hidden costs according to the Food and Agriculture Organization (FAO). Less than five percent of climate finance is directed toward fixing them.
Ethiopia: An Example of What’s Working So Far
Ethiopia presents encouraging examples of what’s possible. It has prioritized soil health through investments in soil mapping and regionally adapted fertilizer blending, as outlined in AGRA’s Ethiopia Strategic Plan (2023–2027), which supports national efforts to improve fertilizer quality and expand localized blending. Social safety nets, such as the Productive Safety Net Programme, also continue to play a critical role in protecting vulnerable households from food insecurity.
Progress in digital agriculture has also been notable. The country’s Digital Agriculture Roadmap outlines plans for interoperable systems linking farmer registries, market data, and advisory services. These goals align with regional aspirations for modern and inclusive agriculture. Youth engagement has also been meaningful. For instance, Ethiopia’s Green Legacy Initiative has mobilized millions of young people to plant trees and promote environmental stewardship nationwide. In schools, projects such as the Youth in Horticulture, an initiative by the Farm Secure Schools Africa, have combined hands-on gardening with nutrition education, encouraging students to participate directly in sustainable food systems.
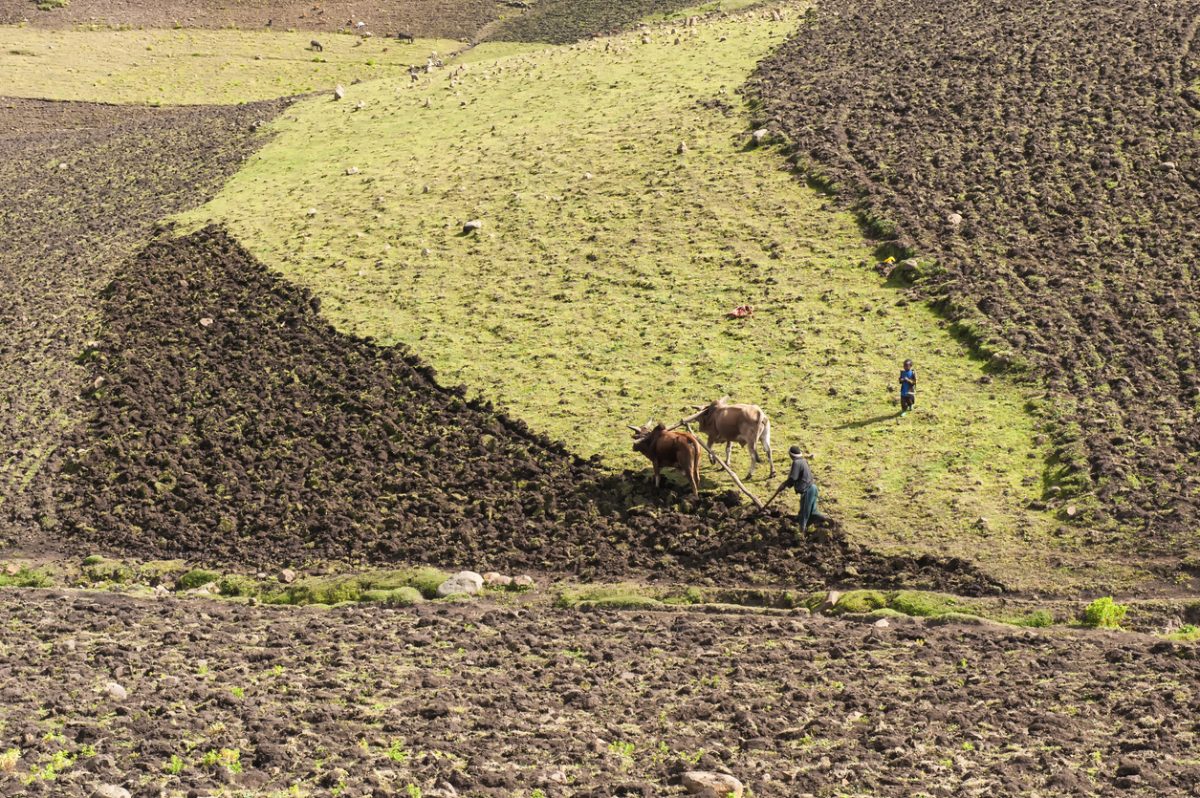
The Gaps We Can’t Ignore
Still, significant challenges remain. One is the disconnect between livestock farming and soil management. Ethiopia’s Livestock Information System Roadmap focuses on veterinary services and disease tracking but does not connect livestock practices, such as manure recycling, to soil health strategies. This siloed approach misses a key opportunity for integrated land management. Countries such as Senegal face similar challenges, where livestock and soil health are addressed in parallel rather than in a coordinated way.
Another concern is the lack of quality control for fertilizers. While local blending has expanded, there is no dedicated public budget for laboratory testing. As a result, quality oversight is left to market forces. Kenya also implements a fertilizer subsidy scheme, but its quality assurance system is undermined by limited laboratory capacity and insufficient regulatory enforcement.
Water insecurity also remains unaccounted for in Ethiopia’s food policy framework. Although crop yield data is available, there is limited information on post-harvest losses or household-level food stress. Tools such as the Household Water Insecurity Experiences (HWISE) scale, which measures personal experiences of water-related hardship, could be adapted for this purpose.
Ethiopia’s digital agriculture framework remains focused on national implementation and rollout. While it demonstrates strong internal coordination, it does not yet incorporate the African Union (AU)’s standards for data governance or commit to the continent-wide digital infrastructure promoted by the AU Digital Agriculture Strategy. This limits opportunities for collaboration across national borders. A similar pattern is observed in Vietnam, where promising digital tools have emerged but remain disconnected from regional strategies. These examples show that many of Ethiopia’s food system challenges mirror wider global patterns.
What Ethiopia’s Case Tells Us About What Needs to Happen Next
To move from commitments to fundamental transformation, clear and actionable steps are needed. One critical issue raised in Ethiopia’s food systems strategy is that key sectors such as soil health, livestock, and digital agriculture are advancing in parallel but not in coordination. For example, the Livestock Information System Roadmap and Integrated Soil Fertility Management Manual are each robust in their own right. However, they fail to link grazing practices and manure reuse to soil restoration goals. Bridging these silos is essential for building a truly integrated and sustainable food system.
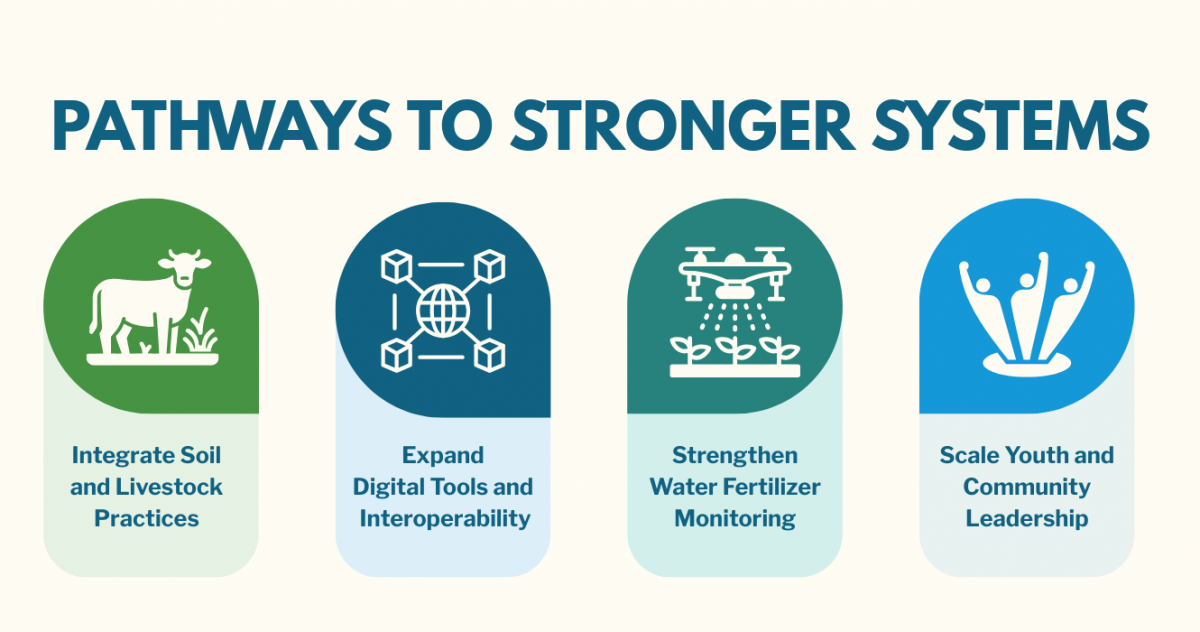
These priorities reflect a progression from integrated soil-livestock management toward broader systems coordination, with a growing focus on digital infrastructure, monitoring, and youth leadership.
Below are key recommendations for Ethiopia, as well as broader global priorities aligned with the UN Food Systems agenda.
For Ethiopia:
- Integrate livestock nutrient cycling into national soil management strategies, linking manure use and grazing to soil fertility.
- Establish public-private laboratories for fertilizer quality testing, supported through the Nairobi Declaration on Healthy Soils
- Align the Digital Agriculture Roadmap with interoperability and governance standards endorsed by the African Union.
- Enhance water measurement tools by incorporating community-based indices, such as the HWISE scale.
- Ensure that youth have permanent representation in food system governance structures.
- Streamline national indicators in the Comprehensive Africa Agriculture Development Programme (CAADP) reporting, with emphasis on: i)the share of land under sustainable management; ii)the adoption rate of digital agriculture tools; and iii) the uptake of climate-smart agricultural practices.
For the UN Food Systems Agenda:
- Scale support for blended finance models that link private investment to public agriculture priorities.
- Expand investment in localized, data-driven tools that empower smallholders and local governments.
- Encourage concrete commitments to enhance the integration of livestock, water, and soil strategies to enable ecosystem-based planning.
- Encourage UN member states to adopt shared digital infrastructure and data standards for better regional coordination.
- Highlight youth innovation hubs, school-based agriculture programs, and leadership pipelines that exemplify how the next generation can own food systems development globally.
This dual focus on national implementation and global coordination is critical for achieving real progress before the next review cycle.
The Moment is Now
As one of many countries navigating food system transitions, Ethiopia’s progress, while uneven, offers valuable insights for peers around the world. The challenges it faces are not unique. Countries from West Africa to Southeast Asia are grappling with how to turn national food systems commitments into integrated, accountable action. These shared struggles highlight the need for stronger coordination, more transparent monitoring, and greater alignment with regional frameworks. The UNFSS Stocktake moment is the perfect opportunity to double down on technical support and promotion of the integration of food systems that support everyone.

Beyond Kigali: Where Does Africa Go from Here with AI?
In April 2025, over 2000 people gathered in Kigali for the first Global AI summit in Africa to discuss AI’s potential to increase economic opportunities for African citizens. Across various discussions, one thing was clear – Africa’s AI potential is real. The summit promised to move from discussions into actions, concluding with a clear outcome document: the Africa Declaration on Artificial Intelligence. The declaration highlights the potential of AI and its dependence on the strength of data, infrastructure, governance, investments, human capacity, market, and international cooperation.

As governments, funders, entrepreneurs, and technology leaders rally around the AI moment and move towards actions, at Development Gateway, we are asking a different set of questions:
- Where is the data, and what is the quality of the data behind the algorithms?
- How will legacy government systems feed AI tools with fresh and usable data?
- Are Government ministries resourced to govern and trust the AI tools that they are being encouraged to adopt?
Our answer is grounded in our experience over two decades: AI will not be able to scale without foundational data and infrastructure. Our focus has been on the less glamorous and often overlooked layers that are needed for every AI breakthrough – data, infrastructure, governance, and capacity.
What is missing from AI?
Conversations following the summit seem to focus on research and innovations as reflected in upcoming discussions such as the World Summit AI in October 2025 and the Southern African Conference for Artificial Intelligence happening in December 2025 (to name a few of many upcoming AI gatherings). Underpinning these innovations, there is a need for data systems, well-structured quality data, trust and transparency within institutions, and local ownership and capacity to govern these features.
As highlighted in this blog on Artificial Intelligence for Public Good, when considering data for development, information about people is vital, particularly in the public sector. This includes the need for strong administrative systems that support service delivery and regular, representative national surveys & census efforts that ensure no one is left behind. Despite this, across many African countries, data ecosystems remain reliant on paper-based systems and face major structural challenges. These include limited capacity to use data in decision-making, underdeveloped administrative data systems, insufficient investment in statistical capacity, costly and complex ICT infrastructure, and donor dependence for data initiatives.
The Invisible Layer: Infrastructure and People
In our work, we have observed that across sectors, governments rely on donor-funded servers, outdated systems, and overstretched ICT teams, as highlighted in this recent blog by Development Gateway and partners. One example: in Ethiopia, we found that the Ministry of Agriculture had fewer than 10 full-time staff managing 33 digital systems. The Ministry acknowledged that this is not sustainable.
At DG, we’re working with governments to:
- Analyze cloud vs. on-premise hosting options when looking at infrastructure. As outlined in Chapter 4 of our report on Demystifying interoperability, cloud can offer you flexibility, but on-site servers can align better with local resourcing and available skills. We work closely with partners to weigh the trade-offs, and it’s not always a one-size-fits-all solution, as it depends on context. Good infrastructure isn’t just about the technology; it’s about trust, sustainability, and what works best for the people it is meant to serve.
- Create internal AI Code assist tools that help overburdened technical teams manage dozens of integrated systems more effectively. We use Code Assist internally at DG, and by developing a custom one that helps with key maintenance tasks, it could speed up the onboarding of new staff (permanent and embedded). We are currently collaborating with the Ministry of Agriculture in Ethiopia on this initiative.
- Strengthen data quality. This requires striking a fine balance between not standing in the way of AI development and reinforcing that data quality is not just needed but a necessity. For example, in our work with the Ministry of Health in Kenya, Ethiopia, South Africa, DRC, Zambia, and Nigeria on tobacco control data, we work with the governments to embed a rigorous validation and review process that involves thematic experts on specific topics and research advisory groups that include the National Bureau of Statistics.
- Understand how investments in interoperability can optimize the value of existing, siloed data, but can also leave difficult-to-fill gaps when data connected via API is taken offline. For instance, in the wake of lost USAID funding, data sources via API may not have backups.
While Governments are central stakeholders in AI governance, infrastructure must serve a broader ecosystem that includes academia, entrepreneurs/innovators, investors, the private sector, civil society organizations, and the communities they serve. All stakeholders need access to open, reliable, and affordable infrastructure that is also sustainable. Local stakeholders on the continent face significant challenges due to fragmented or donor-dependent systems.
The African Union AI strategy outlines principles to be adopted, such as diversity, inclusivity, and African culture and values. The Data Values Project by GPSDD echoes this need by emphasising that data, and by extension AI, must be anchored in equity, trust, and community voices. By prioritizing values and principles described in the strategy, such as Ubuntu (respecting collective community over individuality), countries can build AI infrastructure that supports innovation not only across sectors but that can also serve communities in an equitable manner.
The Road Ahead
The Kigali Summit confirmed that Africa’s AI trajectory is in motion. But critical questions remain:
- Which countries are investing in AI governance that reflects African values, equity, and local priorities? In particular, African countries must adopt a more nuanced and intentional approach to cultural preservation because the continent has a higher number of languages that aren’t already documented and used for existing algorithms.
- Who will fund the data infrastructure and capacity work that makes AI safe, scalable, and inclusive?
- How can practitioners plug into global and regional initiatives to bring a practitioner’s lens to AI’s foundational layer?
The AI summit raised important reflections, but now we need solutions and tangible actions. In June 2025, Development Gateway co-developed a session with partners on what it takes for philanthropy to build technology that is equitable at the 9th East Africa Philanthropy Conference. We hope to see philanthropy and other funders move beyond pilots and quick innovation wins to investing in systems that can make AI sustainable, not only in the region, but also, we hope to see a similar trend emerge out of global fora such as the World Summit on the Information Society +20.
Ultimately, while these questions we’re asking are oriented towards Africa and the continent’s development, they are global in nature. People-driven AI will need to reflect localized norms with sustainable funding and pathways for the practitioner’s lens, as part of regional initiatives in Asia, South America, and elsewhere.

Shared Struggles, Shared Solutions: Education and Cross-Sector Data Use Insights
“Education is the most powerful weapon which you can use to change the world.” ~ Nelson Mandela
Education has long been recognized as a crucial driver in creating a more sustainable and equitable world. However, to understand how education is being delivered, who it reaches, where, and how effectively, we must first have access to quality, reliable educational data.
Across many sectors, countries, and contexts, Development Gateway: An IREX Venture (DG) has seen first-hand what makes data, technology, and evidence effective. Through this process, we have learned best practices for advising governments, agencies, and organizations on how to take practical, action-oriented steps to collect, monitor, evaluate, and use data to achieve impact.
This blog draws on DG’s experience in climate, health, aid management, and agriculture to explore connections between the challenges of data collection, data hosting, and data governance across different sectors and what the solutions to overcoming them can teach us about strengthening education data systems.

Overview of the EDI Project
In our latest education project, the Elimu Data Initiative (EDI), we aim to understand the existing open- and closed-source educational information management systems that track education data.
In the first iteration of this project, Hewlett 1.0 (2022 – 2024), DG conducted desk reviews and a series of stakeholder assessments to understand the education data ecosystems in Kenya and Senegal, culminating in a comparative white paper. As we enter into the project’s second phase with EDI, our aim is to grow on the successes of Hewlett 1.0. The project also aims to:
- Assess and understand the existing landscape of digital systems being used for education data management through a paper comparing education management information systems;
- Contribute to thought leadership on digital tools for education through discussion of and engagement with our learnings from the paper; and
- Conduct stakeholder interviews with Nairobi County officials, who indicated a strong need for digital approaches in education.
As we’ve begun these project activities, we’ve encountered recurring challenges in data collection, data hosting, and data governance. Reflecting on these challenges across multiple sectors, ranging from health to agriculture, can lead to innovative solutions that improve outcomes for the education sector.
Data Challenges: Perspectives from Multiple Sectors
Challenge #1: Data Collection
A challenge we have repeatedly encountered in various sectors is the collection and collation of data. In our white paper on Education Data-Driven Decision Mapping, for instance, stakeholders cited challenges with collecting data on student performance and other data entries. Teachers are often asked to spend a significant amount of time entering data into multiple online systems. Due to the lack of data sharing between these systems, teachers often struggle to balance other teaching priorities while simultaneously completing numerous lengthy forms. This pattern is a recurring trend in the education sector we have witnessed in a number of countries, from Jordan to Kenya.
However, data collection challenges aren’t unique to the education sector and have been an issue in DG’s creation of digital solutions in other sectors, too. In our climate program, the Great Green Wall, for example, it was difficult to secure financial commitment data from countries. We addressed this challenge by manually aggregating individual survey responses in order to provide a first-level baseline. We also ensured that this data was shared publicly through the Great Green Wall Accelerator, preventing the challenge of multiple concurrent closed datasets.
In the health sector and our Tobacco Control Data Initiative (TCDI), the demand for up-to-date tobacco control research required us to implement new national-level data collection efforts, collecting and collating data ranging from vaping in South Africa to the behavioral reasons why Nigerians choose to start smoking shisha (also known as “hookah”).
Lessons Learned: Having a clear understanding of what data already exists, how readily available it is, where gaps remain, and the supply of and demand for new data enables us to design systems that are usable within present data constraints and scalable as additional data is collected.
Challenge #2: Data Hosting
Another common challenge relates to how and where the data collected are housed. In any program, a key decision must be made as to whether data solutions will be housed locally on servers within national borders or hosted on the cloud. There is no one-size-fits-all solution to this challenge, and what works for one context may not work for another.
In the EDI education project, we began understanding this nuance while seeking to understand education data flows in different country contexts. In Togo, data sovereignty – i.e., hosting the data locally – is considered a priority when it comes to their national data, including education statistics such as the number of students enrolled, the number of teachers per school, and so on. However, they were not able to host this education data locally within their existing infrastructure. As such, they decided to pursue a compromise.
Currently, Togo uses their own data collection tool, StatEduc, to collect school data at the national level. In order to use the analytics and reporting capabilities of the University of Oslo’s platform DHIS2 for Education, they then manually export the data outside of Togo to the DHIS2 team. The DHIS2 and Togolese officials then work together to review and validate the data before inputting the validated education data into the DHIS2 platform. Although this process is cumbersome, it has been functioning reasonably well. However, now that Togo has built a new data center, they are pursuing migrating the data to be hosted either physically or virtually through Togolese servers. Doing so will streamline the integration process of education data and ensure that education data remains compliant with Togo’s national data regulations, while also cutting down on current manual data validation procedures.
In another example from our work in the agriculture sector, DG’s ‘A Livestock Information Vision for Ethiopia’ (aLIVE) team worked closely with ministry officials in Ethiopia to determine whether hosting nationally or in the cloud would be a better fit for their needs. As noted in chapter 4 of our white paper ‘Demystifying Interoperability: Insights from our work in Ethiopia’s agriculture sector,’ the advantages of cloud computing, such as improved scalability, can be outweighed by the cons, such as increased cost over time. Similarly, national hosting solutions also raise certain challenges. Although the advantages include improved bandwidth and higher degrees of control and access to the data, these may be outweighed by the challenges of maintaining a local team to manage hardware and software infrastructure. In the end, after considering a wide range of factors, it was decided to host the livestock platform on local servers.
Lessons Learned: Recognizing that there is no one-size-fits-all approach to data hosting means each solution must be carefully considered and evaluated in accordance with existing data protection laws, technical staff availability, and budget constraints.
Challenge #3: Data Governance
Besides data collection and data hosting, a third major challenge we’ve seen during our work in the education sector is related to data governance. When talking with education experts from Kenya, Senegal, and Europe, we find that a common trend in the conversation is the underutilization of human resources dedicated to data processing and analysis, which inhibits data quality assurance and the effective use of data for decision-making.
Through our work in Hewlett 1.0, for example, we discovered that in one Kenyan county, there was only one data official working on data analysis for the entire county. These limitations in human resources exacerbate existing data quality and access challenges and can result in these challenges not being prioritized at a management level.
The lack of resources and the scarcity of officials dedicated to data governance is a challenge we have encountered in a wide variety of sectors, particularly those that deal directly with governance or public infrastructure. In the agricultural sector, for example, the aLIVE team faced data governance challenges related to understanding the existing data management practices prior to the program’s initiation. The team found that these data practices were often not documented and rather relied on the memory of staff members to inform others about them. Due to staff turnover and the volume of systems, each with its own governance standards, much of this information was either lost or convoluted in such a way that understanding the overarching data governance landscape was a significant challenge.
While it may be challenging to gain a full image of the data governance structures in place, it is still vital to understand as much as possible what already exists in terms of data management, practices, and processes. It’s extremely rare for there to be “zero” data governance and, as such, the best practice is to document all you can of this foundational knowledge and build from there. This documentation not only helps to alleviate duplication but also builds buy-in for new practices among local system owners.
Moreover, we have encountered this challenge in our work over the years, providing the United Nations Children’s Fund (UNICEF) with data strategy services, supporting the development of their global data governance strategy. As part of this long-term agreement, we have focused on what responsibilities data stewards should have and the functions they need to fill across UNICEF and the overall UN system. This process has highlighted the challenge of data governance in education and how building up the “data savvy” capacity in staffing functions across all levels of an organization can help to solve it.
Lessons Learned: The people, rules, and procedures that govern the use of data across systems must be reviewed as thoroughly as the technical requirements. By clearly documenting the current state of affairs, we can define the “unwritten” rules of data governance and streamline the integration of data into everyday decisions.
Charting a Path Forward in Digital Solutions
As we continue our work in health, agriculture, and education, we’ll continue to aggregate our lessons learned on data collection, data hosting, and data governance. Although there are common challenges across sectors, we see how a clear understanding of the data landscape, including what data governance practices and processes are in place, can inform the successful integration of new systems for many years to come.

Economic Toll of Tobacco-Related Diseases in Kenya: New Research Findings
Development Gateway: An IREX Venture (DG) is pleased to announce the publication of a research manuscript on the Economic Costs of Tobacco-Related Illnesses in Kenya. This research was carried out as part of the Tobacco Control Data Initiative (TCDI) activities in Kenya and is part of a broader report on Morbidity and Mortality from Tobacco Use in Kenya. Data from this research is available on the TCDI Kenya dashboard, which aims to supply decision-makers in government, members of civil society, and academia with improved access to country-specific data to better inform tobacco control policy.
Published in August 2024 in the Tobacco Use Insights journal, this is the third of three manuscripts that seek to break down the research report’s findings. The first, published in November 2023, explored the prevalence, patterns, and factors associated with tobacco use among patients with tobacco-related illnesses (TRIs), such as cancers, cardiovascular disease, chronic respiratory disease, and diabetes. The second, published in July 2024, focused on Mortality from Tobacco Use in Kenya. You can access its accompanying blog post here.
This blog highlights some key findings in the manuscript, based on the research carried out in Kenya from 2021-2022, estimating the direct, indirect, and ultimately economic costs of tobacco use for the period studied.

Why research on the economic burden of tobacco use in Kenya?
Indirect and direct medical costs of treating TRIs can place a significant economic burden on societies through healthcare and productivity losses. This is especially true for low- and middle-income countries (LMICs), which bear the brunt of the global tobacco crisis, accounting for a staggering 80% of tobacco-related deaths worldwide. As a result, assessing the economic impact of tobacco consumption in LMICs is crucial for shaping effective tobacco regulation and policy. However, this has been understudied in Africa, and the data that is available remains scant. In Kenya, estimating the economic costs of tobacco use is imperative to making informed, evidence-based policy decisions.
This manuscript not only reveals the direct financial burden of tobacco use but also offers a solid foundation for defining the necessary policy actions to address its harmful health and economic consequences. Additionally, it highlights the far-reaching effects of exposure to secondhand smoke for non-smokers, responsible for an estimated 1.3 million deaths annually worldwide. Barring effective tobacco control interventions, LMICs will be up against higher tobacco-related healthcare costs, placing even more strain on already overwhelmed healthcare systems.
Key Findings from the Research
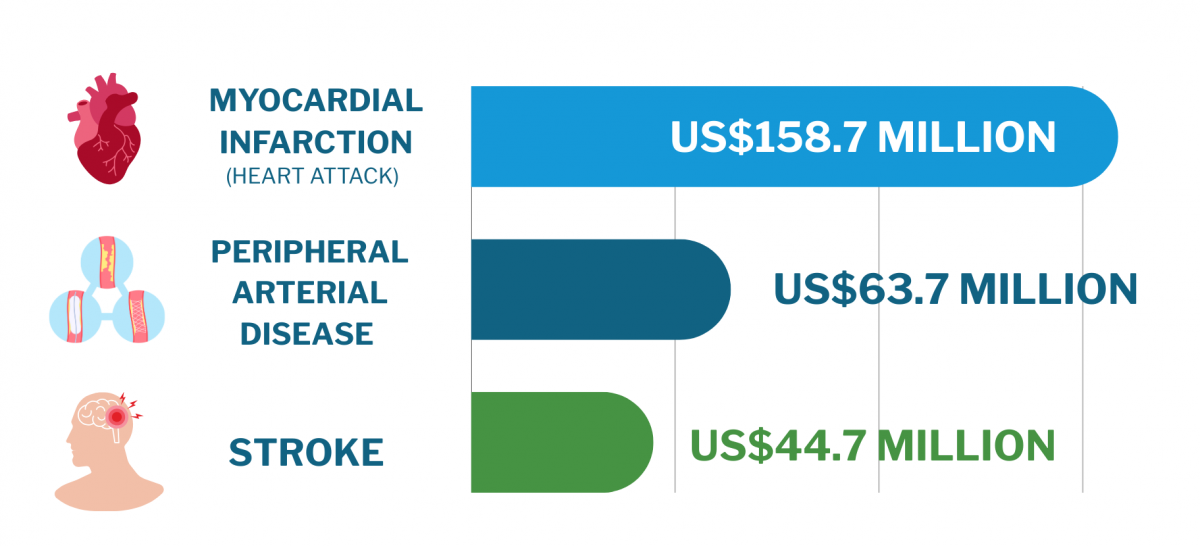
The estimated healthcare costs linked to tobacco use in Kenya are an alarming US$396.1 million (approximately 53.4 billion KES). Among the tobacco-related illnesses (TRIs) studied, myocardial infarction (heart attack) was the leading cost driver, accounting for US$158.7 million (approximately 21.42 billion KES). Following that, peripheral arterial disease and stroke each contributed US$63.7 million (approximately 8.74 billion KES) and US$44.7 million (approximately 6.02 billion KES) in healthcare expenses, respectively. A significant portion of these costs -over 90% – is driven by the expense of medications required to manage these conditions.
Regarding productivity losses due to tobacco-related illnesses, the costs range from US$148 (approximately 19,980 KES) per person to US$360 per person (approximately 48,600 KES), making up between 27% and 48% of the total economic burden. Productivity losses from the diseases ranged between US$148 (approximately KES 19,980) and US$360 (approximately KES 48,600), accounting for 27% to 48% of the economic costs.
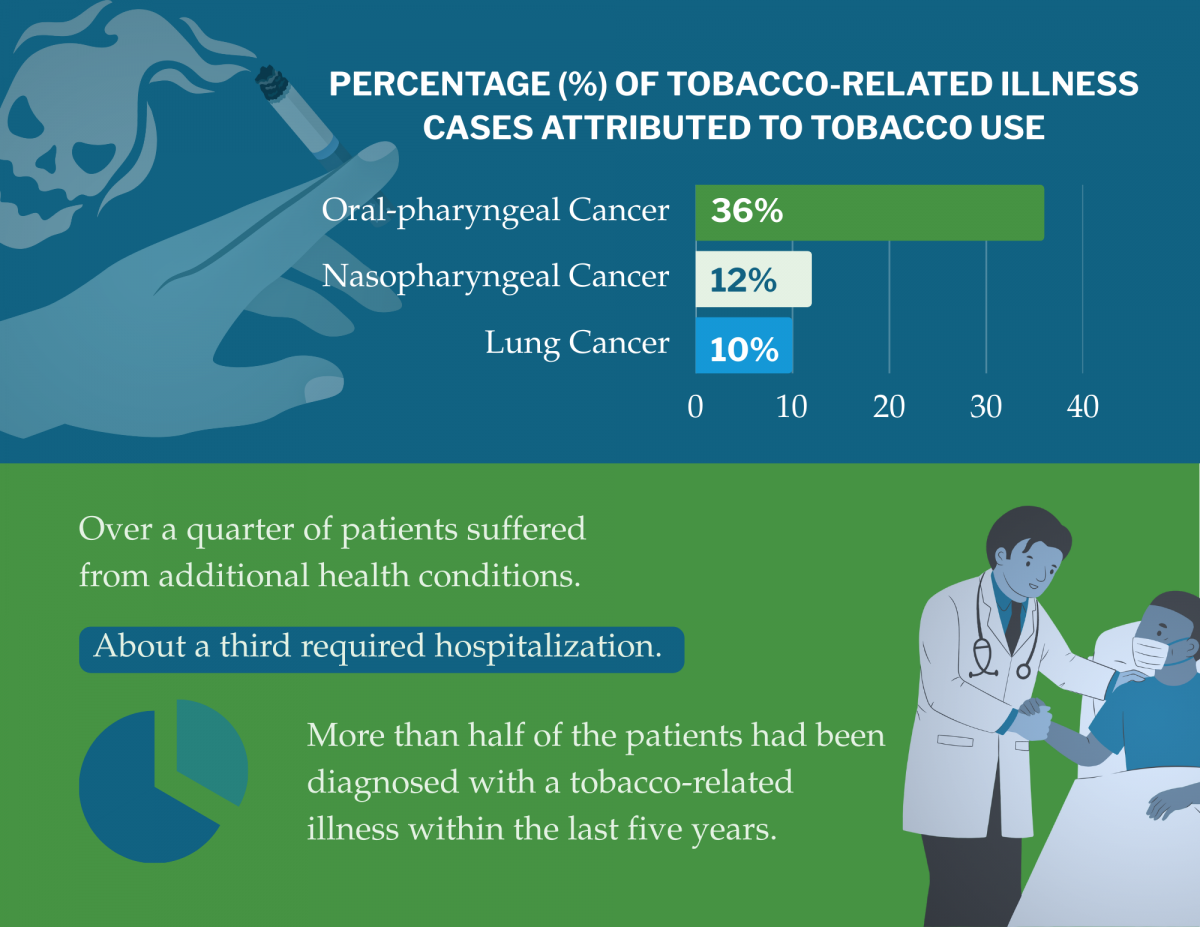
In terms of healthcare costs per case, lung cancer was the most expensive, costing US$23,365 (approximately KES 3,150,275) per case, followed by oral-pharyngeal cancer at US$7,637 (approximately KES 1,031,995), and laryngeal cancer at US$6,922 (approximately KES 933,470).
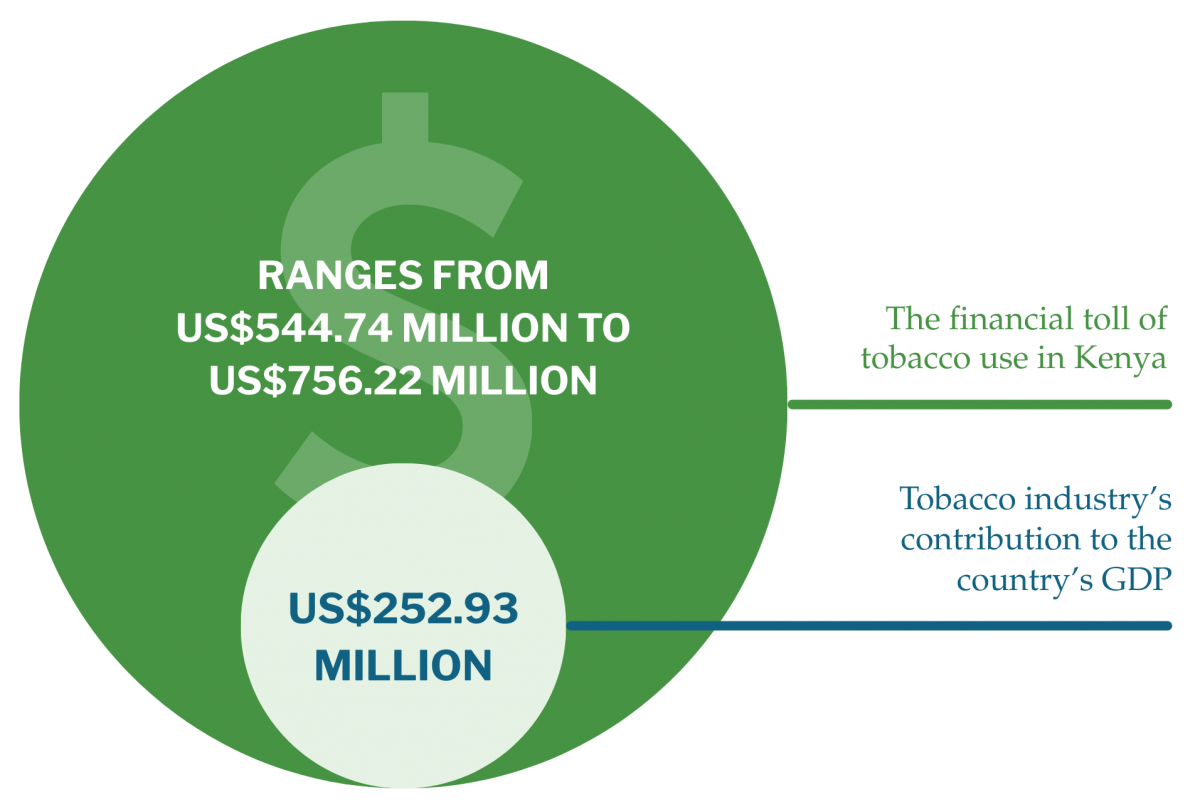
In 2022, the tobacco industry in Kenya generated $7.35 million in revenue, representing 7% of the country’s GDP of US$105 billion. However, the economic cost of tobacco use – just for the illnesses included in the study – accounts for more than 34% of this revenue. In other words, the financial toll of tobacco use in Kenya ranges from US$544.74 million (approximately KES 73.5 billion) to US$756.22 million (approximately KES 102.1 billion), while the tobacco industry’s contribution to the country’s GDP is much smaller at US$252.93 million (approximately KES 34.1 billion).
When comparing these figures, tobacco use results in a net loss to the economy of between US$291.8 million (approximately KES 39.4 billion) and US$503.3 million (approximately KES 67.9 billion) each year. This means that for every dollar the tobacco industry earns, the economy loses between KES 297 and KES 405 in healthcare costs and lost productivity, illustrating a poor return on investment.
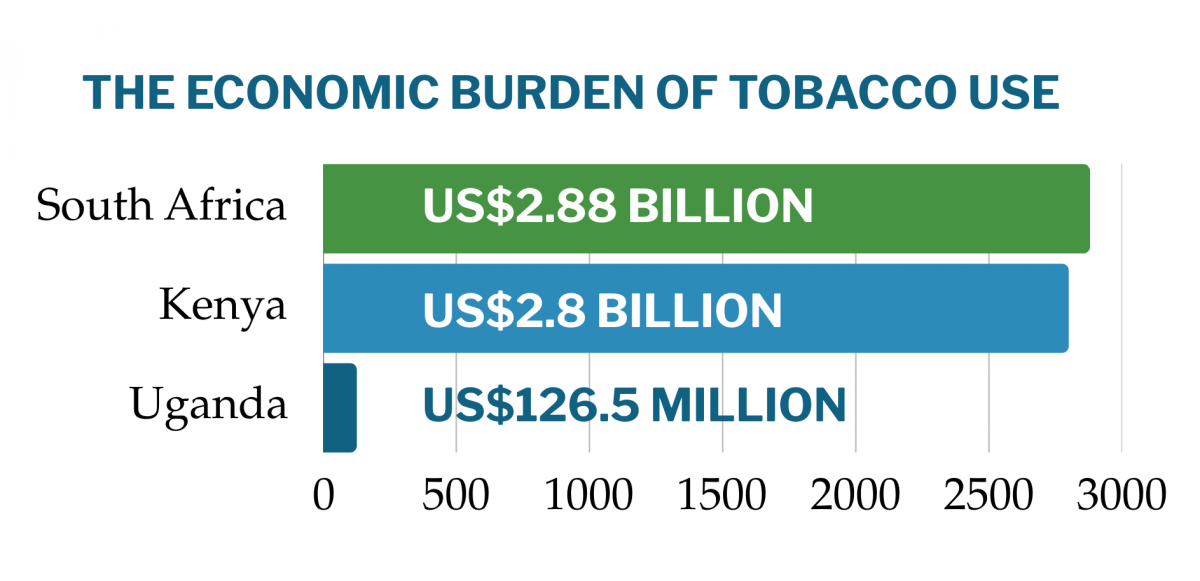
The analysis further shows that treating tobacco-related illnesses (TRIs) in Kenya is an enormous financial burden on the healthcare system, with total treatment costs estimated at US$2.8 billion (approximately KES 378 billion). Of this, US$396.1 million (approximately KES 53.4 billion) is attributed explicitly to tobacco use, accounting for 14% of the overall costs of managing these diseases. In terms of comparison, the economic burden of tobacco use in Kenya is somewhat less than in South Africa, where the cost is US$2.88 billion (approximately KES 388.8 billion), but more than in Uganda, where the cost is US$126.5 million (approximately KES 17.1 billion).
These differences can be attributed to varying smoking rates and the prevalence of tobacco-related illnesses in each country.
Implications for Policy
To address the economic and health impacts of tobacco use in Kenya, several key policy recommendations can be made:
- Strengthen Tobacco Control Laws: Implement comprehensive tobacco control legislation, enforce existing laws rigorously, and increase taxes on tobacco products to make them less affordable and accessible.
- Promote Cessation Programs: Advocate for the introduction of more support services for people trying to quit smoking, as well as monitor the tobacco industry’s activities to ensure they comply with existing regulations.
- Engage Stakeholders and Raise Awareness: Build stronger collaborations with relevant stakeholders, run public awareness campaigns to educate people about the dangers of tobacco use, and encourage policymakers to prioritize tobacco control on the national agenda.
- Capacity Building for Enforcement: Invest in strengthening enforcement mechanisms and provide training for healthcare professionals on effective tobacco cessation strategies.
- Leverage International Partnerships: Work with international organizations to tap into their expertise and resources, ensuring the successful implementation of tobacco control measures.
- Adopt Global Best Practices: Align local policies with global best practices and evidence-based strategies to enhance tobacco control efforts in Kenya.
- Use Research to Inform Policy: Use ongoing research and data to develop evidence-based policies supporting tobacco cessation and reducing tobacco-related harm.
By adopting these policy measures, Kenya can mitigate the significant economic burden of tobacco use and work towards better health outcomes for its population.
If you would like to learn more about TCDI and explore country-specific data, kindly visit www.tobaccocontroldata.org.

The Data Crisis Following USAID’s Withdrawal: Opportunities to Reimagine Data Systems
The immediate effects of cuts to USAID are becoming clearer, with the US largely absent from the international response to the Ebola outbreak in Uganda, the devastating earthquake in Myanmar, and the humanitarian crisis in Sudan. While the direct impacts of these cuts are making headlines, there is also a less visible, systemic consequence that could undermine development and humanitarian efforts long into the future: the destabilization of the data ecosystems that underpin global health, education, nutrition, agriculture, water, and sanitation services.
For decades, USAID and other US government funding have supported data used around the world. This includes routine survey data collection through programs like the Demographic and Health Survey (DHS), which operated in more than 90 countries to understand local and global trends, sophisticated satellite-based early warning systems for famine and disease outbreaks, and perhaps most critically, support to core administrative data systems used by government ministries to plan, budget, and target services. As country governments and their international development and philanthropic partners plan for a new development landscape, they will need to quickly identify and effectively fill these alarming gaps.
Beyond the immediate impacts of cuts on data for service delivery, budget planning, policymaking, and emergency surveillance, the abrupt termination of USAID funding is also putting at risk a promising trend toward the modernization of data systems as countries look ahead to digital transformation, digital public infrastructure, and AI readiness.
The twin crises of data and digital systems
Digital and AI technologies offer huge potential for increasing efficiency at a moment when country leaders must achieve more with fewer resources. The ability to better deliver public services through digital and AI technology depends on the successful collection, sharing, and management of data across and beyond government. Without investment in country data systems, there will be limited data to power AI solutions and drive the longer-term digital transformation of public services.
The immediate effects of the funding freeze (and subsequent terminations of programs) on the digital systems underpinning key service delivery are starkly demonstrated in Kenya. A March 28th, 2025 letter from civil society and community representatives to the Office of the Data Protection Commissioner (ODPC) states:
We…would like to draw the attention of the ODPC to reports that the funding freeze from the United States government has led to the inability by the Government of Kenya, specifically the Ministry of Health, to control, process and/or even access health data contained in the Kenya Electronic Medical Records (Kenya EMR). The Kenya EMR is an electronic medical record (EMR) system that has been used by the Ministry of Health to manage patient data in Kenyan public health facilities. We have multiple reports that public health facilities nationwide (where the systems are in use) have resorted to use manual registers.
Kenya’s EMR system went dark following the Stop Work Orders because, although the system is managed by the Kenyan government, it was physically hosted by a server operated by a USAID-funded implementing partner.
This presents a real risk to the progress made in the digital transformation of Kenya’s health care system, threatening the ability of healthcare workers to deliver life-saving care. Our partners have informally highlighted similar risks playing out in countries across the region, including agricultural data systems in Ethiopia, health systems in Ghana, and critical health commodity supply chain systems in Tanzania.
These twin crises – a halt to data collection and the undermining of digital systems – reveal existing inefficiencies and instabilities in how data is collected, managed, and shared both within and between countries. This moment also provides an opportunity to reimagine some long-standing problems in how governments and donors think about data and digital investments. There is a chance now to strengthen country ownership and investment in data systems, to reduce fragmentation, and to create more sustainable data systems. And as digital innovations like AI make data even more influential than before, it stands to transform public services and optimize – or even revolutionize – their delivery.
Reshaping digital and data policy for the long term
The seemingly quiet collapse of data systems is alarming and poses major short-term and longer-term challenges. It also reinforces the downsides to the previous donor-funded approach to data, which often led to fragmented sets of data systems, each for its own purpose. There has been insufficient attention to interoperability or an overall comprehensive and efficient architecture, and no clear sustainability model beyond additional donor-funded projects. As countries respond to the new development funding reality, we anticipate governments will be forced to adapt in ways that reshape digital policy, financing, and implementation. This adaptation offers the opportunity to reimagine data ecosystems that are owned by local actors, sustainably financed, and poised to unlock new opportunities for transformation:
- Now is the time to increase emphasis on data sovereignty, data localization, and data protection, including close attention to where systems are hosted and how their availability is funded and guaranteed. Decisions that lead to “good” digital public infrastructure that prioritizes “future-proofing” are notoriously difficult, as described in Chapter 4 of DG’s “Demystifying Interoperability” publication. However, these decisions, particularly in times of resource scarcity and crises, can be made by prioritizing political consensus around sustainable digital systems and “good” practices.
- Sustainable data systems will require more domestic resources and investment in data. The abrupt halt of USAID funding for data systems underscores that aid-funded models are not fully sustainable. But scarce domestic funding and other priorities have blocked the pathway to full country ownership. Initiatives like the UN/World Bank ‘Power of Data’ coalition are bringing together donors, multilaterals, and governments at the national level to strengthen political support, agree on priorities, and commit to funding data systems in line with national growth and development strategies.
- New investors and funders can maximize returns by funding systems and reducing fragmentation. The current crisis reveals how the fragmentation of data systems has weakened their resilience, as a lack of interoperability and failure to properly integrate digital and data systems have created missed chances to innovate and modernize. Funding that focuses on strengthening the whole system to support innovation can accelerate the adoption of new approaches and support private sector innovation.
The role of development partners
Beyond the immediate need for resources to support continuity of core systems like Kenya’s EMR, the fallout from the termination of USAID funding demonstrates the need for a new strategic approach to partnership. These partnerships need to be grounded in country ownership, in turn requiring governments to prioritize, resource, and maintain critical digital and data systems, and requiring development partners to ensure they align their contributions with these priorities.
Digital transformation frameworks and roadmaps used to guide donor investments must be pragmatic and focused on the implementation and integration of core digital and data systems, both new and legacy systems.
Philanthropic and development partners need to make a concerted effort to support the rapid creation of country digital and data strategies for transition to true local ownership that emphasize:
- Domestic resource mobilization
- Data governance and interoperability of core systems
- Technology strategies that streamline the plethora of existing digital and data systems to align with the national strategy
- System ownership, sustainability, and localization.
How these elements are implemented also requires intentionality. Data systems can and should be financed through diversified models that blend public, private, and philanthropic investments. Diversified funding mechanisms are possible, but the philanthropic and development community beyond the US Government needs to be strategic in their actions and partnership structures in how they act as a partner to support countries in making these transitions. Aid and philanthropy play an important role in de-risking investments in data, allowing for multiple building blocks of funding to deliver an intentional ecosystem approach to funding data systems.
With a country-owned strategy in place that strictly prioritizes the function, data sharing, and use of core systems, governments can direct traffic and create new funding models for data, as new partners can pay for aspects of the system that match their needs. We saw this take shape in our VIFAA program, where private sector stakeholders in Nigeria co-invested $120k to ensure state-disaggregated data on fertilizer availability and use. The private sector should not be expected to fund everything (and often cannot, due to antitrust laws), but it is an under-utilized source of both funding and innovation in government digital transformations.
The way forward
In the immediate term, supporting the critical services whose delivery was disrupted by the US withdrawal must be the development community’s priority. However, the medium- to long-term implications of data system failures extend beyond immediate disruptions; they threaten progress toward equitable, effective, data-driven delivery and readiness for future innovation.
As we assess what should be preserved in the wake of mass funding cuts, there is a clear role for pragmatic investments in digital public infrastructure built on core data systems, but this time with countries in the lead and stronger coordination and alignment among development partners.

Building a Sustainable Cashew Sector in West Africa Through Data and Collaboration
Africa is a leading producer of raw cashew nuts (RCNs), accounting for a significant portion of global production. In 2023, West Africa’s cashew harvest reached a record-breaking 3 million tons, marking a 15% increase from the previous year. Côte d’Ivoire stands out as the world’s top producer, with a crop of approximately 1.2 million metric tons. Other major producers in the region include Nigeria, Ghana, and Benin.

Cashew farming in West Africa is predominantly carried out by smallholder farmers, with over 2 million farmers contributing to more than 30% of the global supply. The profitability of cashew farming varies based on factors such as market information, yield, market access, and global prices.
As part of the United States Department of Agriculture (USDA)’s Food for Progress PRO-Cashew project for West Africa, Development Gateway: An IREX Venture (DG) collaborated with Cultivating New Frontiers in Agriculture (CNFA) to develop a data collection and analysis platform. This platform aims to enhance cashew productivity and competitiveness by supporting informed decision-making across the value chain in Côte d’Ivoire, Benin, Burkina Faso, Ghana, and Nigeria. Informed decision-making can help gain higher productivity through increased yields per hectare and reduced post-harvest losses, improve competitiveness through high-quality cashews meeting global standards, and help create more jobs.
The project came to an end in August 2024 after four years of working with government agencies, producers, traders, processors, and development partners in the five implementing countries to co-create an online tool aimed to inform, support, promote, and strengthen Africa’s cashew industry.
This blog outlines some of the key project highlights, including some of the challenges we faced, lessons learned, success stories, and identified opportunities for a more competitive cashew sector in West Africa.
Building the Cashew-IN Platform
PRO-Cashew aims to address the underlying issues of competitiveness in West Africa’s cashew sector, the inconsistent cooperation amongst regional policymakers, and the resulting trade impediments. The project identified, prioritized, and implemented strategic activities at different points of the cashew value chain to meet the unfulfilled needs of the target group beneficiaries more effectively. To incentivize, strengthen, and empower cashew value chain actors with actionable data, CNFA and DG designed a cashew data collection and analysis system (Cashew-IN) to expand and improve existing data-sharing systems focused on cashew production, trade, and processing levels.
Cashew-IN aims to make data easier to use for better decisions and improved outcomes in the cashew market. To support these objectives, DG used its Custom Assessment Landscape Methodology (CALM) to identify gaps in existing data collection, storage, and analytical tools in the cashew sector, as well as key decisions and target “use cases” for the future users of Cashew-IN. These learnings guided the design of Cashew-IN, a platform that addresses production, processing, and trade themes through a suite of visual tools configured to monitor and track associated indicators.
The Cashew-IN web application includes a user interface powered by WordPress, a user-friendly and intuitive software. It extracts its information from the embedded database configured to accommodate data starting from 2015 onwards. The data and information are entered by officially designated focal points by country. The Cashew-IN platform includes i) a regional dashboard managed by the International Cashew Council (CICC) and ii) country dashboards managed by an officially designated country administrator.
Sustainability Plan
As the Cashew-IN platform is regional in scope, DG has identified the International Cashew Advisory Council (CICC), an intergovernmental organization promoting cashew value chains, as a sustainability partner. The CICC comprises 11 countries, including the five Cashew-IN countries, and is decentralized at the level of each member country, with focal points per country from the cashew sector’s regulatory bodies or, failing that, the Ministry of Agriculture. CICC was selected to coordinate the operation of the Cashew-IN platform at regional and country levels through systematic and continuous data collection efforts leading to exhaustive and reliable data likely to inform decisions for a more competitive cashew sector.
To support ownership and sustainability at the country level, DG worked with national stakeholders from government institutions, producer associations, and the private sector to set up national committees responsible for managing their own version of the Cashew-IN platform in compliance with their laws and regulations governing data collection, ownership, and publication.

Lessons Learned & Stories of Change
First, the importance of data security and compliance with the countries’ data frameworks. One of the country’s Ministry of Agriculture was quite reluctant after the platform was first introduced, mainly because of data management and confidentiality concerns that emerged from a bad experience with a former partner. Understanding that Cashew-IN will be adapted to their national framework on data disclosure and that data will remain the property of the source helped alleviate their concerns and encouraged their involvement. The Ministry of Agriculture spontaneously joined the steering committee group.
Secondly, engaging and empowering national partners from the project assessment phase onwards – in line with the DG’s collaborative approach – facilitated the platform’s technical development and their buy-in and commitment. During the project’s closing workshop, one country’s representatives announced, as part of their ownership and sustainability strategies, the upcoming recruitment of an IT specialist who will be specifically dedicated to managing the Cashew-IN platform.
During the project’s closing workshop, one country’s representatives announced, as part of their ownership and sustainability strategies, the upcoming recruitment of an IT specialist who will be specifically dedicated to managing the Cashew-IN platform.
Finally, at the regional level, the CICC has taken ownership of the platform by providing two IT staff who have been trained to manage, update, and use the platform as well as adding new features. The Executive Director of the CICC also announced a plan to include other CICC member countries that are not involved in the Pro-Cashew-In programme and create a consultative committee made up of the three CICC technical committees (Production, Research, and Processing).
Appropriation and Capacity Building
DG conducted several sessions on platform use and management, data upload and configuration as well as maintenance of the platform. 56 country administrators and focal points of data-holding organizations from Benin, Burkina Faso, Nigeria, and the CICC have been trained to manage and use the Cashew-IN platform. 12 IT specialists from the same countries have also been trained to get familiar with the technologies used in the Cashew-IN platform, enabling them to support its development at the end of the project implementation. Following the technical training, the source code was shared with the IT specialists for exploration and modification.

Recommendations
To ensure greater ownership and sustainability of the platform and a significant impact on stakeholders (decision makers, producers, traders, processors, and academics), we recommend the following actions :
- Institutionalization of the platform with a view to systematizing data collection and updating the platform;
- Use of the platform as a reference for decisions taken in the cashew nut sector at both political and private sector levels;
- Involvement of trained stakeholders (IT specialists and focal points) in the maintenance and ongoing technical development of the platform;
- The gradual integration of other CICC member countries into the platform for better regional coverage.
What Comes Next
A few cashew-producing countries that were not included in the Pro-Cashew project expressed interest in joining the initiative (Mali, Senegal, Cameroon, Togo, etc.), an idea also supported by CICC, which expressed its interest in including other cashew-producing countries in the region.
From the program, we confirmed the necessity for DG to work closely with its partners to deliver outcomes that are both useful and meaningful. This project also revealed the importance of local capacity-building to manage the tool even after the project came to an end in August 2024.
Developing a digital solution can be a challenge, but including the beneficiaries from the onset and working closely with them throughout the project implementation has proven to be efficient as well as rewarding for the DG team.