Decision Space and Development Cooperation
This post builds upon a DG contribution to the 2017 OECD Development Cooperation Report, launched on October 17, 2017.
All too often, discussions about managing for results in development fail to specify who is managing, what decisions they are authorized to make, or what results data are being used. Identifying the who and whats is critical, as this decision space informs what types of tools, processes, and information are needed by decision-makers to serve the why: achieving better outcomes.
Through our Results Data Initiative , we observe that decision makers have varying needs and authority at different levels of government. Decisions made at the highest levels (e.g., President’s Office or Central Ministries), have wide, diffuse, and often unanticipated effects across the national system. Decisions made at more local levels (e.g., village health clinic or agriculture field office) are more constrained, but have a more direct impact on the quality of service delivery.
For example, the Ministry of Health or Finance may determine the budget allocation for supplies at the district level, where district executives make subsequent allocations to village clinics. This allocation determination may be based upon historical allocation data and available budget. In turn, decisions made by clinic directors about which medicines to purchase in what quantities may be based upon prevalence, incidence, or some other data type — but will be bounded by funds and guidance allocated at higher levels. Ultimately, the clinic’s decision about which medicines to stock, shaped by Ministerial allocations, will determine whether the clinic is able to treat all patients that present with a specific disease.
This systems approach to decision space can be summarized in the graphic below.
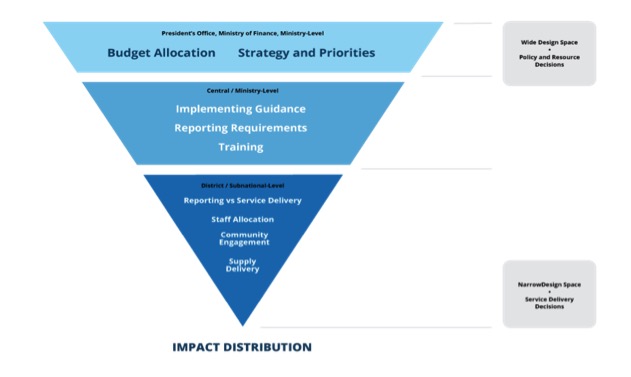
This model accounts for decision-making whos within the government space, and provides basic examples of whats vis-a-vis authorized decisions; it also implies that what results data are required may also be distinct at each level.
Decision Space in Practice
To further explore the what of results data, as part of the new OECD Development Cooperation Report (page 100) we provide a concrete example of how decision-makers at different levels (international, national, local) require different data flows to pursue one goal: reducing maternal mortality.
At the global level, decision-makers — representatives from development agencies and recipient countries’ central governments — tend to evaluate progress trends by theme, in order to direct resource allocation. For this purpose, Sustainable Development Goal (SDG) indicator data may be one of the most important results data types. SDG indicators can be used at an aggregate level to measure country, regional, and global progress and enable cross-country comparisons.
For example, SDG Target 3.1 (“By 2030, reduce the global maternal mortality ratio to less than 70 per 100,000 live births”) is informed by SDG Indicator 3.1.1 (“Maternal Mortality Ratio”). Indicator 3.1.1 can be used to measure progress between countries, and identify states where progress is lagging behind.
At the country level, decision-makers primarily focus on assessing ministerial, sectoral, or national progress against priorities set by the government. As such, the most important indicators within the national monitoring and evaluation framework are those that measure progress against the national development plan. These may overlap with the SDGs, or may be distinct. These data are used annually in the national planning and policy-making processes, and (to some extent) quarterly by line ministries. Providers can also use these data to align their aid to the development needs of their partners.
The Tanzania Five Year Development Plan (2016/17-2020/21) includes a target maternal mortality rate, and uses the indicator “Maternal Mortality Rate per 100,000” to measure annual progress.
At the community or sub-national level, data on service delivery, inputs, and disaggregated outcomes are most important. This information is used to monitor service delivery and facility reporting; plan capacity building programmes; support supervision visits; and evaluate staff performance. These data are used weekly, monthly, quarterly, and annually in support of planning and service delivery objectives; they may also be used by providers to monitor the outcomes of projects. In countries where there is a high level of decentralisation, these data also contribute to district budget and planning processes.
Tanzanian District Medical Officers use reports from the reproductive, maternal, neonatal, adolescent and child health programmes to monitor service delivery related to maternal health in their district’s facilities. The District Council Health Management team also uses annual and monthly programme reports to plan the district health budget and allocation activities.
So, what does this mean for achieving better development outcomes? When seeking to realize a development why, we must be more specific about the who and the whats — development actors are not monoliths, so one size of tools, processes, and information won’t fit all. To move from reporting on results to managing for them, we need to better understand the context within which these results can make a difference.
Share This Post
Related from our library

Harnessing the Power of Data: Tackling Tobacco Industry Influence in Africa
Reliable, accessible data is essential for effective tobacco control, enabling policymakers to implement stronger, evidence-based responses to evolving industry tactics and public health challenges. This blog explores how Tobacco Industry strategies hinder effective Tobacco control in Africa, and highlights how stakeholders are harnessing TCDI Data to counter industry interference.

Building a Sustainable Cashew Sector in West Africa Through Data and Collaboration
Cashew-IN project came to an end in August 2024 after four years of working with government agencies, producers, traders, processors, and development partners in the five implementing countries to co-create an online tool aimed to inform, support, promote, and strengthen Africa’s cashew industry. This blog outlines some of the key project highlights, including some of the challenges we faced, lessons learned, success stories, and identified opportunities for a more competitive cashew sector in West Africa.

Digital Transformation for Public Value: Development Gateway’s Insights from Agriculture & Open Contracting
In today’s fast-evolving world, governments and public organizations are under more pressure than ever before to deliver efficient, transparent services that align with public expectations. In this blog, we delve into the key concepts behind digital transformation and how it can enhance public value by promoting transparency, informing policy, and supporting evidence-based decision-making.