Define, Co-Design, and Repeat: Putting Usability Testing to the Test in Tanzania
Last month, the Results Data Initiative (RDI) convened its second cross-ministry co-design workshop — surfacing new opportunities for the Government of Tanzania to put health data to use at the local level.
This two-day workshop re-convened stakeholders from across ministries and local governments, building on the priorities they identified in the first workshop back in June. The aim remained the same: address the data use gap at the local level by presenting relevant health data to facilities and communities. During this second workshop, participants worked through how to best visualize these information needs.
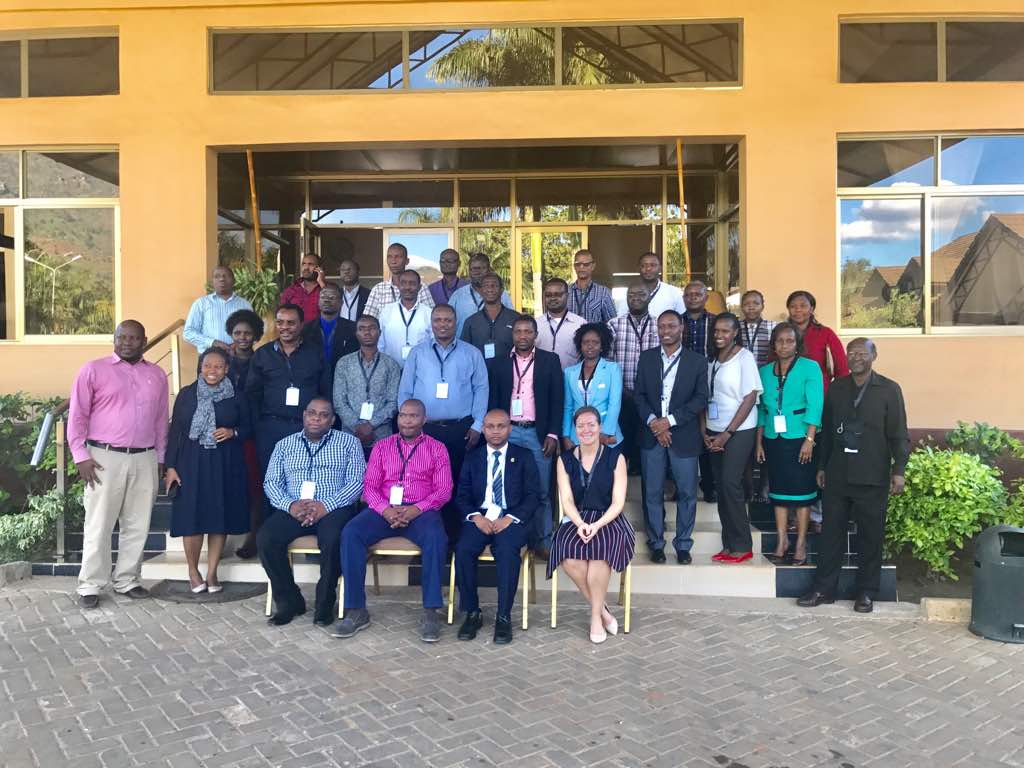
Figure 1: Kathryn with workshop participants
Following problem identification at the June workshop, we designed an initial series of simple, paper-based reports that visualize priority information needs on prevalent diseases, human resource shortages, and common causes of death. These reports aim to help facility and community-level planners better understand the data they collect, allowing them to respond to critical health issues. The primary goal of this second workshop was to present these report designs to the participants for feedback. After doing so, we would agree on priority design changes and make plans to test the next iteration of report designs on local officials in the field.
Staying true to our PDIA approach, we came away from the workshop with important lessons to carry us forward in the co-design process:
- Two tools are not always better than one. We left the first workshop with two tools, and two use cases, in mind. However, the second workshop revealed that participants want greater flexibility to use tools across target audiences and decisions, so we’re adapting our approach. Rather than developing two separate tools for facility and community-level planners, we’ll develop a single tool that can support multiple use cases. It will generate tailored reports for different user groups, which can be printed monthly, quarterly, or annually, as well as accessed as needed through a web-based dashboard or mobile app. Based on their planning processes and information needs, participants ultimately identified seven target audiences for the tool, distributed across three different levels of users:
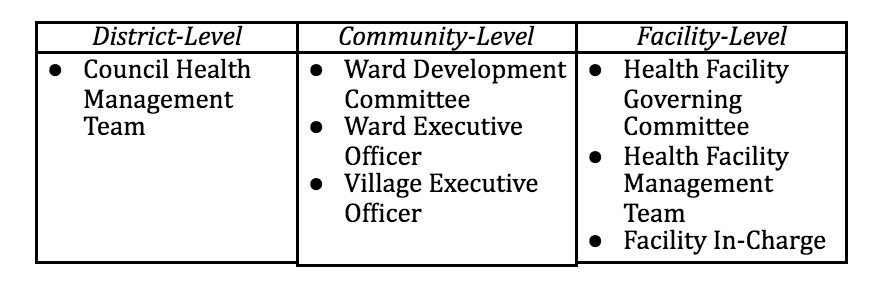
-
Testing and iteration is critical to the co-design process. We know that we don’t want to create “just another data tool” that will die off after a few years of lackluster use. But by iterating our working designs based on real user feedback before beginning technical development, we can ensure that the tool is developed around the actual needs of target user groups. These needs include consideration of their analytical capacity, IT constraints, and specific monitoring or planning decisions made in their work. Participants in our workshops underwent the first round of user testing themselves — and will be able to see how their feedback directly informed the next iteration of designs. We believe that investing this time upfront is crucial, and will pay off substantially in terms of building buy-in for — and sustained use of — a truly co-designed tool.
This month, we’ll be conducting usability testing on each of these seven target user groups, across three different regions in Tanzania. Stay tuned and check back for updates on how the report designs evolve into final UI requirements, as well as our plans for working with PORALG to begin technical development of the tool.
This was the second of a series of quarterly co-design workshops chaired by the President’s Office-Regional Administration and Local Government (PORALG), facilitated by DataVision International and Development Gateway, and supported by the Bill & Melinda Gates Foundation.
Share This Post
Related from our library

Introducing The HackCorruption Civic Tech Tools Repository
Introducing the Civic Tech Tools Repository: an open-source hub of digital solutions to fight corruption. Designed for growth through GitHub contributions, it brings together tools, code, and resources across six key areas for HackCorruption teams and beyond.

Harnessing the Power of Data: Tackling Tobacco Industry Influence in Africa
Reliable, accessible data is essential for effective tobacco control, enabling policymakers to implement stronger, evidence-based responses to evolving industry tactics and public health challenges. This blog explores how Tobacco Industry strategies hinder effective Tobacco control in Africa, and highlights how stakeholders are harnessing TCDI Data to counter industry interference.

Building a Sustainable Cashew Sector in West Africa Through Data and Collaboration
Cashew-IN project came to an end in August 2024 after four years of working with government agencies, producers, traders, processors, and development partners in the five implementing countries to co-create an online tool aimed to inform, support, promote, and strengthen Africa’s cashew industry. This blog outlines some of the key project highlights, including some of the challenges we faced, lessons learned, success stories, and identified opportunities for a more competitive cashew sector in West Africa.