Harnessing the Data Revolution
What will it take to transform data and technology into improved development outcomes?
The development community is abuzz with renewed energy and optimism following the call for a ‘data revolution’ by the UN High-Level Panel on the Post-2015 Development Agenda. The contours of this revolution are generally agreed upon – more accessible and usable data for policymakers and citizens – but the road ahead is uncertain. It is crucial that we flesh out how data can better inform decisions, empower citizens and drive new insights. As former World Bank Vice President Jean-Michel Severino and Olivier Ray from the French Development Agency highlighted in their seminal work on the tectonic shifts under way in development, “the triple revolution of objectives, players and instruments is reshuffling the cards, dynamiting old practices and habits”.
Tackling climate change, violent conflict, food insecurity, international terrorism and other complex global challenges requires a high degree of coordination and complementary across the maze of actors in development. We need high-quality, timely, relevant and disaggregated data to achieve real progress in these efforts. Even more important, we need to streamline these data into the decision-making processes of governments and donors.
Who’s doing what, where?
Too many decisions about where to allocate aid are made with incomplete information about the needs and opportunities for impact on the ground. A minister of education looking to make targeted investments in new teachers, supplies or upgraded classrooms needs to know what other investments are already being made, by whom and where. Before we can measure results from the complex web of development actors and projects, we must first ask a more basic question: Who’s spending on which projects and where on the ground?
Most studies assessing the distribution of aid and its impact on development outcomes use countries as the unit of analysis. Local-level data were once costly and difficult to capture systematically, and national-level data enabled donors to do reliable cross-country analyses.
Unfortunately, this country-by-country analysis has not provided the insights that governments, donors and civil society groups need when making tough decisions about where to allocate scarce development funds. Moreover, these national-level data do little to inform or engage citizens who are primarily interested in the development activities taking place in the urban and rural areas where they live.
Over the past few years, advances in data collection like geocoding – pinpointing the precise geographic coordinates of development activities – help make development more tangible by illustrating who’s doing what, where and to what effect in a given community.
“[Geocoding] makes the distribution of aid visible by using maps and it can help decision-makers and other development stakeholders to support areas of the country where there is less official development assistance,” according to one official from the Ministry of Finance in Tanzania.
Layering spatial data on the locations of aid projects within a country with information on local socio-economic indicators enables scholars, planners and citizens to ask the questions that are most important to them, such as “Why is climate change funding allocated to Province X, when Province Y is the more vulnerable one?” and “Why are the largest donors supporting health clinics in the communities where health outcomes are already better?”
Maps rarely provide simple answers to complex questions, but they do often help governments, donors and citizens to ask the right questions. Maps also provide a departure point for deeper exploration and analysis. Shedding light on donor and government activities in a particular region of a country opens up new opportunities for coordination across development actors – for example, from a donor supporting community health workers to a minister of health seeking to understand which communities are underserved by health professionals. Citizens and communities can also use local, more granular, data on development investments and results to hold governments and funders to account. Such data vailability, combined with the spread of mobile technology, could – with the proper approaches and incentives – allow citizens to provide direct feedback to improve policies and service delivery and help foster true citizen engagement.
Putting data to use
But data is no panacea. It’s easy to get swept up in the hype around the ‘liberation’ of donor and government information fueled by the open data movement, but ensuring that these data are used by citizens, policymakers and funders is easier said than done. Several basic conditions need to be in place to ensure that data are actually put to good use.
First, data at the project- and activity-level must be publicly accessible in a format that people can understand, use and compare. The majority of Organisation for Economic Co-operation and Development (OECD) donors have begun publishing to the International Aid Transparency Initiative (IATI) registry, which provides for a common reporting standard across agencies. That said, the pace and quality of the reporting remain a work in progress, often preventing the data from being usable to greatest effect.
Second, donors and governments must systematically tag projects and activities with geographic information and make these data public. At AidData, we work with governments around the world to generate geospatial data and convert it into insights. In Nepal, for instance, the Ministry of Finance had implemented the Aid Management Platform in partnership with Development Gateway to track aid projects reported by over 40 donors, but recognized that more granular information was needed to better target domestic and external resources.
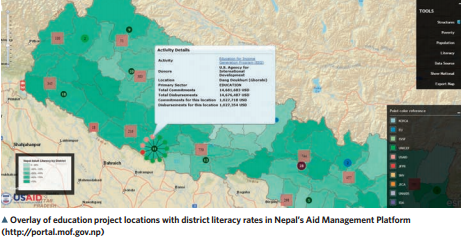
In collaboration with USAID’s Higher Education Solutions Network and Nepal Mission, AidData and Ministry staff collected location information on over 21,000 project sites, representing $6 billion in donor commitments. The Ministry pledged to make and keep the data open to enable broad access by a host of users. Madhu Kumar Marasini, International Economic Cooperation and Coordination Division Chief and Joint Finance Secretary, remarked that “this openness will not only strengthen accountability in foreign aid mobilization, but also provide additional opportunities to make aid more effective”.
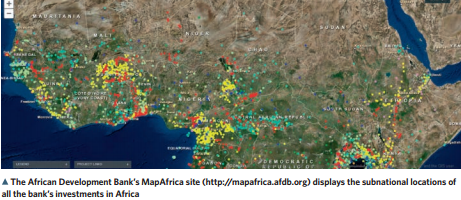
At the same time, donors like the African Development Bank (AfDB) and the Asian Development Bank have embedded geo-coding into their internal processes and are now publishing this geocoded data to IATI.
Third, citizens, public officials and scholars must have mapping tools to visualize and make sense of the data. In Nepal, AidData and Esri, a company that supplies geographic information system software, integrated a mapping feature into the existing government Aid Management Platform, enabling a broad user base to explore the data.
Appealing to a global audience, AidData launched the AidData.org platform to lower the barriers to data exploration with easy-to-use tools to explore research questions, create maps and visualizations, and share creations and insights. Flashy tools and technology bring data to life, but building the capacity for more people to make meaning from it, from the civil society group in a remote village to a policy-maker in the capital city of a developing country, is critical and often overlooked.
As such, sparking uptake and sustained use of data is the final frontier of the data revolution. From Open Data Bootcamps hosted by the World Bank, to hackathons in tech hubs around the world, there is a growing focus on building data literacy. Infomediaries and data journalists have the potential to reach more people by transforming raw data into stories, visualizations and analysis.
One innovative model that holds promise is Code4Kenya, which embeds tech-savvy fellows and developers in media and civil society organisations, with promising early wins, like the ‘Find My School’ application for comparing primary school performance. We need to seed more creative, grassroots approaches like Code4Kenya to make data relevant and useful to local organisations and citizens.
Spurring and sustaining demand for broad data use will not be an easy process. Citizens and communities need to experience first-hand how data can help them engage in dialogue about priorities and further their own development agendas. If information is to be relevant it needs to be closer to the lives, needs and aspirations of citizens. This is where more granular, local information is a foundational piece to the success of the data revolution.
As donors and governments invest heavily in the ‘supply side’ by opening up and creating vast stores of new data, devoting equal attention to kindling sustained demand and capacity for use of these data will be crucial.
Nancy McGuire Choi is Development Gateway’s Senior Director of Operations, and a Co-Executive Director of AidData.
This article was first published in UNA-UK’s Global Development Goals: Partnerships for Progress.
Share This Post
Related from our library

Harnessing the Power of Data: Tackling Tobacco Industry Influence in Africa
Reliable, accessible data is essential for effective tobacco control, enabling policymakers to implement stronger, evidence-based responses to evolving industry tactics and public health challenges. This blog explores how Tobacco Industry strategies hinder effective Tobacco control in Africa, and highlights how stakeholders are harnessing TCDI Data to counter industry interference.

Building a Sustainable Cashew Sector in West Africa Through Data and Collaboration
Cashew-IN project came to an end in August 2024 after four years of working with government agencies, producers, traders, processors, and development partners in the five implementing countries to co-create an online tool aimed to inform, support, promote, and strengthen Africa’s cashew industry. This blog outlines some of the key project highlights, including some of the challenges we faced, lessons learned, success stories, and identified opportunities for a more competitive cashew sector in West Africa.
Digital Transformation for Public Value: Development Gateway’s Insights from Agriculture & Open Contracting
In today’s fast-evolving world, governments and public organizations are under more pressure than ever before to deliver efficient, transparent services that align with public expectations. In this blog, we delve into the key concepts behind digital transformation and how it can enhance public value by promoting transparency, informing policy, and supporting evidence-based decision-making.