How open data supports Big Results Now in Tanzania
We’re in the midst of a “data revolution” for development — both with our collective focus toward achieving the Sustainable Development Goals, and the expansion of demand and tools for using data sourced from public, private, and citizen-generated spheres.
Against this backdrop, the Government of Tanzania committed to opening up priority sectoral data as part of their Open Government Partnership commitments and in line with the Big Results Now (BRN) agenda.
DG’s task, with support from the World Bank, was to develop three sector-specific open data dashboards: one each for the Education, Water and Health sectors. These dashboards are meant to collect, synthesize, and visualize data to help users (including the government itself) analyze and surface narratives; support decision-making and reporting; and provide feedback for improving the quality of data through interactive mechanisms. This effort falls under the Tanzania Open Data Initiative (TODI).
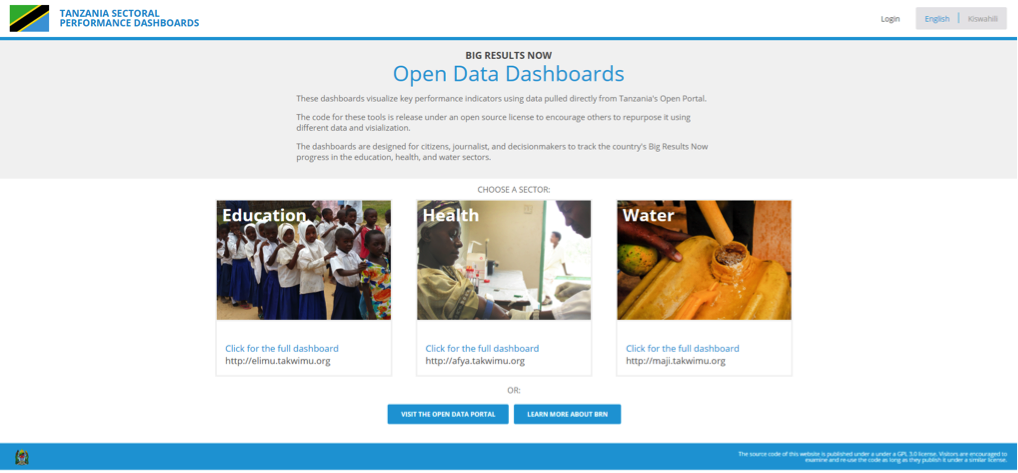
Figure 1: Tanzania Sectoral Dashboards
As an organization with extensive experience developing technology platforms and data visualizations, we know that different audiences understand, and interact with, data differently. More to the point: It is easier for people to look at numbers, charts, or maps than use such data to move business or government forward.
With this in mind, our goal was to develop a system that would help users move from analyzing to applying data. Specifically, we designed the user interface with specific audiences and “use cases” in mind. In the Education Dashboard, for example, we tried to make it easier for:
- parents to look up a school by name and view its performance record over time;
- journalists to access benchmarking tables with best/worst performing schools, districts, and regions;
- lawmakers to view, share, or export the geographic coordinates of schools with fellow officials, or include in a presentation;
- anyone to report missing data or incorrect data sets.
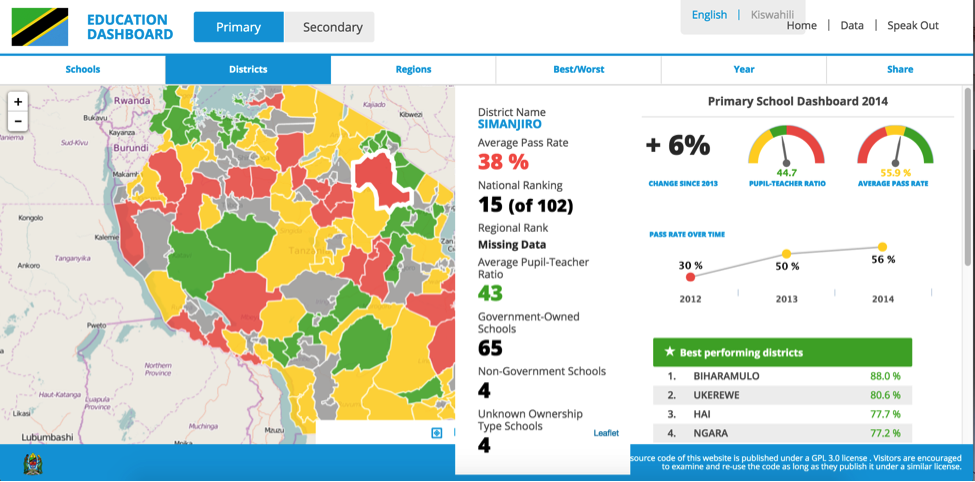
Figure 2: Tanzania Education Dashboard
By opening up datasets and making them interactive, tools such as these dashboards can prompt user questions such as Why are the schools neighboring my child’s school performing better? or How many waterpoints are functional in the Ward where I live? By unearthing these questions — and with an environment that encourages civil discourse and debate — dashboards can also be a starting point for dialogue around challenges facing these critical sectors.
More importantly, these dashboards can be a resource for the Government of Tanzania to lead a national discussion around how challenges facing the nation can be overcome.
In our next post, we will go behind-the-scenes of the Tanzania Dashboards, exploring the technology and data driving the visual resources — stay tuned!
Share This Post
Related from our library

Introducing The HackCorruption Civic Tech Tools Repository
Introducing the Civic Tech Tools Repository: an open-source hub of digital solutions to fight corruption. Designed for growth through GitHub contributions, it brings together tools, code, and resources across six key areas for HackCorruption teams and beyond.

Beyond Kigali: Where Does Africa Go from Here with AI?
As the AI momentum builds, Development Gateway is asking different questions: where the data comes from, how reliable it is, how legacy systems will supply usable data, and whether governments have the capacity to govern and trust the AI tools they’re being urged to adopt.

Building a Sustainable Cashew Sector in West Africa Through Data and Collaboration
Cashew-IN project came to an end in August 2024 after four years of working with government agencies, producers, traders, processors, and development partners in the five implementing countries to co-create an online tool aimed to inform, support, promote, and strengthen Africa’s cashew industry. This blog outlines some of the key project highlights, including some of the challenges we faced, lessons learned, success stories, and identified opportunities for a more competitive cashew sector in West Africa.