How to Find, Analyze, and Apply Aid Data
The global community, as represented at the Open Government Partnership (OGP) Summit and beyond, has made strides toward producing a variety of open data, including open aid data. Aid transparency was among the first open data ‘pushes’ in the global development space – leading to a wide range of government, civil society, and donor-sponsored portals. As the open data movement has expanded to include budgetary, contracting, and other sources of information, we felt it was fitting to reflect about how to access and understand where to locate and how to interact with aid data resources.
Opening up aid data requires both political and technical support. The Open Aid Partnership has been working to ensure that open aid commitments are included in country National Action Plans, and the Government of Liberia has included two such commitments in their second action plan. On the technical side, initiatives such as the International Aid Transparency Initiative are working to make these data portals more interoperable and useful, whether for interaction with national budget or other datasets.
So how can we leverage these portals for better analysis and decision making? One of the first steps is understanding how these resources can complement, enrich, and sometimes correct each other.
Let’s take the example of government-validated data from Malawi’s Aid Management Platform (AMP), and donor-reported data from the IATI datastore. Both are included in this Excel download, if you’d like to follow along (note: some data processing, including currency standardization and XML to Excel conversion, has already been performed on the datasets).
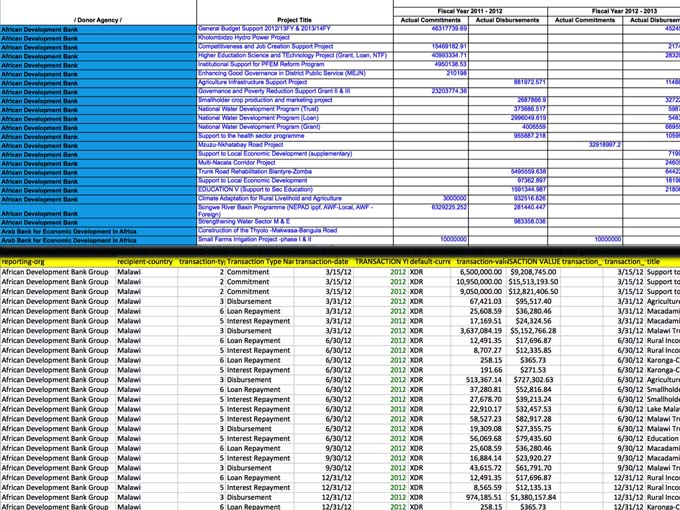
Figure 1: Examples of data about African Development Bank (AfDB) activities in Malawi from Malawi’s AMP (top) and the IATI Datastore (bottom).
As you can see, AMP (total commitments and disbursements by year) and IATI (transactions) data here are represented a bit differently — this pre-processing was done to save time, as our data exercise focuses on comparing annual figures by funder.
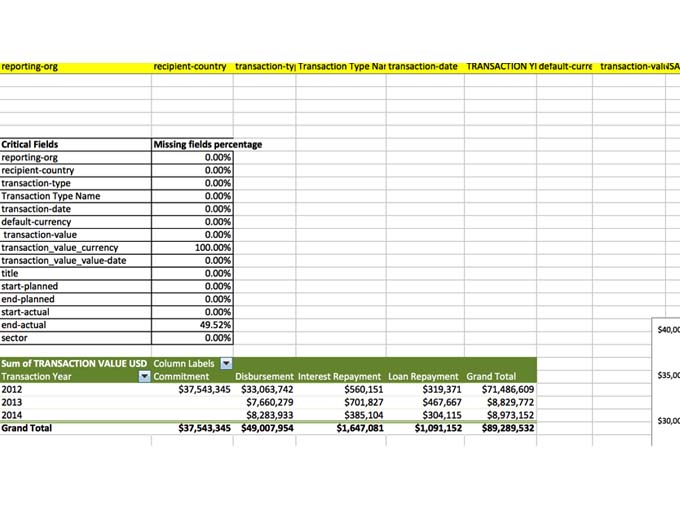
Figure 2: Analysis of key field completeness.
Over DG’s years of partnership with country government aid data users, we have identified several common key fields critical for ministries of finance and planning. The good news is, for the sub-set of IATI publishers included in this dataset, almost all of those key fields are populated — meaning that IATI data gaps don’t necessarily preclude its inclusion for a more complete picture of aid flows in country, where more funding is available through IATI than AMP.
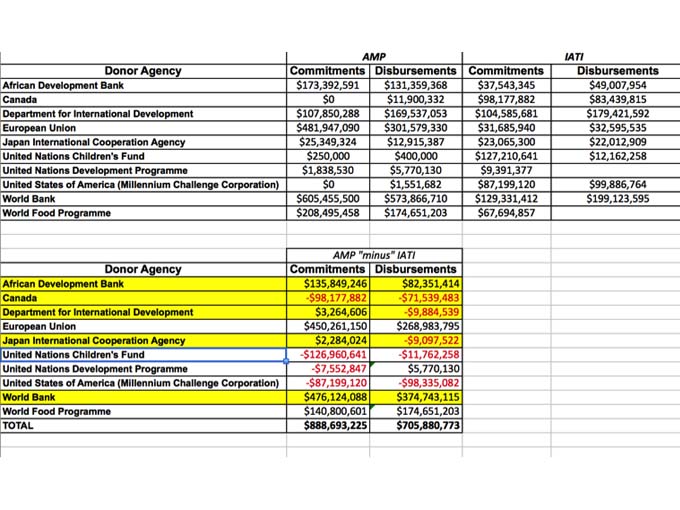
Figure 3: Comparison of AMP and IATI data for selected funders.
In the case of Malawi, not all funding data match well between the IATI and AMP sets; in fact, when we run a comparison between commitment and disbursement numbers, we can find significant differences in reported figures. Some of these discrepancies relate to the timeliness issues highlighted before; other times, differences can be traced to how headquarters may classify funds (i.e., by including overhead or administrative expenses) versus how country offices report funds (i.e., actual amount disbursed in country); based on DG experience, completeness of AMP reporting also tends to correlate with whether or not the donor has official representation in-country. This means that, on the basis of the figures above, IATI data would be a boon to government and development partner users to provide more information about activities by, for example, Canada and UNICEF.
This AMP-IATI exercise aimed to simply scratch the surface of how we as the open data community can interact with aid data. However, better understanding the resources available – as well as the benefits, pitfalls, and nuances of each – can help us improve the way in which open aid data is collected, compared, and ultimately used to make development finance more efficient and effective.
This post is based on Development Gateway’s OGP Summit 2015 workshop session on “How to Find, Analyze, and Apply Aid Data”.
Share This Post
Related from our library

A Year After USAID: Reclaiming Control of Data Systems
Just months after the 2025 U.S. aid freeze was announced, we published a blog post warning that the USAID cuts would result in a data crisis, with some countries losing access to their digital health data. This blog explores how those systems – and the countries relying on them – have fared nearly a year on.

Introducing The HackCorruption Civic Tech Tools Repository
Introducing the Civic Tech Tools Repository: an open-source hub of digital solutions to fight corruption. Designed for growth through GitHub contributions, it brings together tools, code, and resources across six key areas for HackCorruption teams and beyond.

Building a Sustainable Cashew Sector in West Africa Through Data and Collaboration
Cashew-IN project came to an end in August 2024 after four years of working with government agencies, producers, traders, processors, and development partners in the five implementing countries to co-create an online tool aimed to inform, support, promote, and strengthen Africa’s cashew industry. This blog outlines some of the key project highlights, including some of the challenges we faced, lessons learned, success stories, and identified opportunities for a more competitive cashew sector in West Africa.