IATI Data for the Future: Success, Progress, and Challenges
Last week, we shared experiences from the process of conducting Data Use Pilots along with our partners, Publish What You Fund. Today, we’re sharing further takeaways from using the International Aid Transparency Initiative (IATI) in conducting the Pilots, with a focus on results and issues we encountered throughout the process.
Our last post discussed that IATI contains project information on who is doing what, and where. It provides enough information to make a limited — but fairly detailed — landscape analysis of a given sector and country. Aside from attaining a rough sense of who is working in the sector and where; donors can glean what activities are planned; which objectives and outcomes are targeted; which implementing partners are involved; project budgets and disbursements; and sometimes even results.
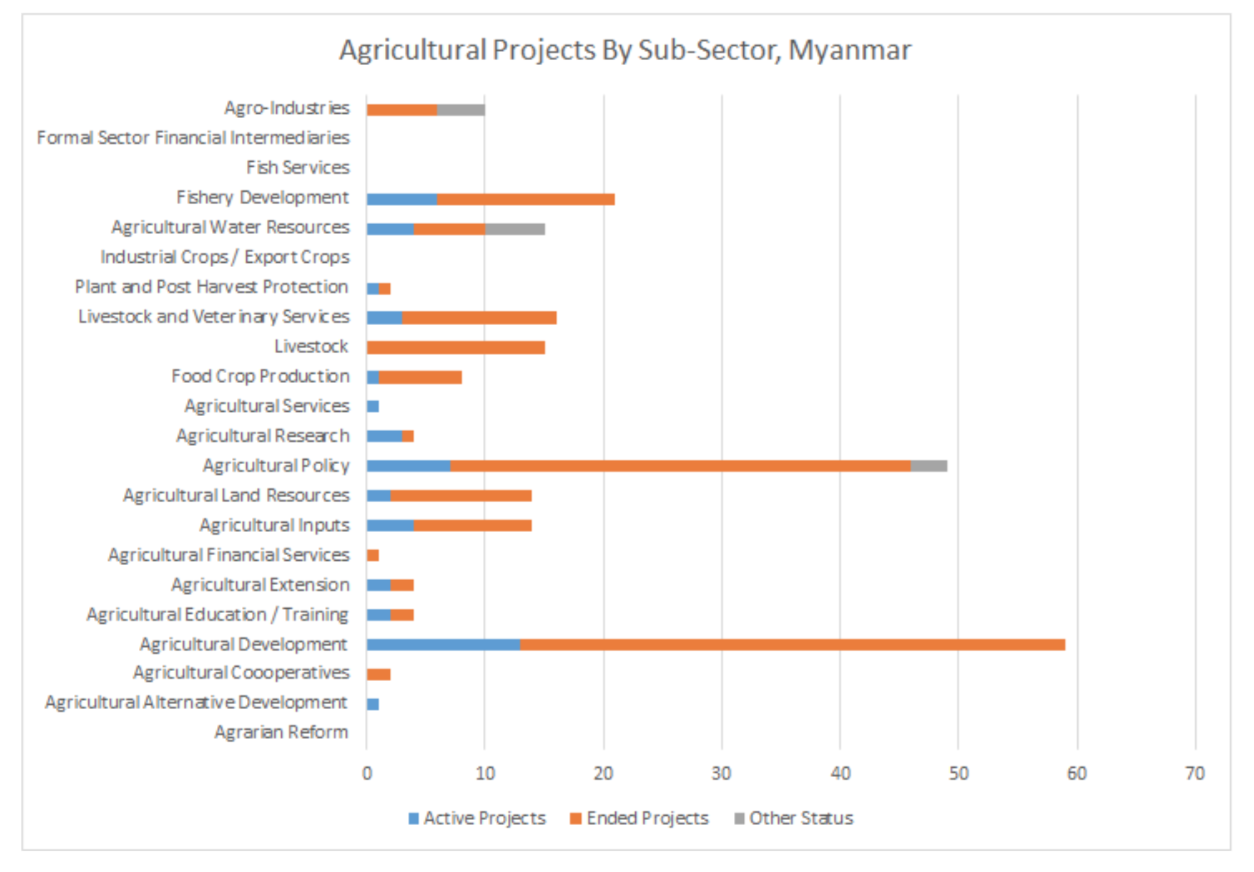
Figure 1: Bar chart of the 206 Agricultural projects on IATI in Myanmar, of which 37 are listed as Active
However, there are definite challenges to using IATI data. A few areas in which we encountered challenges in implementing this work include:
Project descriptions: Most publishers provide project descriptions on IATI. But these descriptions, while typically outlining project goals, rarely included the project approach. This made it difficult to truly understand how the projects differed from one another.
Links: Some publishers include links to relevant project documents — which can be treasure troves of useful and detailed information, but they are time consuming to review.
Locations: In the USAID pilot, only about 36% of projects identified for the landscape analyses included location data. In the DFID pilot, far fewer had identified locations and many of those that did were either central coordinates or the country capital.
Results: While most do not publish results data to IATI, a handful of organizations consistently do (for example, the World Bank). However, some results do not have enough context to clearly explain what is being measured.
A notable example we found was “Honey – Baseline: 103, Target: 104.” Here, it is not clear what is being measured, and what the goal is. In addition, the standard does not currently allow for qualitative results data, but some publishers entered this type of information anyway. IATI could add a place and standard for adding qualitative data, so that it can be clearly delineated and analyzed separately from quantitative data.
Financials: While capturing financial transactions can be useful, it can also make project entries quite complex. For projects with many recorded disbursements, repayments, and commitments, figuring out the total project budget can be challenging. Different publishers also report their project financials differently: some report a long list of financial transactions, others report only commitments and disbursements, and some only report a yearly budget. This makes it difficult to compare financials across projects.
A “Non Standardised Standard”: Each donor publishes according to their own definition of what should be on IATI. For example, we found that some donors were only publishing ODA, while others were sharing their entire foreign assistance portfolio. This makes the data confusing to use and prevents using aggregated financial figures. IATI could better define what should and should not be shared using the Standard.
Outdated information: Currently, IATI does not specify when information was published, and project statuses are not always up-to-date. Providing actual start and end dates may be useful in understanding a project’s status.
DAC Codes: While useful, top level sector codes are typically used instead of more specific ones, making it difficult to filter for more specific sub-sectors.
Time Consuming to Use: The data analysis for each FTF country took about 8 days of reviewing the data and answering questions. This was partly due to difficulties in getting to and analyzing IATI data. Few project teams have so much time to run such an analysis, and even fewer will have the drive to understand IATI well enough to do so.
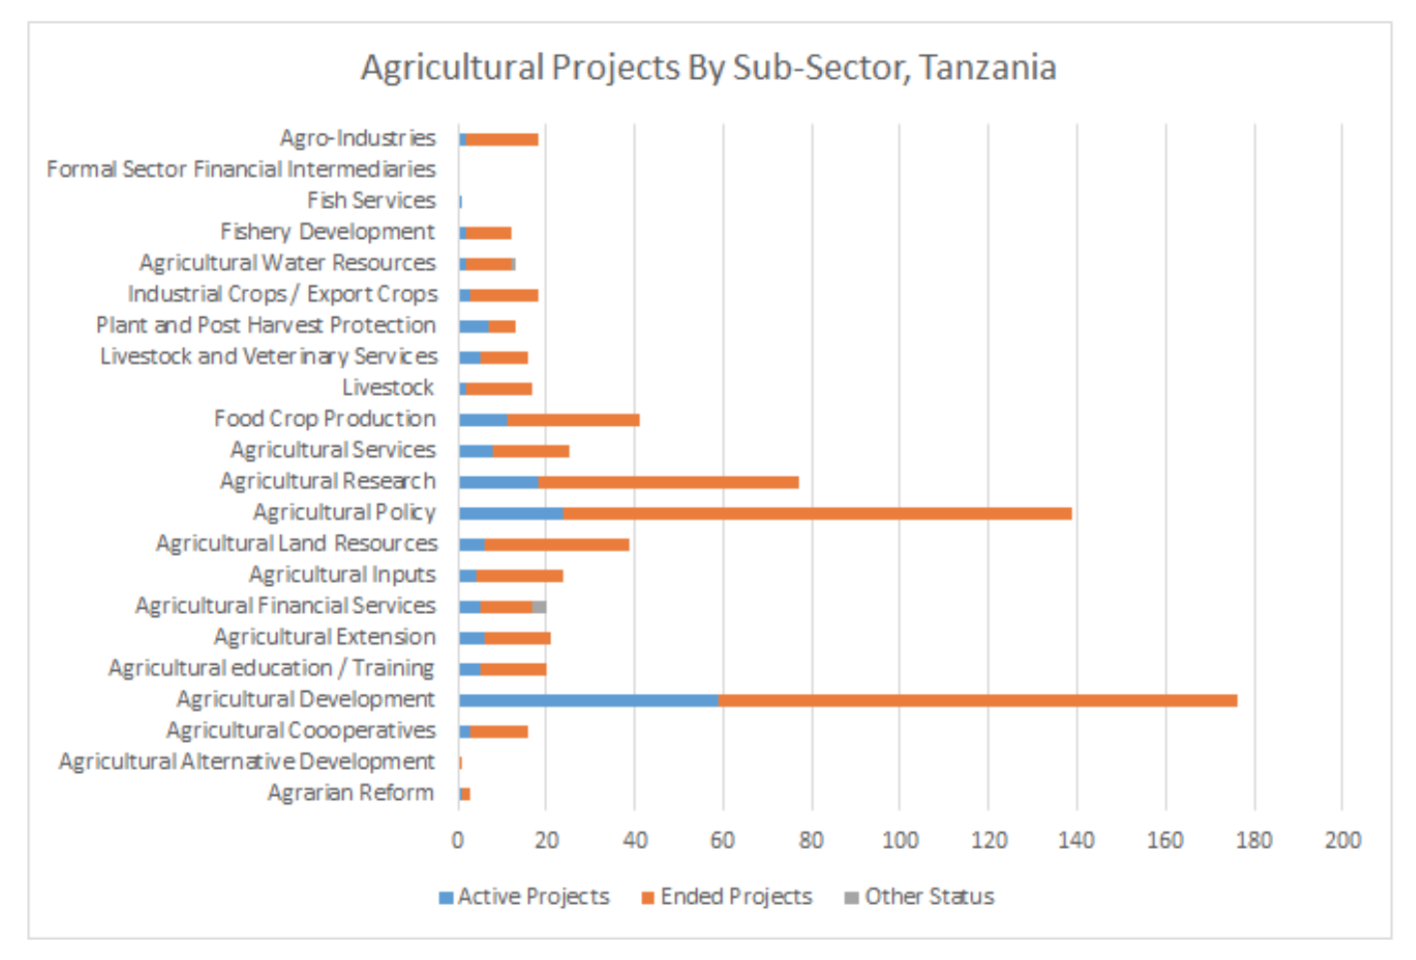
Figure 2: Bar chart of the 776 Agricultural projects on IATI, of which 180 are listed as Active
USAID and DFID Takeaways
Overall, the reports were helpful for mission planning. Most notably, the Senegal USAID mission was able to use the report while deciding where they should scale back to make sure there was good coverage between themselves and partners. They also found opportunities to partner based on geographic overlap, sequencing, and complementarity. The reports will also be used for briefing an incoming foreign service officer.
When asked how the data compared to what information they already had on the ground, USAID estimated that for Senegal, they already had about 50% of the information. The additional information and the addition of geo coordinates, plus having it all gathered in a written-down, central location, are what made the reports truly helpful.
USAID headquarters staff also shared that our IATI analysis uncovered information not captured in USAID internal systems: namely, sub-national location data and information on project targets. One example was information on who was working on fisheries in Senegal — USAID’s internal data had not been able to identify this.
Some USAID staff had hoped for more results information, which is currently quite limited in IATI. They also noted that host government information would be incredibly helpful in supporting coordination between USAID and the government, and between USAID and other donors. While including host government information is not one of IATI’s current goals, it could be something to consider as reporting to IATI improves.
As for DFID, the team team we worked with was extremely positive about how this data could improve coordination between donors. They reported that the information helped them to understand what was happening in each country, which would ultimately feed into their decisions of countries on which to focus on.
However, the data was not detailed enough to help DFID plan the specifics of their work — which had originally sparked their interest in the pilot. We aimed to feed into discussions on which specific crop-types would be of particular value in each country. However, while we found that IATI data does contain unstructured references to crop-type, it was a) difficult to ascertain, requiring a bespoke script to extract, and b) provided insufficient coverage — making it hard to gauge where, or if, there were any funding gaps.
What’s Next for IATI Data Use?
Overall, the Data Use Pilot exercise showed that IATI’s depth and breadth of information is valuable despite its incompleteness. USAID hopes to include this type of analysis in future plans for a suite of analysis that every mission should be doing — a goal that we applaud, and hope to hear more about. While hopeful that this exercise has proved the advantageousness of IATI data, we also recognize that the level of effort required to use IATI data risks limited use until better tools to access the data become available. Additionally, data must be more consistently reported and validated across organizations for complete cross-organization analyses.
Despite challenges, there is a clear need and case for this data, and we hope that more organizations will take advantage of IATI in their own planning and coordination efforts as its resources and data continue to improve.
You can access the full reports here: Ghana Report, Senegal Report, map of Senegal activities, and the Landscape Analysis for Myanmar, Sierra Leone, Nepal, Malawi, Mozambique, Uganda, and Tanzania. This post is the second of a two-part series on the Data Use Pilots. James Coe is a Senior Advocacy Advisor at Publish What You Fund.
Share This Post
Related from our library

A Year After USAID: Reclaiming Control of Data Systems
Just months after the 2025 U.S. aid freeze was announced, we published a blog post warning that the USAID cuts would result in a data crisis, with some countries losing access to their digital health data. This blog explores how those systems – and the countries relying on them – have fared nearly a year on.

Introducing The HackCorruption Civic Tech Tools Repository
Introducing the Civic Tech Tools Repository: an open-source hub of digital solutions to fight corruption. Designed for growth through GitHub contributions, it brings together tools, code, and resources across six key areas for HackCorruption teams and beyond.

Building a Sustainable Cashew Sector in West Africa Through Data and Collaboration
Cashew-IN project came to an end in August 2024 after four years of working with government agencies, producers, traders, processors, and development partners in the five implementing countries to co-create an online tool aimed to inform, support, promote, and strengthen Africa’s cashew industry. This blog outlines some of the key project highlights, including some of the challenges we faced, lessons learned, success stories, and identified opportunities for a more competitive cashew sector in West Africa.