IMS Data Reporting and Visualization: What goes in must come out
Time for some real talk: a data management system is only as good as its reporting tools. It could contain the lost library of Alexandria, but if no one uses it because it’s confusing or difficult, what purpose does it serve? (If you can answer that, there’s a follow-up question about trees falling in a forest without anyone to hear.)
Data must be easy to access and easy to understand — and it needs to be both for all the different types of users accessing the system.
In the case of the UN Development Group’s Information Management System (IMS), that last point was particularly challenging — ensuring that the reporting tools could respond to the needs of different kinds of users across the UN. On one hand, this is a new database collecting new kinds of information for the first time, so it wasn’t yet clear how the data should be presented or how it would all be used. On the other hand, being within the UN system meant there were some very specific data asks as well — information to be plugged into reports, data that needed to be cross-referenced or aggregated in accordance with a range of existing reporting mechanisms.
In responding to such a wide range of use cases, we focused on choosing the right tools for the job, ensuring we had solid structures in place for reporting on reporting, and using a robust system of filters. The end result is a whole suite of reporting options, for flexible data access:
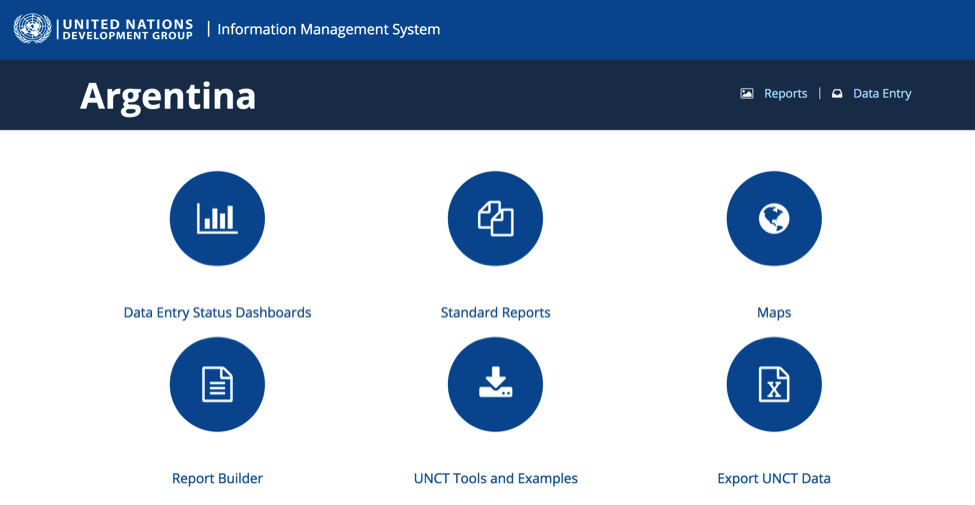
Figure 1: IMS reporting options
IMS reporting tools draw information from the data entry side of the system and make it available through a range of outlets, which present the data in different technical formats:
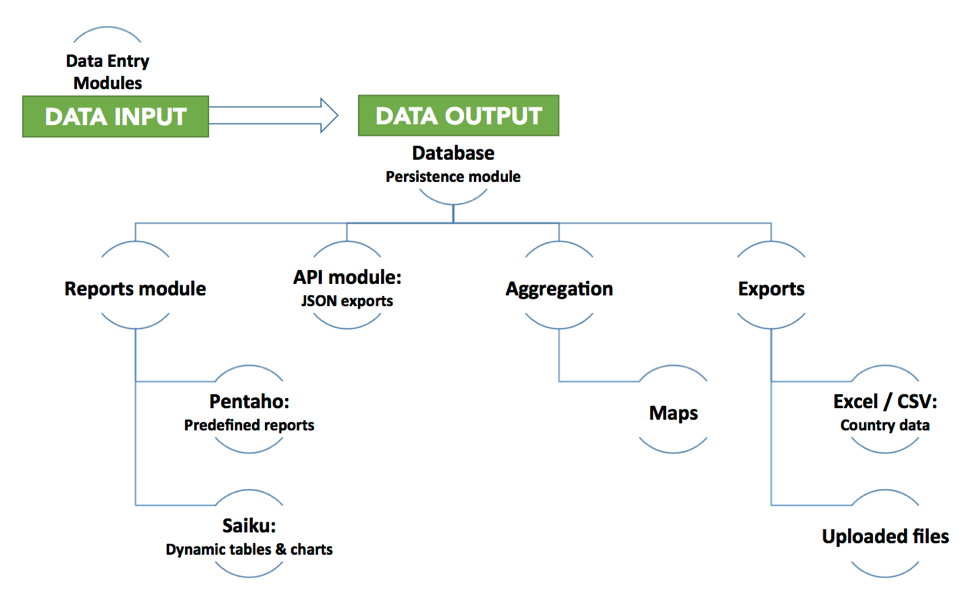
Figure 2: IMS data entry
Choosing the right tools for the job
Because no single existing tool is able to do everything the IMS needs for reporting, our team chose a combination of existing open source tools that together would serve the broadest number of needs. Thus, the reporting module provides three separate but complementary types of data access: standardized (Pentaho standard reports), dynamic (Saiku Report Builder) and direct (API, exports and downloads).
Pentaho Reporting is a Business Intelligence tool that the IMS uses to create a suite of standard, predefined reports. Its reporting engine allowed our team to build complex reports (some over 200 pages) that are viewable directly on the web and can be exported pixel-perfect in PDF, Word or Excel format. These standardized reports work well for foreseeable data needs and known use cases.
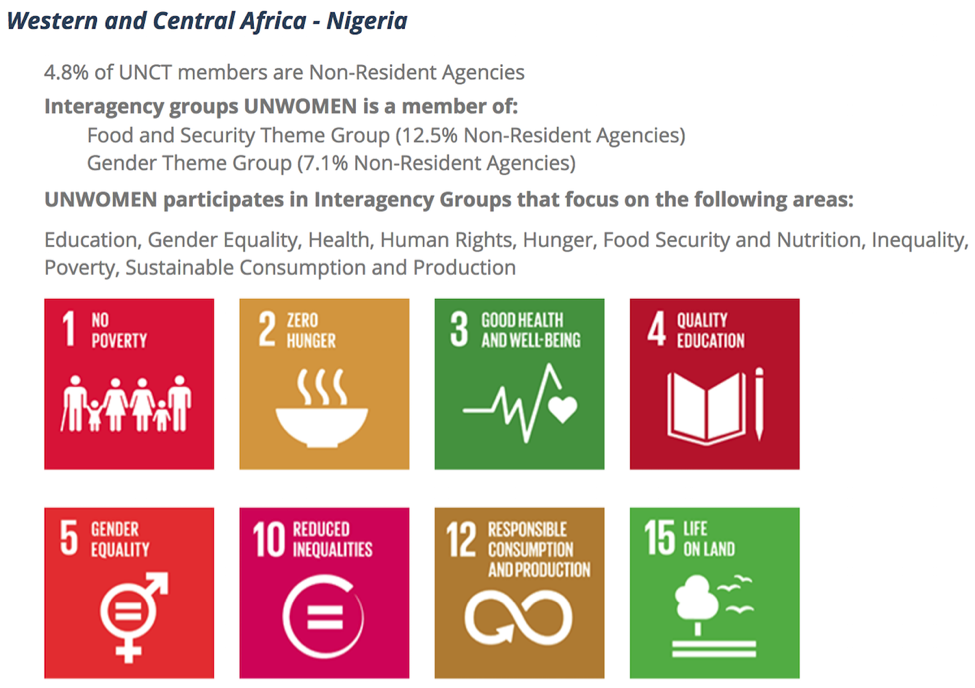
Figure 3: IMS reports
For more complex, undiscovered or niche information requests, the IMS provides a robust ad hoc report builder based on Saiku Business Analytics. Via a dynamic drag-and-drop interface, users can select indicators to cross-reference, sort, and explore. Any tables a user creates can be instantly converted into a number of different charts.
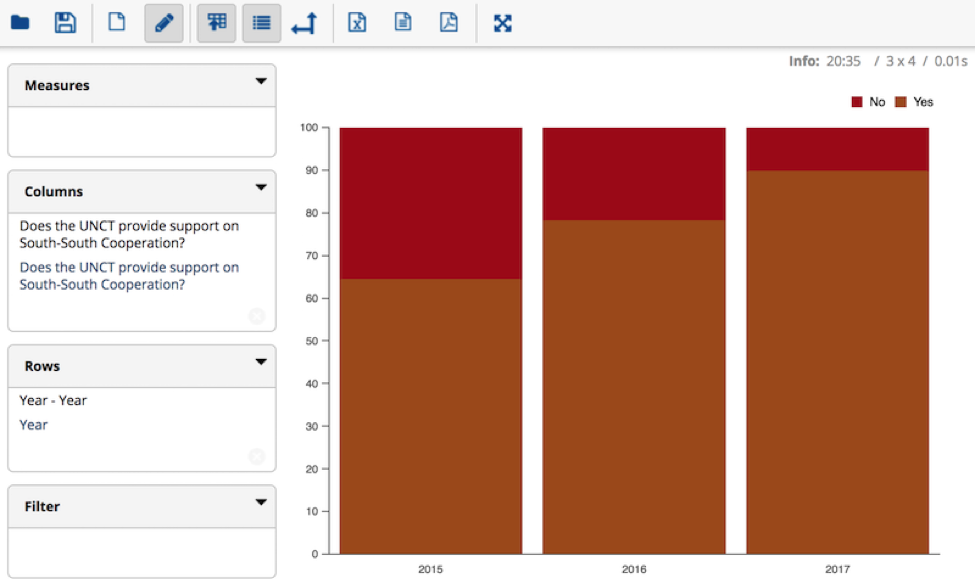
Figure 4: UN Country Teams engaged in South-South Cooperation over time
The power of filters
Given the scope of the work done by the UN Development Group, the data in the IMS is often broader than it needs to be for a specific user’s needs. To increase the usefulness of every part of the module, the IMS features a set of filters for users focusing on a specific part of the world or type of developing country.
All reports — in Pentaho and Saiku as well as dashboards, downloads and the API — can be filtered by region, country income level, or whether they fall into one of the UN’s major classification categories. (For example, countries which have a peacekeeping mission.) This means that in any part of the system, a user can choose to view reports which only show information from Latin America and the Caribbean (LAC), or from lower middle income countries — or from lower middle income countries in LAC — without having to sift through irrelevant data.
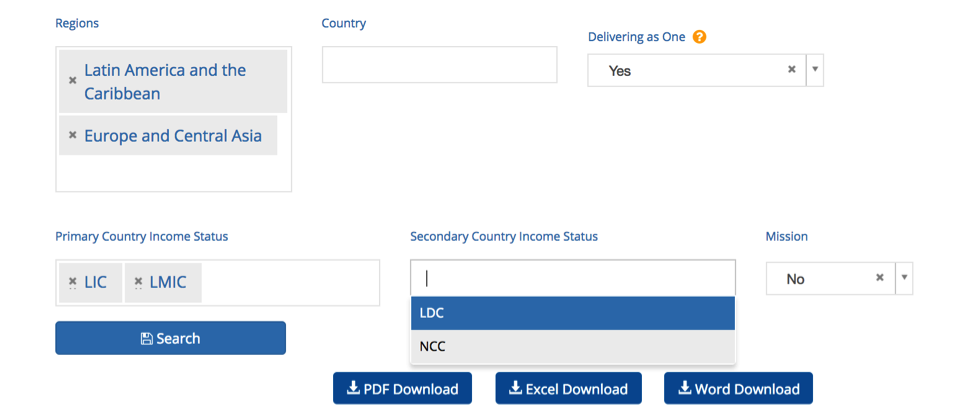
Figure 5: IMS report filters
Reporting on reporting
When designing a data management system, it’s easy to overlook the need for it to track and report on its own data collection process. Who has entered data? What remains to be collected? Without tools in place, answering those questions can become an arduous, nebulous task. The larger the system, the more important this is. To address this need, we developed a set of status dashboards which show the progress made by countries entering data.
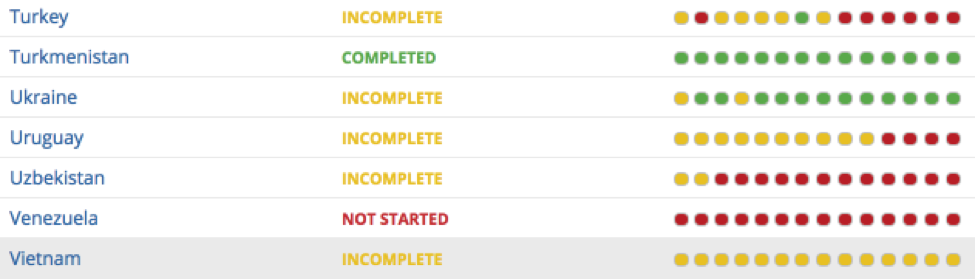
Figure 6: IMS status dashboards
This is useful for regional coordinators checking in on which countries have completed their reporting, and headquarters administrators who want to see the completeness of the statistics they’re accessing. Because the dashboards are visible to all users, they can also provide a bit of positive peer pressure, encouraging country teams to finish their reporting and turn themselves green. (We’re big believers in transparency as incentive.)
So what’s the takeaway from all of this? Ultimately, the success of the IMS — and other digital development projects — is not about any one software tool or configuration. Instead it comes from letting the user’s needs drive the technical decision-making process. By asking a lot of questions, we discovered a whole range of scenarios for who would use the data and how. If we’d begun by choosing a tool we thought would fit the data model, it wouldn’t have been nearly as flexible. Instead, we were able to think outside the box and use tools designed to make the data and the system conform to the user’s needs — and not the other way around.
Read our first post about building the IMS.
DG’s IMS Team: Catalin Andrei, Carmen Cañas, Octavian Ciubotaru, Taryn Davis, Ionut Dobre, Galina Kalvatcheva, Paige Kirby, Mihai Postelnicu, Martha Staid, Llanco Talamantes
Image: Nelson Wu CC BY-NC-ND 2.0
Share This Post
Related from our library

Beyond Kigali: Where Does Africa Go from Here with AI?
As the AI momentum builds, Development Gateway is asking different questions: where the data comes from, how reliable it is, how legacy systems will supply usable data, and whether governments have the capacity to govern and trust the AI tools they’re being urged to adopt.

Stakeholder, Where Art Thou?: Three Insights on Using Governance Structures to Foster Stakeholder Engagement
Through our Tobacco Control Data Initiative (TCDI) program and its sister program Data on Youth and Tobacco in Africa (DaYTA), we have learned that creating governance structures, such as advisory boards or steering committees, is one approach to ensuring that digital solutions appropriately meet stakeholders’ needs and foster future stakeholder engagement. In this blog, we explore three insights on how governance structures can advance buy-in with individual stakeholders while connecting them to one another.
DG’s Open Contracting Portal Designated as a Digital Public Good
Digital Public Goods Alliance designated DG’s Open Contracting Portal as a digital public good in September 2022. The Portal provides procurement analytics that can be used to improve procurement efficiency and, in turn, reduce corruption and increase impact.