Interactive Dashboard Shows Aid Trends in Africa
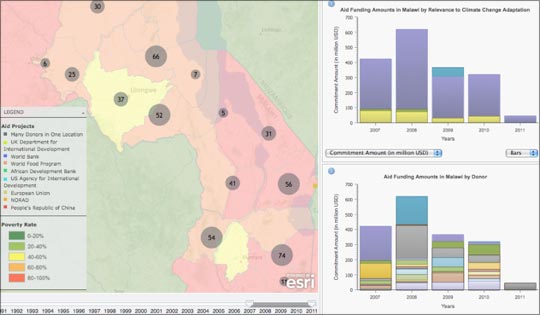
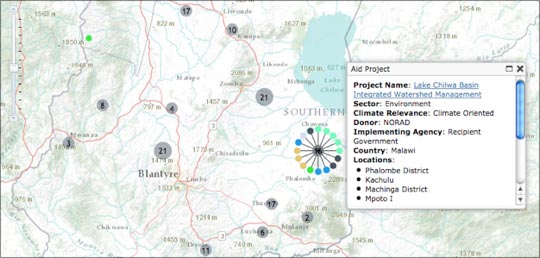
The Strauss Center’s Climate Change and African Political Stability (CCAPS) program has released a new aid dashboard that includes an interactive map and graphing tools, allowing users to explore trends in aid allocation by donor, sector, and demographics across Africa. The dashboard is a collaborative effort that includes geocoded aid data from CCAPS and several partner institutions. AidData and CCAPS built the aid dashboard using Esri tools to combine trends analysis with the most comprehensive collection of geocoded data on aid projects in Africa.
Among other information, the dashboard features the first-ever dataset tracking all climate aid activities in a single country. In a pilot study, CCAPS researchers applied their new “climate coding” methodology to all official development aid projects in Malawi’s Aid Management Platform assessing each project activity for its relevance to climate change adaptation.
The new dataset opens the door for detailed comparative analysis of climate change adaptation programs and their effectiveness in targeting specific climate risks within a country. Through a collaboration between CCAPS, AidData, and the Government of Malawi, the data were also geocoded, allowing analysts to assess the aid allocation visually as well.

In addition, the aid dashboard includes African Development Bank projects continent-wide geocoded by AidData, and World Bank projects continent-wide geocoded through the World Bank-AidData Mapping for Results initiative.
“The CCAPS aid dashboard allows analysts to explore aid spending as big picture trends or local project information,” said CCAPS program manager Ashley Moran. “Our aim is to provide these new data in a way that is as useful as possible to policymakers and researchers needing to ask very focused questions about aid investments and impacts.”

CCAPS researchers “climate coded” over 700 projects in Malawi and found that climate aid, narrowly defined, makes up just 1-2% of aid to Malawi. Norway, the World Bank, USAID, and the European Union are among the donors most involved in adaptation aid in Malawi. Japan and Ireland have several adaptation-related projects, yet their financial contributions are much smaller. The CCAPS research team plans to expand the climate-coding effort continent-wide for several large donors over the next year. The data will be updated on the CCAPS aid dashboard as they become available.
Share This Post
Related from our library

Economic Toll of Tobacco-Related Diseases in Kenya: New Research Findings
Development Gateway: An IREX Venture (DG) is pleased to announce the publication of a research manuscript on the Economic Costs of Tobacco-Related Illnesses in Kenya. This research was carried out as part of the Tobacco Control Data Initiative (TCDI) activities in Kenya and is part of a broader report on Morbidity and Mortality from Tobacco Use in Kenya.

Unlocking Africa’s Agricultural Potential: Introducing the Soil Nutrient Roadmap
For over a decade, Development Gateway: An IREX Venture (DG) has been at the forefront of digital agriculture, leveraging agricultural data to support input monitoring, value chain analysis, and farmer-centric governance models. With funding from the Gates Foundation, DG is launching the Soil Nutrient Roadmap (SNR), a cutting-edge initiative using geospatial data to estimate current and future soil and crop nutrient requirements.

Diving into the DaYTA Program’s Data Collection Process
This blog explores key insights from the DaYTA program, offering practical guidance for researchers on effective data collection, overcoming field challenges, and leveraging local partnerships to enhance tobacco control efforts. This piece is especially timely following DaYTA’s workshop convening all 3 study country stakeholders to review the survey results and strategize on how best to disseminate this data to target audiences. This workshop took place from in Lagos, Nigeria, from November 18-20th.