Making IATI Work for Donors: Lessons from USAID and DFID
There are approximately 42,000 agricultural projects published through the International Aid Transparency Initiative (IATI). These projects contain information on which donors are spending what and where. The Initiative for Open Ag Funding has repeatedly heard that this information can be a powerful tool when planning and coordinating projects. Yet despite such enthusiasm, we found that few had ever actually put the data to the test.
For this reason, as part of the the Initiative for Open Ag Funding, Publish What You Fund and Development Gateway conducted a “Data Use Pilot”. Our goal was simple: work with donor agricultural teams to support their strategic planning of a project, by using IATI data. For this, we worked with both the UK’s Department for International Development (DFID) and USAID’s Feed the Future (FTF) program. This was particularly relevant for FTF, as they were beginning to plan for the next five years, and anticipated budget cuts would mean that that where and how USAID worked would become even more important.
For FTF, we focused on the countries of Ghana and Senegal. For DFID, we fed into the development of a commercial agricultural project, which required producing landscape analyses for Myanmar, Sierra Leone, Nepal, Malawi, Uganda, Mozambique, and Tanzania. Our objective was to help DFID ultimately select three countries, with two crop-types per country. As a result of this work, we arrived at the following takeaways:
Project planners have questions about who is doing what, and where. We began by asking individuals involved in project planning what questions they need to answer during the planning process. Responses included:
-
How can we leverage what other donors, host governments, or local community leaders are doing to address nutrition challenges in and near our Zones of Influence (ZOIs)?
-
Can we reduce the geographic scope of health and nutrition programming, without affecting reach, by building on past successes and collaborating with other donors to share knowledge and resources? Would doing so create a beneficial spillover effect into rural communities?
-
What are other key outcome indicators from other donors working in the sector?
-
Are there more crossover programs (such as within WASH, fortified crops, infrastructure, facilities, and pharmaceuticals) that we can leverage in our ZOIs?
-
Where, what, and who is working in or near current ZOIs in voucher and cash transfer programs that we can utilize in the future?
- What other donors and/or host government programs/policies are already in place to address cash/credit access needs?
-
Who is investing in agriculture in the countries we are interested in, and how has funding changed in recent years?
-
Where are the funding-gaps in these countries?
-
What approaches are other donors taking and what can we learn from them?
-
Who is investing in the specific crop-types we are interested in, and what are they doing?
Based on the above, we understood that planners were interested in three key factors:
-
Identifying relevant projects and approaches from other donors in the country/sector;
-
Locating projects near the planned intervention zones;
-
Understanding how to leverage the outcomes of other projects.
IATI can help answer these questions — to an extent. We found that the registry is useful for conducting basic landscape analyses. But in order to do so effectively, the user must be very familiar with the registry’s limitations. For example, some major donors publish very limited IATI data; as a result,, their projects will not appear in a landscape analysis, if the registry is the sole data source. Additionally, we found that the information available is too basic to answer some key landscaping questions, such as who is investing in particular crop types.
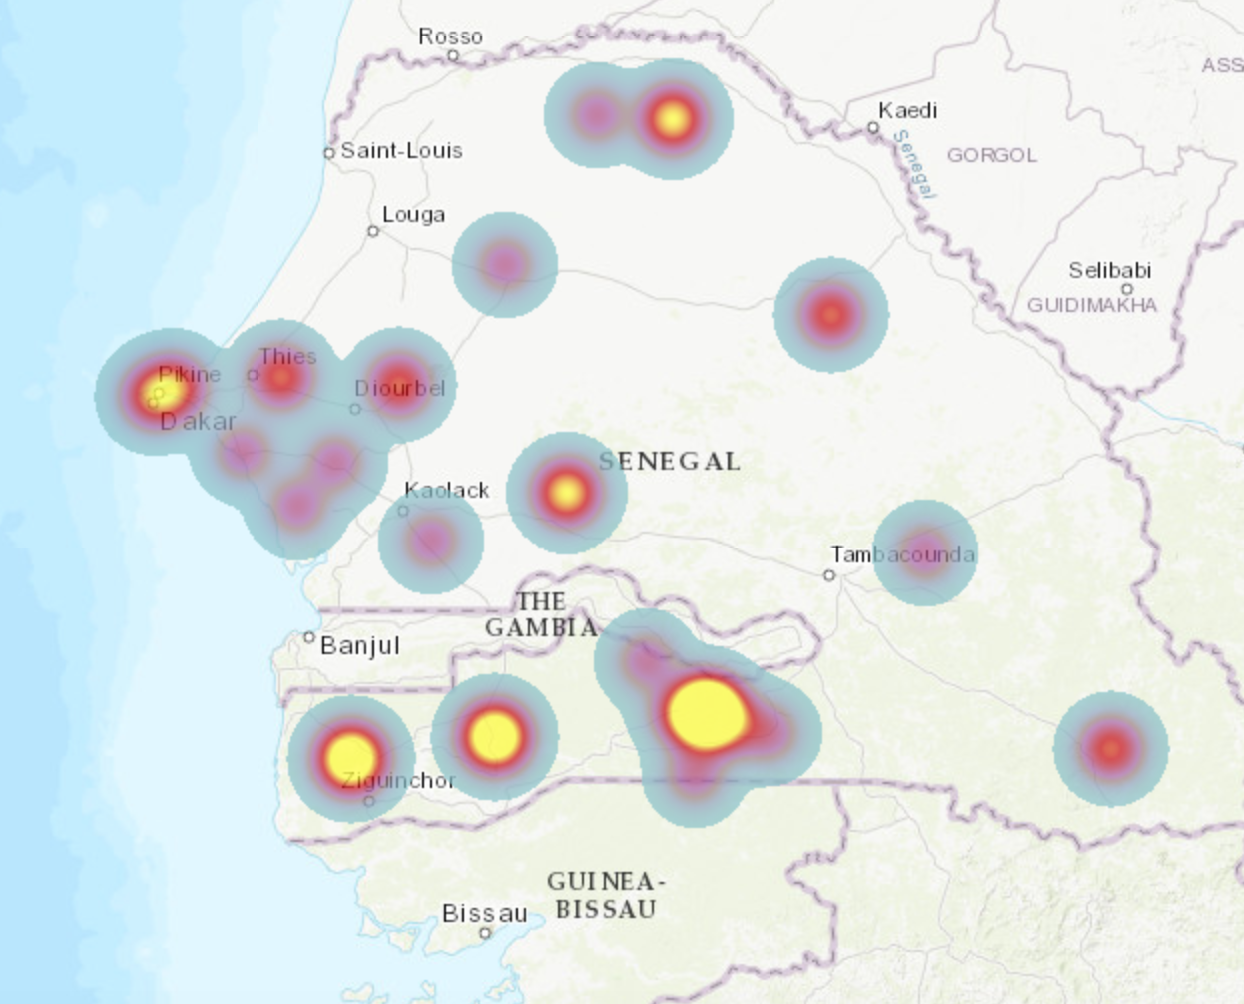
Map of Senegal IATI Nutrition Projects
Further, publishers to IATI tend to be international development organizations –projects funded by host governments or funded at the community level are not captured. Therefore, even with 20,000 active projects for a given sector/country, a sizable gap remains in the the overall picture of interventions. As more donors publish to IATI and more country aid systems integrate with IATI, this gap will hopefully begin to close.
This post is the first of a two-part series on the Data Use Pilots. Next week, we’ll share a second post outlining takeaways from the process. James Coe is a Senior Advocacy Advisor at Publish What You Fund.
Share This Post
Related from our library

Introducing The HackCorruption Civic Tech Tools Repository
Introducing the Civic Tech Tools Repository: an open-source hub of digital solutions to fight corruption. Designed for growth through GitHub contributions, it brings together tools, code, and resources across six key areas for HackCorruption teams and beyond.

Building a Sustainable Cashew Sector in West Africa Through Data and Collaboration
Cashew-IN project came to an end in August 2024 after four years of working with government agencies, producers, traders, processors, and development partners in the five implementing countries to co-create an online tool aimed to inform, support, promote, and strengthen Africa’s cashew industry. This blog outlines some of the key project highlights, including some of the challenges we faced, lessons learned, success stories, and identified opportunities for a more competitive cashew sector in West Africa.
Digital Transformation for Public Value: Development Gateway’s Insights from Agriculture & Open Contracting
In today’s fast-evolving world, governments and public organizations are under more pressure than ever before to deliver efficient, transparent services that align with public expectations. In this blog, we delve into the key concepts behind digital transformation and how it can enhance public value by promoting transparency, informing policy, and supporting evidence-based decision-making.