New Tools for Geospatial Data Use
The Aid Management Program (AMP) helps governments and development partners gather, access, and monitor information on development activities, with the goal of increasing aid effectiveness. The Program’s software, AMP, provides visualization tools that enable users to analyze and visualize development activities.
Last year, with the support USAID’s Higher Education Solutions Network through the AidData Center for Development Policy, DG’s software development team enhanced the platform’s GIS module. These enhancements were made based on findings from country-level research on how development data are used in Senegal, Timor-Leste, and Honduras. In particular, development actors in Timor-Leste and Honduras expressed a desire for tools that would permit more customized analysis.
Based on this demand, we created two new features for the platform’s GIS Module: a statistical layer upload wizard, which helps non-technical users easily create new map layers, and a gap analysis view, allowing users to compare indicator and funding data.
The technical team worked on the initial design of the system, which was improved in the development phase. The feature was then developed iteratively using the Scrum methodology, and rolled out through trainings in Honduras and Timor-Leste.
How to use the New Tools
The statistical layer upload wizard allows any user to more easily upload and visualize statistical information, overlayed with geocoded project sites. Public users’ data will only be visible to the uploader (stored in the browser for 12 hours), while government administrators can make a new statistical layer publicly or privately accessible. To access the new wizard, navigate to the AMP’s GIS Module (Aid Transparency Portal in Timor-Leste). Under “Statistical Data”, select the “Statistical Layers Manager,” and follow the prompts.
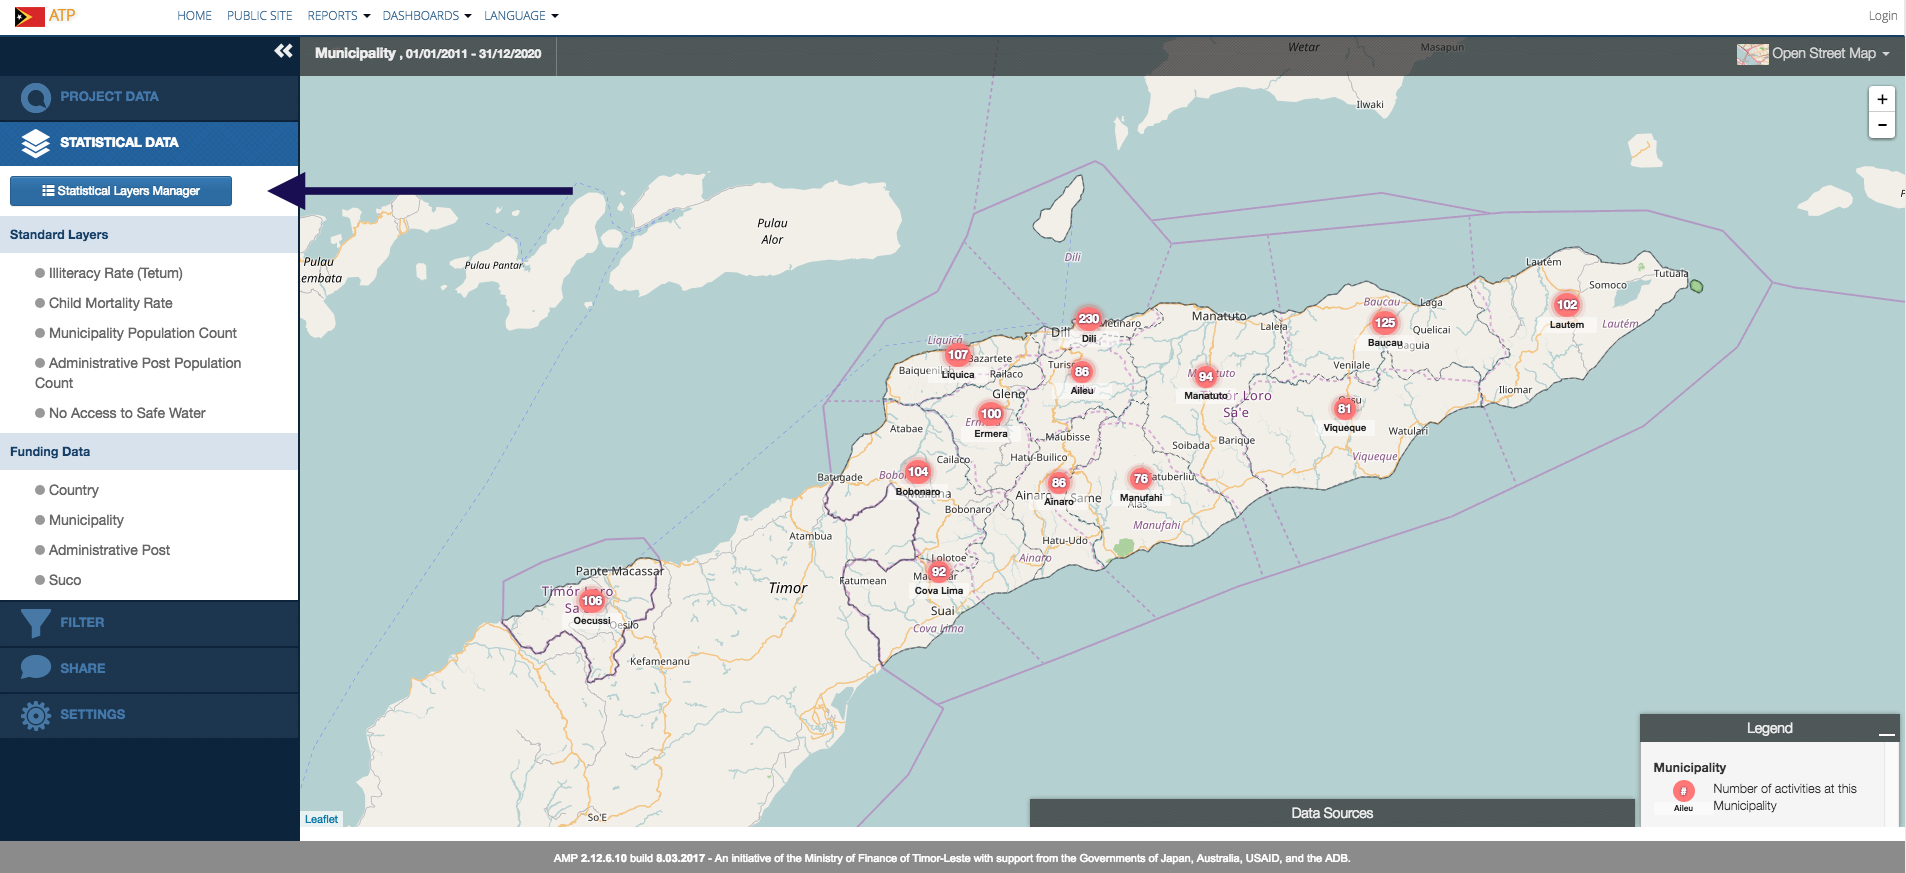
Figure 1: Accessing the Wizard
First, enter a name for your layer. For example, if adding a population layer from using census data, title it “Population”. Next, select under the “Indicator Type” section, add a measure label (for our example, “people”) and layer type (“Count”).
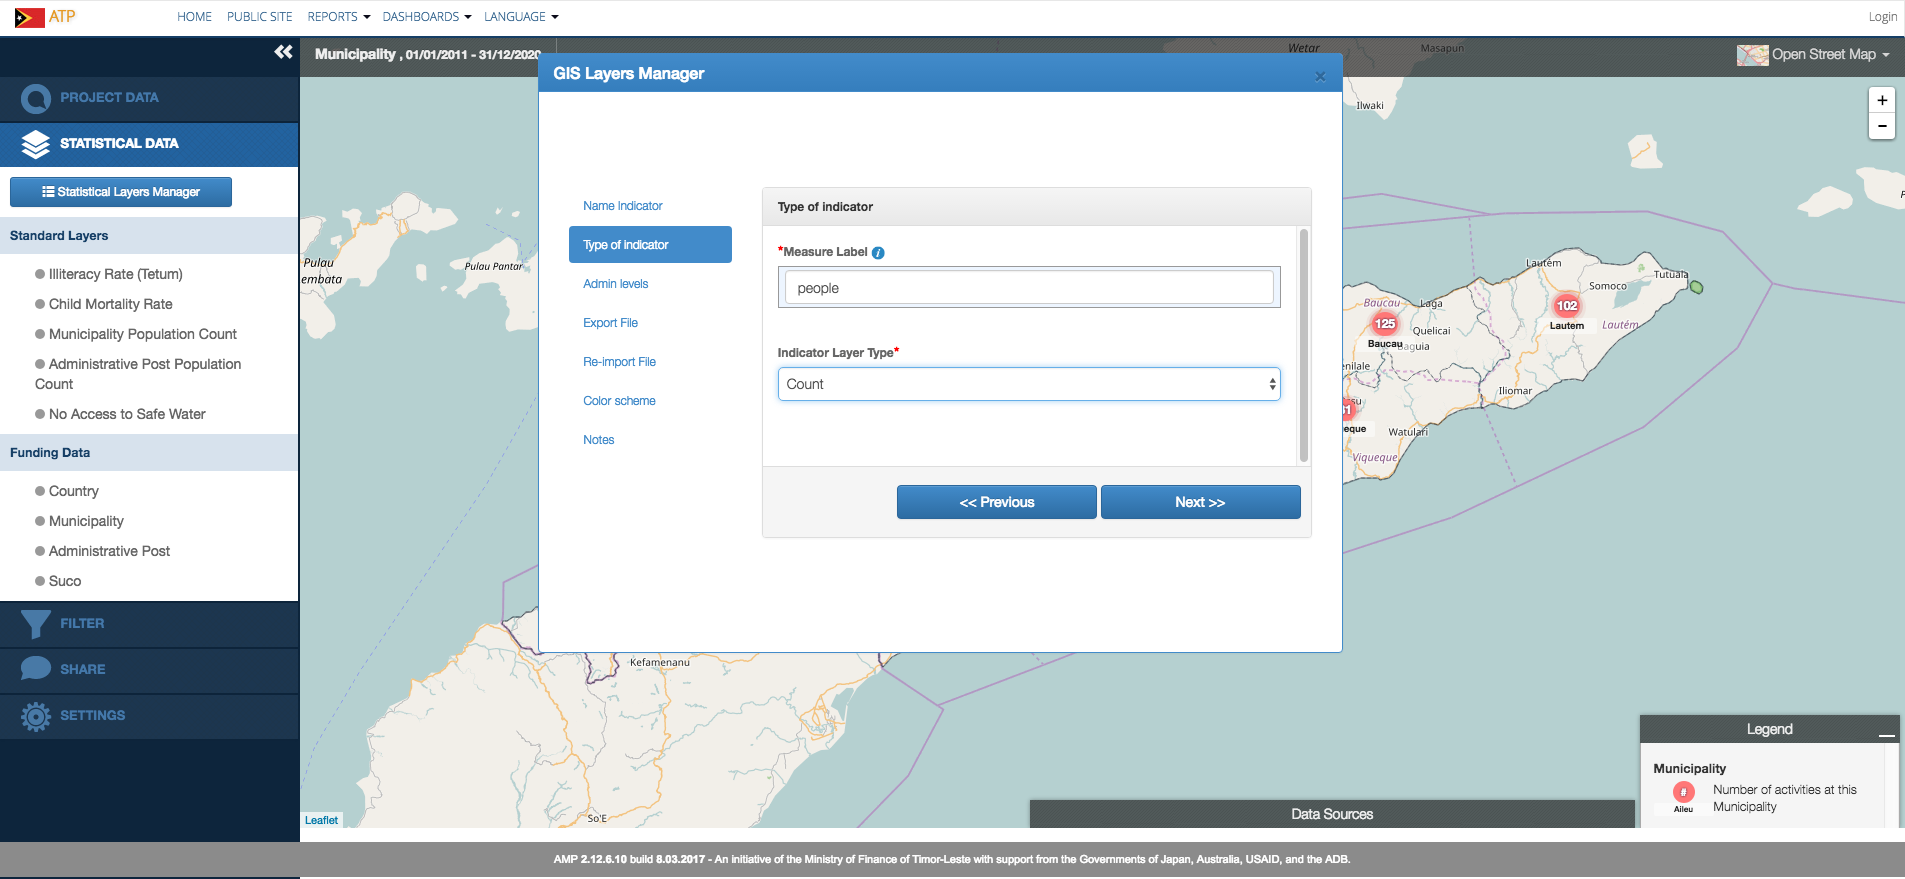
Figure 2: Selecting Indicator Type
You will then asked to choose your ADM level — how geographically disaggregated your statistical layer will be. Will it show information at the national, district, or suco level? This will inform the “Export” step that comes next. For our example, select “District”. Then, the system will generate an Excel indicator table file. Using this template, enter your indicator data, corresponding with its region. Using the system-generated Excel is important, as AMP assigns a unique code to each ADM level.
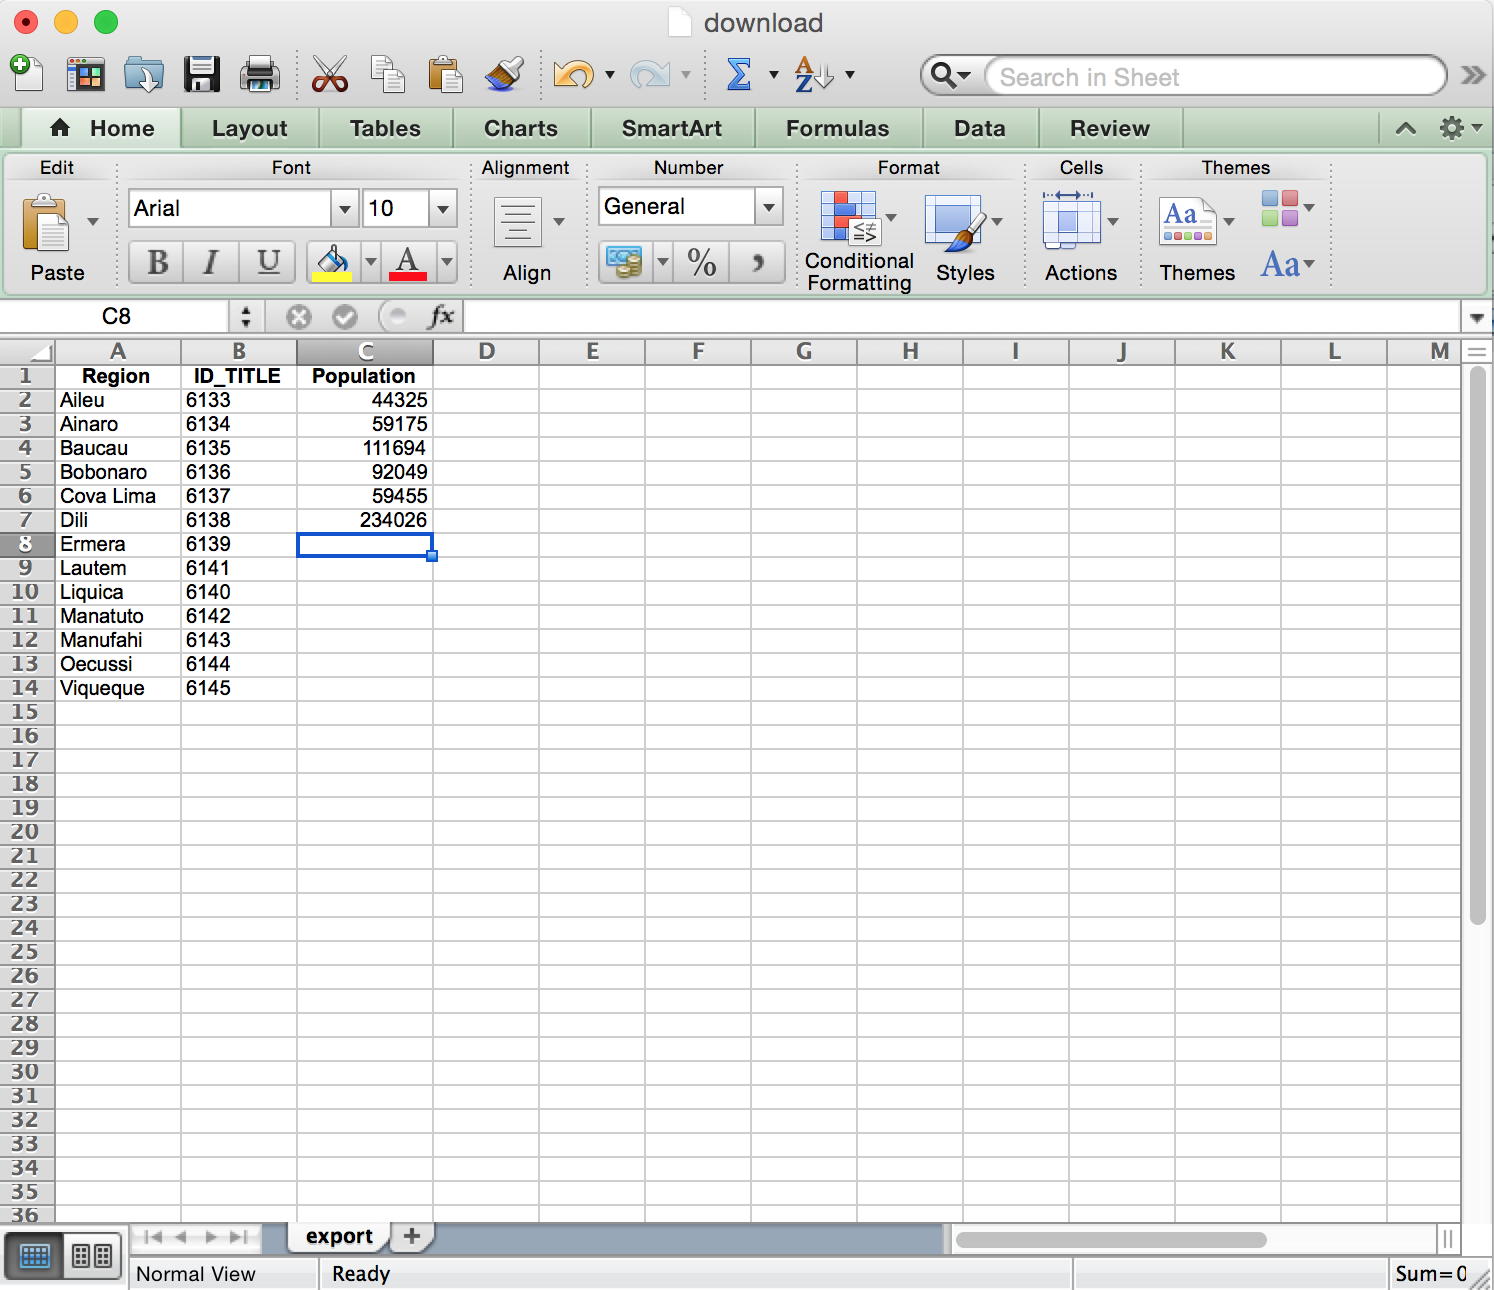
Figure 3: Adding Statistical Data
After re-uploading the layer in the next step, you can pick a layer color scheme, and the number of classes. The system will automatically display the statistical layer based on these classes. For example, if you select only two classes, you will see two color shades; go ahead and put “5”. Finally, you may enter any notes for this layer — in this case, put “Timor-Leste Census (2010)”. And click “Submit”. To view the layer, click on its name in the side pane.
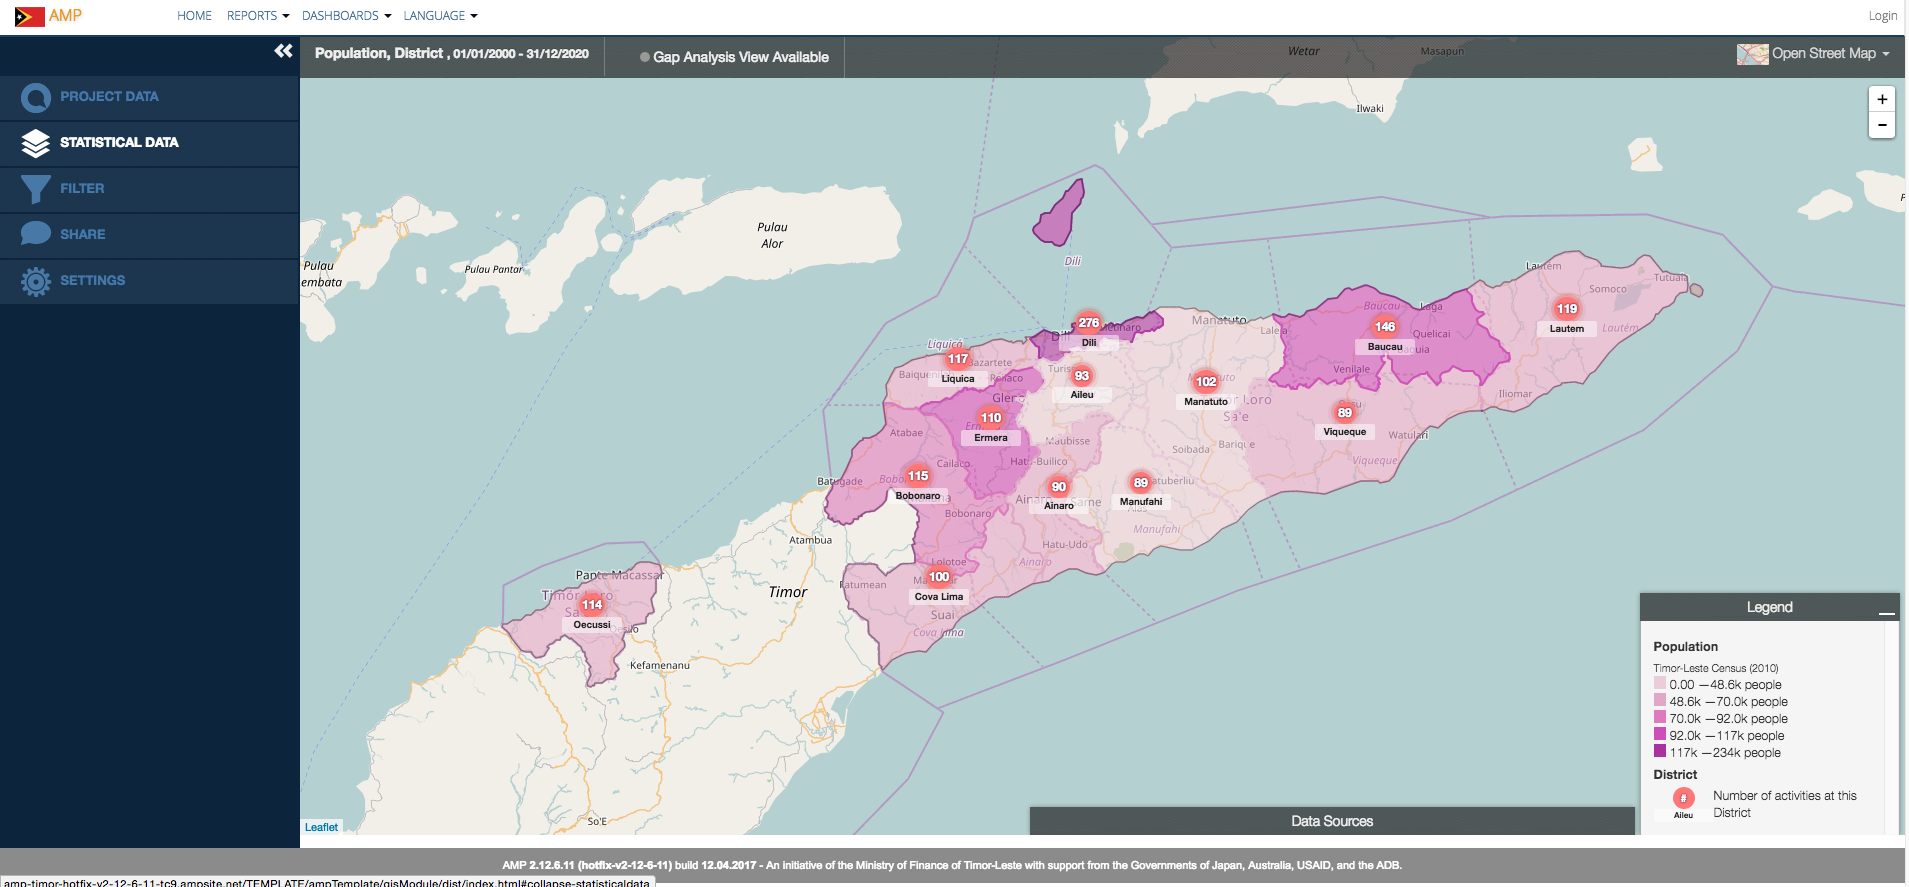
Figure 4: New Population Layer
The gap analysis view can be used to analyze funding by location and indicator. In our case, if we apply the gap analysis with the population layer visible, we can view per capita funding by district/municipality. (In order for the “gap analysis view” option to appear, you must have an indicator layer selected.)
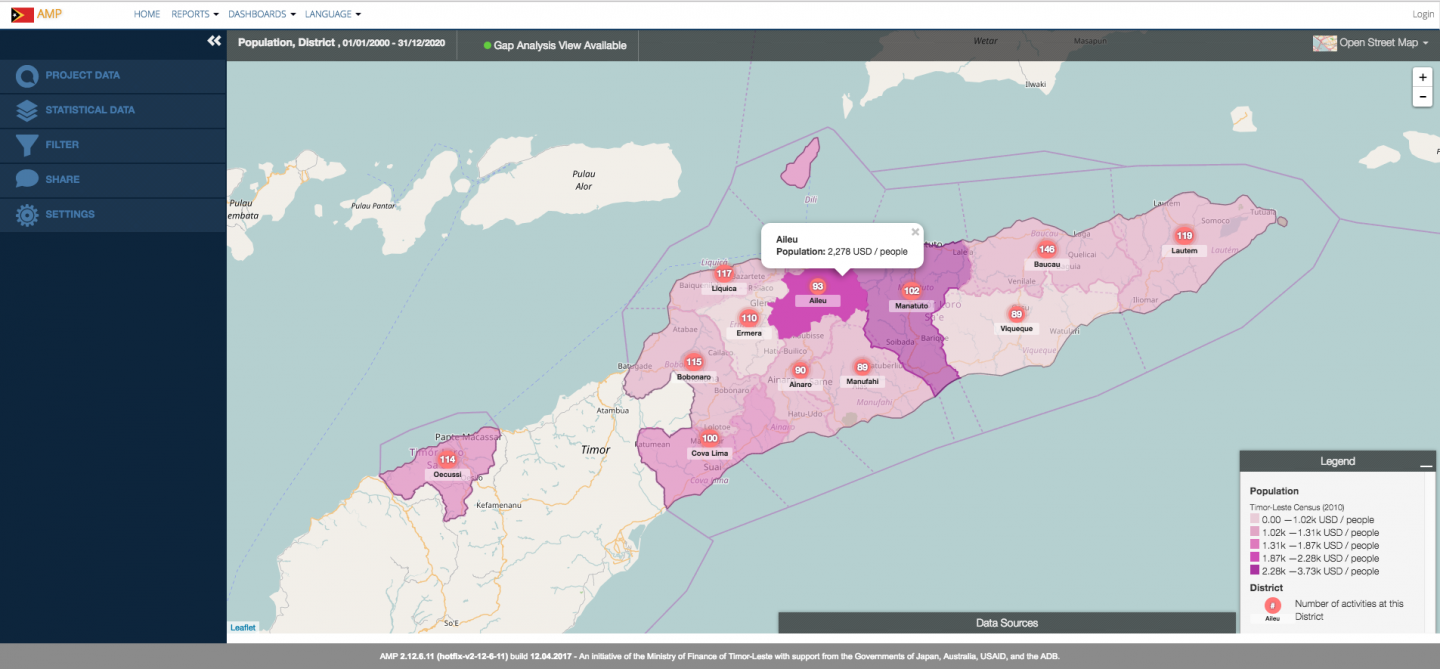
Figure 5: Gap Analysis View by Population
Understanding the geographical distribution of funding is very important to policy makers and planners. This information can be used to address regional imbalances, and help a country achieve its national objectives through data-driven decision-making. Though DG’s Aid Management Program, these new features are scalable to over 25 AMPs worldwide — and, through the continued support of USAID, we will be expanding this work over the coming year. Stay tuned for more details.
Share This Post
Related from our library

Beyond Kigali: Where Does Africa Go from Here with AI?
As the AI momentum builds, Development Gateway is asking different questions: where the data comes from, how reliable it is, how legacy systems will supply usable data, and whether governments have the capacity to govern and trust the AI tools they’re being urged to adopt.

How Useful Is AI for Development? Three Key Lessons
The development world is buzzing with excitement over the idea that new and emerging applications of AI can supercharge economic growth, accelerate climate change mitigation, reduce inequalities, and more. But what does this look like in real life?

Stakeholder, Where Art Thou?: Three Insights on Using Governance Structures to Foster Stakeholder Engagement
Through our Tobacco Control Data Initiative (TCDI) program and its sister program Data on Youth and Tobacco in Africa (DaYTA), we have learned that creating governance structures, such as advisory boards or steering committees, is one approach to ensuring that digital solutions appropriately meet stakeholders’ needs and foster future stakeholder engagement. In this blog, we explore three insights on how governance structures can advance buy-in with individual stakeholders while connecting them to one another.