Open for the Public, Useful for the Government
To learn more about the launch of the Philippines GIS Portal, read our first post.
When we started to plan the technical architecture of the new GIS Portal for the Philippines’ National Economic and Development Agency (NEDA), we focused on a core goal: not only should information related to development assistance and public investment projects be easily accessible to the public, in order to facilitate government transparency; the tool should be also useful to the agencies that manage the information shown in the GIS Portal. We believe that if the government finds the application practical, and can use the tool to make decisions based on the maps, charts, and layers provided, they will work to ensure the data is maintained and updated regularly. If data is updated regularly, we in turn feel that this will help citizen engagement will grow.
With the above idea in mind, we also had a list of initial technical requirements, including:
- Ability to show project layers by ADM levels (region/province/municipality)
- Funding allocation by region
- Ability to filter the projects’ information by several fields
- Layers responsive to filters
- Charts by funding type and number of projects
- An admin module to configure specific data to show to end-users
And some non-functional requirements, like:
- Optimized for slow internet connection
- Straightforward user interface
- Separation between frontend and backend, so the backend could be replaced in the future with local REST endpoints
- Easy to update and maintain
Having those requirements in mind, we selected an appropriate technology stack.
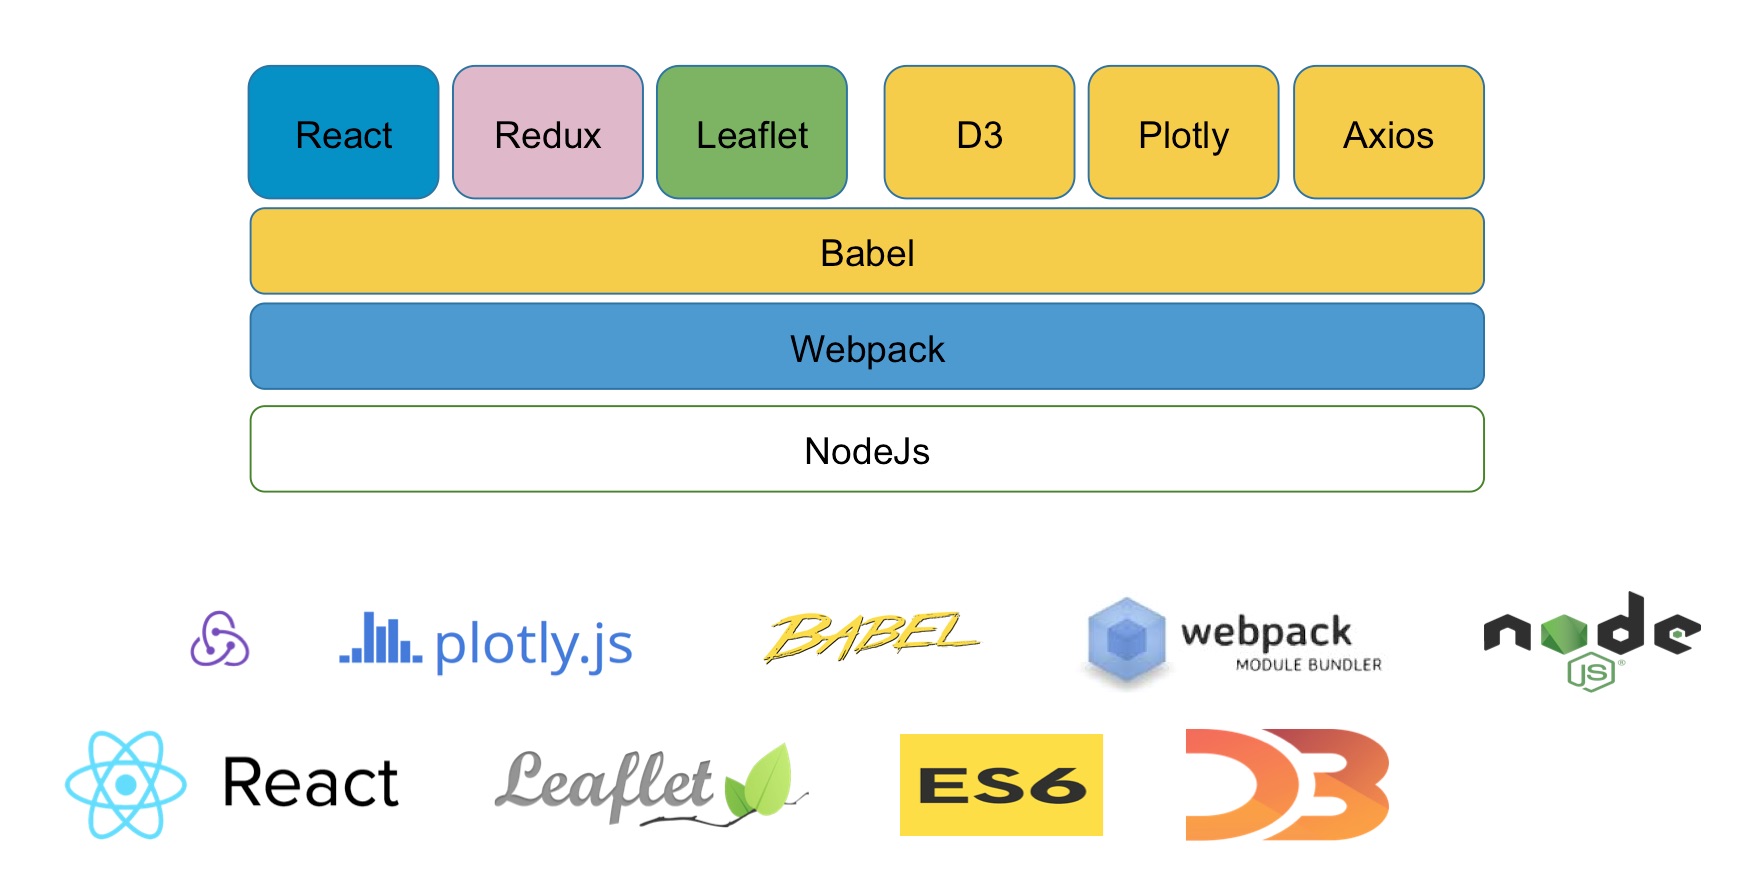
Figure 1: User Interface Technology Stack
For the portal’s user interface (UI), we developed an intuitive and powerful front-end that allows faster and easier data visualization. It is a javascript application based on several well known libraries like React, which automatically manages all UI updates when the underlying data changes; Leaflet, which is used to draw interactive map tiles; Plotly, which allows us to show interactive charts; i18next which provides translations support to the application; and others. The UI uses REST endpoints for the services needed from the backend, as well as basic security. The portal has a responsive design in order to support both desktop and tablet views.
By combining D3 and Leaflet, we could have both a solid map library and a powerful visualization tool. The image below shows SVG images added to a map in an easy way, which improves the user experience even with slow connections.
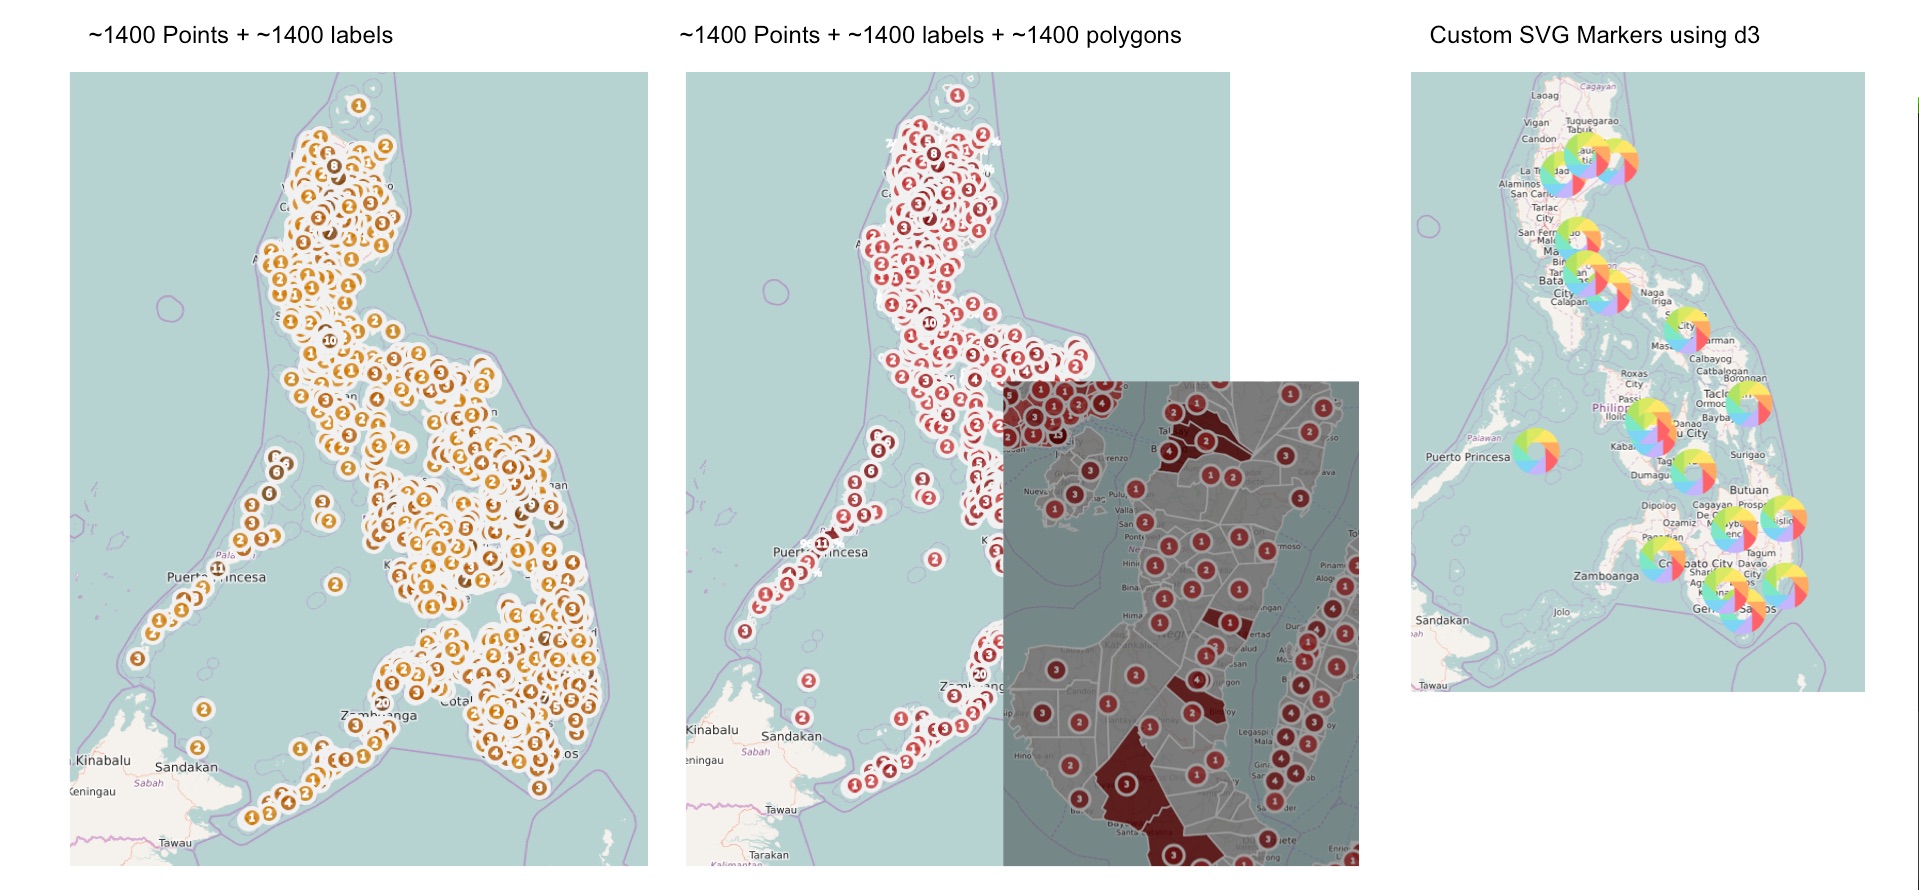
Figure 2: Optimized Map UI
In the portal’s backend, we reused some of the modules provided by the DG Toolkit to create a standalone, java-based application program interface (API) that implements a set of REST services, which provides the information needed to feed the UI module.
Some of the features provided for the services’ endpoints are:
- Aggregated data for chart visualization
- List of filters that can be applied at UI
- Specific data by location with GeoJSON format
- Import of indicators
- Export of data in different formats (PDF, XLS, CSV)
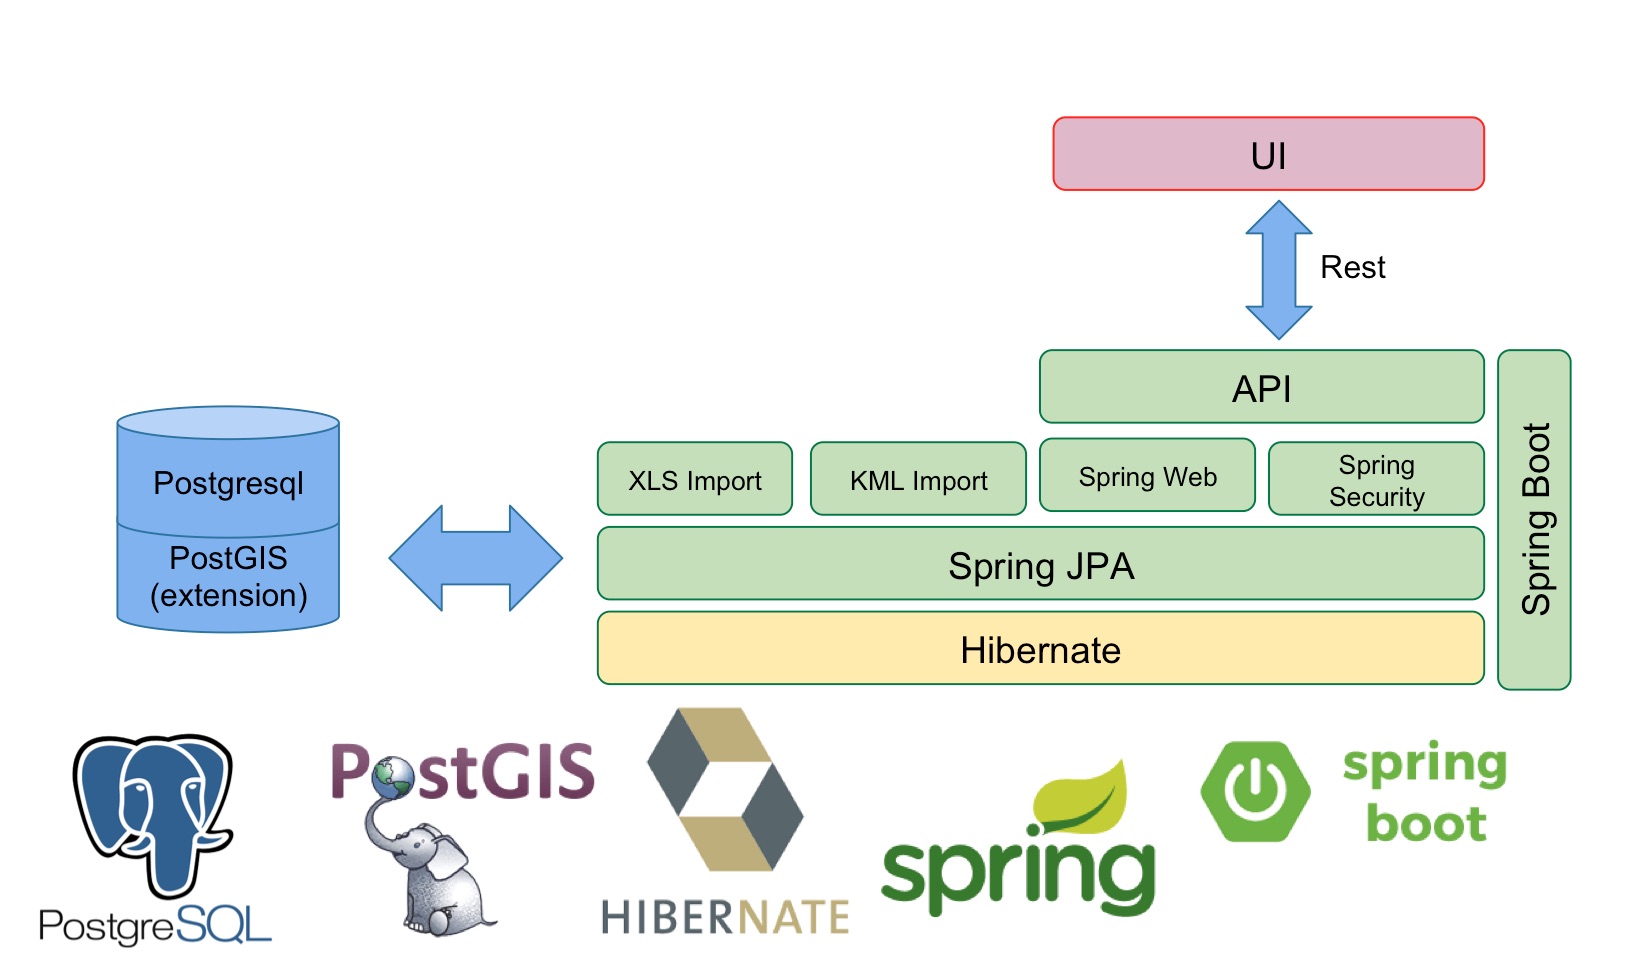
Figure 3: Backend Technology Stack
In the backend stack diagram you can see two import modules. One is for dataset import (the XLS Import module), that will reduce the total cost of ownership of the application. Government agencies have been working with such datasets during the last few years. The other import module is for KML maps, which is the format that NEDA was using to store geo-located pictures of project execution.
Hibernate and Spring JPA modules are responsible for data access, persistence and cache, this open source frameworks provides not only high performance but also scalability.
The PostGIS DB extension we used in the backend architecture permitted us to add support for geographic objects, allowing location queries to be run in SQL. For the GIS Portal we imported shapes of 3 different administrative levels (municipality, province, and region). As example of the use case of this feature, any portal user can change the level of detail for the displayed map layer — useful when zooming in and out.
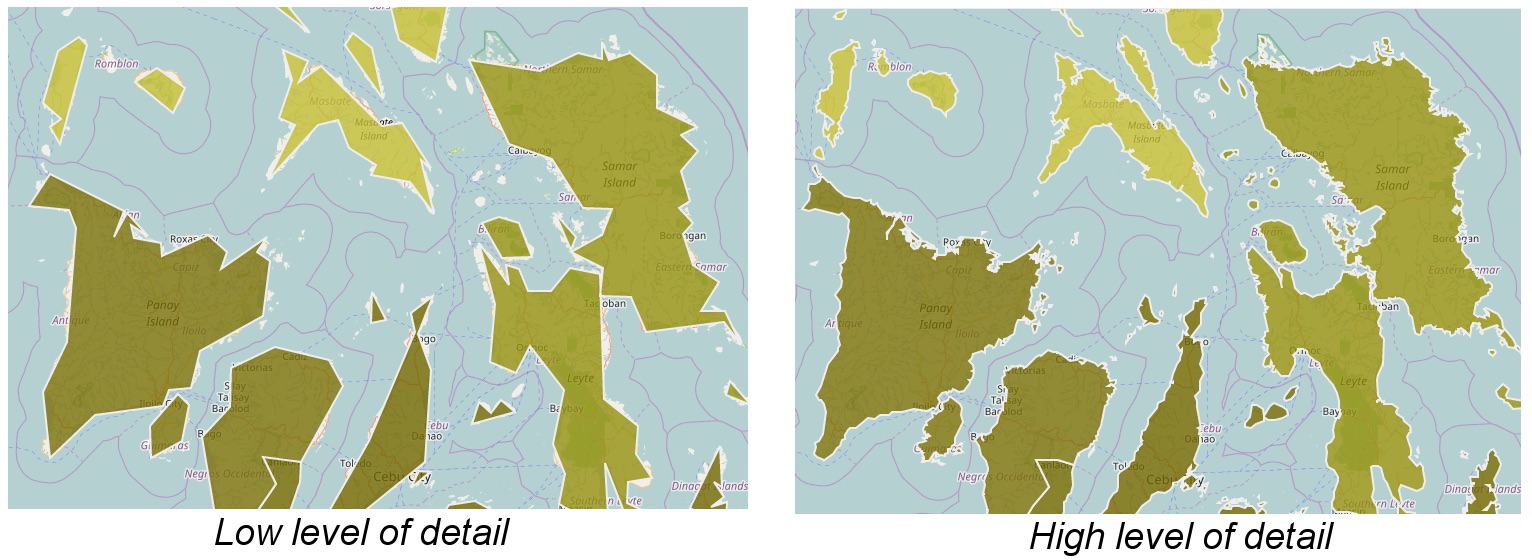
Figure 4: PostGIS DB Extension Capabilities
The backend application can be installed in any operative system that supports Java 1.8, like Linux or Windows. Since communication between the UI and API is stateless, the application could be easily scaled on demand by adding more servers behind a load balancer solution.
The result of all this technical development? A government-owned tool that allows users to visualize and analyze both government and development partner-funded projects. We hope that this portal provides government agencies a new way to monitor projects through GIS and data visualization, and serves as a resource for data-driven prioritization and decision-making; and that it provides the public with transparent and accessible information, providing a complete picture of government and development partner activities in-country.
GIS Portal Team: Liliana Mercado, Sebastian Dimunzio, Mauricio Bertoli, Llanco Talamantes, Marina Baralo, Josh Powell, Vanessa Goas, and Daniel Oliva Bianco.
Share This Post
Related from our library

A Year After USAID: Reclaiming Control of Data Systems
Just months after the 2025 U.S. aid freeze was announced, we published a blog post warning that the USAID cuts would result in a data crisis, with some countries losing access to their digital health data. This blog explores how those systems – and the countries relying on them – have fared nearly a year on.

Introducing The HackCorruption Civic Tech Tools Repository
Introducing the Civic Tech Tools Repository: an open-source hub of digital solutions to fight corruption. Designed for growth through GitHub contributions, it brings together tools, code, and resources across six key areas for HackCorruption teams and beyond.

Building a Sustainable Cashew Sector in West Africa Through Data and Collaboration
Cashew-IN project came to an end in August 2024 after four years of working with government agencies, producers, traders, processors, and development partners in the five implementing countries to co-create an online tool aimed to inform, support, promote, and strengthen Africa’s cashew industry. This blog outlines some of the key project highlights, including some of the challenges we faced, lessons learned, success stories, and identified opportunities for a more competitive cashew sector in West Africa.