Score! A new way to assess DP monitoring systems
In a recent post we introduced the Results Data Scorecard, a method for assessing the accessibility of results data across development partners. In this post, we’d like to briefly introduce the categories of the scorecard itself.
Overall Scorecard Methodology
The first step in constructing our scorecard methodology was consulting existing studies of aid transparency, including Publish What You Fund’s (PWYF) Aid Transparency Index (ATI), an Evans School study on results systems, and International Aid Transparency Initiative’s (IATI) Annual Report. Through revising these reports, we arrived at a consensus about which elements are most important in donor monitoring systems. These elements form the framework against which we compared and scored the project-level monitoring systems of 16 development partners.
The scorecard consists of five broad categories:
-
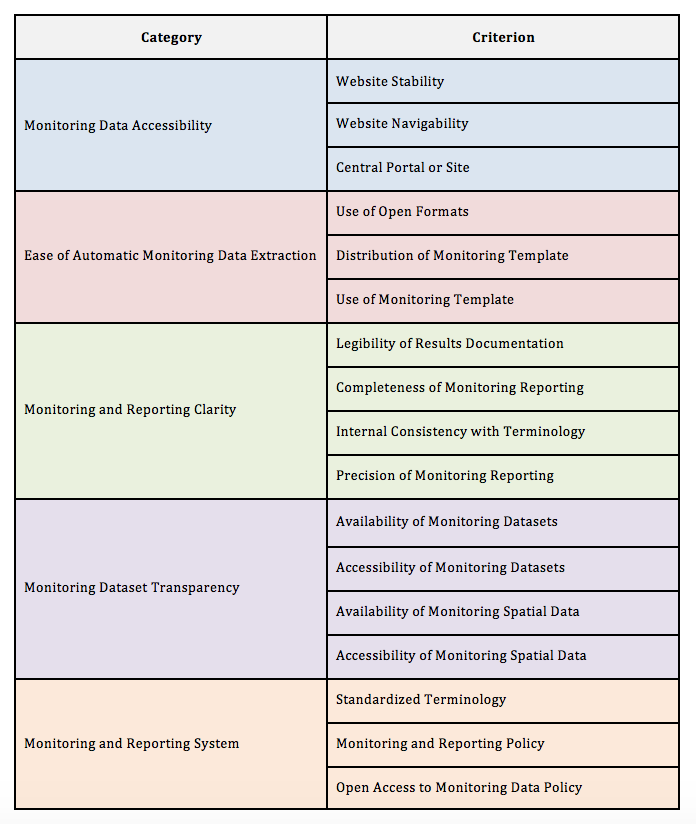
Monitoring Data Accessibility: The ability of the public to access project documentation containing monitoring data. Monitoring data, also referred to as “outputs,” or “project level data,” are the quantifiable goods and services under control of a project or program. Monitoring data accessibility matters because it keeps organizations accountable to the public about project activities.
-
Ease of Automatic Monitoring Data Extraction: Automatic monitoring data extraction involves the computerized scraping of output information from project documentation. The ease of programming an algorithm to scrape output information automatically increases the robustness (i.e. generating maximal amounts of accurate data) and scalability (able to be applied to the greatest number of projects) of the output extraction process. The more robust and scalable the extraction process, the fuller the resulting output database, and the easier it is to draw conclusions about project operations.
-
Monitoring and Reporting Clarity: The clarity and consistency of project documents. Although donors may provide comprehensive project documentation, if documents themselves are unintelligible or do not relate to those of other projects, or constantly redefine terminology, gaining cross-project insights can be limited.
-
Monitoring Dataset Transparency: To what degree tabular output information (i.e. spreadsheets) is available and accessible and includes spatial information.
- Monitoring and Reporting System: The policies, frameworks, and toolkits for the monitoring and reporting of project-level information. These systems matter because they promote a collective understanding of the importance of output reporting across all projects and promote cultures of rigorous monitoring and learning within a development organization itself. The existence of output reporting system frameworks and plans is typically a precursor to the development of more specific tools project managers can use to report outputs.
In turn, each category is comprised of three to four specific criteria, or indicators. Each criterion is scored on a scale of 0-4 and assigned a weight. Specific definitions for all criteria will be the subject of a future blog post. From these criterion scores, we calculated a weighted category sub-score. These category sub-scores are then evenly weighted and averaged to form an overall score. The maximum possible overall score is 4. Below is a summary of our five categories and their associated criteria.
Table 1: It’s not Magic, It’s Math! An Overview of our Data Score-cery.
The Scoring Process
Having settled on our criteria, we moved on to scoring each of 16 development partners. We began by visiting the data/ documentation website for each and downloading all available project documentation for health and agriculture projects in Ghana, Tanzania, and Sri Lanka (years 2000-2015).
We then scraped output information from this documentation and compiled it into a centralized database. Indicators were meant to represent each stage of the process. Website stability, for example, was important for the consistency of data and/ or documentation downloads while standardized terminology was important for evaluating whether projects using similar language had consistent definitions for outputs and other project activities.
Monitoring and Evaluating our own Selves: Lessons Learned
The scorecard is a living process and through our team conversations and preliminary scorecard-oriented discussions with select donors, we have identified ways to improve our scoring methodology. We extend our gratitude for this feedback, and are excited to implement these improvements on future rounds of scoring. Specific areas for improvement that we have already identified include:
- Including project data from additional countries and sectors
- Including indicators to assess the quality of outcome tracking (outcomes being defined as the conditions or attributes of project locations and beneficiaries)
- Quality checking the scores through double-blind scoring by independent reviewers
- Further quality checks on documentation scraping by additional independent reviewers
And that’s not all! Stay tuned for our next scorecard post where we’ll take a deeper dive into the metrics presented above (see Table 1), how individual organizations scored against these methodological criteria, and what kinds of tailored recommendations we were able to make to help improve data systems, platforms, and policies.
Share This Post
Related from our library

Harnessing the Power of Data: Tackling Tobacco Industry Influence in Africa
Reliable, accessible data is essential for effective tobacco control, enabling policymakers to implement stronger, evidence-based responses to evolving industry tactics and public health challenges. This blog explores how Tobacco Industry strategies hinder effective Tobacco control in Africa, and highlights how stakeholders are harnessing TCDI Data to counter industry interference.

Beyond Kigali: Where Does Africa Go from Here with AI?
As the AI momentum builds, Development Gateway is asking different questions: where the data comes from, how reliable it is, how legacy systems will supply usable data, and whether governments have the capacity to govern and trust the AI tools they’re being urged to adopt.

Building a Sustainable Cashew Sector in West Africa Through Data and Collaboration
Cashew-IN project came to an end in August 2024 after four years of working with government agencies, producers, traders, processors, and development partners in the five implementing countries to co-create an online tool aimed to inform, support, promote, and strengthen Africa’s cashew industry. This blog outlines some of the key project highlights, including some of the challenges we faced, lessons learned, success stories, and identified opportunities for a more competitive cashew sector in West Africa.