Scraping By: What It Takes To Find and Use Donor Results Data
A key component of DG’s Results Data Initiative (RDI) is finding innovative ways to compare results data across donors and geographies. In order to support DG’s successes in crosswalking data and conducting qualitative field assessments, has created new approaches to find, extract and relate results data from different development organizations. But finding – much less exporting and using – results data from across the development community is no easy task. For example, consider Publish What You Fund’s (PWYF) rigorous cross-donor analysis of transparent funding, the Aid Transparency Index (ATI). In its most recent report, PWYF found that only 15 of 68 included donors excel in transparent reporting, whereas over a half rank in the “Poor” and “Very Poor” categories. PWYF notes significant challenges in transparent reporting, with major barriers to overcome in consistent publication of activity-level and results information; only 6 organizations scored above 80% for cohesive results data reporting.
Donors across the board, from World Bank to USAID, recognize that M&E should be a vital tool for improving operations and staying faithful to mission statements. The ability of a donor to track progress and recalibrate efforts to be responsive to local needs starts with the collection and dissemination of robust and accurate project-level data. And many donors are working to make this results information more transparent and accessible to external users.
Still, there are major opportunities for donors to improve the consistency and quality of their results data reporting. Our work highlights the challenges that keep data users from easily obtaining and using information about donor results. Here, we will highlight the key challenges we have overcome in our efforts to extract and relate results data, as well as provide examples of promising practices that reporting organizations should adopt and improve on.
I: Key data are unavailable to the public
To crosswalk results across organizations, we search through project documentation to find information about quantitative outputs. A primary challenge with this scraping process is that critical documents and data are often missing or unavailable publicly. Of our sample of 395 Health and Agriculture projects in Ghana, for example, 88 (22%) were missing project documentation of any sort, and 222 (56%) were missing output-oriented documentation. The availability of project and documents varies widely across donors, but a recurring trend we have seen is that within organizations, data openness and publication policies are unclear or inconsistent.
The World Bank stands out as a promising organization for its documented commitment to data openness. In addition to explicitly laying out its policy on access to information, the World Bank also maintains several publically accessible data portals, including the World DataBank and Microdata Library. Opening up its enormous repertoire of data to the public is an excellent strategy to promote institution-wide accountability and transparency, and may also result in the innovative use of public data by stakeholders across sectors. As a consequence of its data openness policy, World Bank scores highest on output availability: 23% of all projects boast publicly accessible output data.
DFATD scores second highest, with 17% of all projects containing output information. Unlike World Bank, however, DFATD does not report its information in through a central portal of project documents. Instead, DFATD publishes basic project information like funds allocated and start and end dates and output and outcome information directly onto individual project pages through the Global Affairs Canada website. Though the contained information can be downloaded in CSV or XML formats, this reporting scheme isn’t as desirable as the structured, semi-standardized forms provided by World Bank because their heavy formatting and largely qualitative nature do not lend themselves to automated scraping. An example of a typical DFATD project page is below.
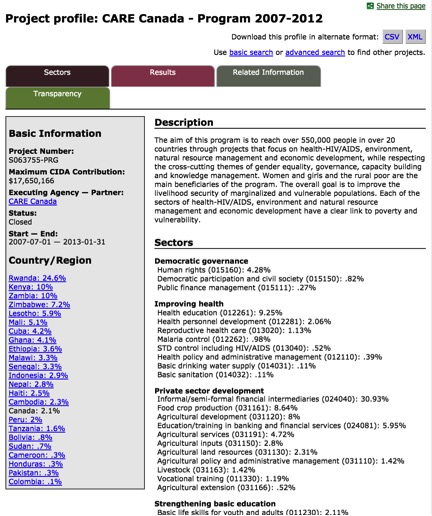
Figure 1: DFATD Project Page
II: Data are not available in open formats
Even organizations that do commit to publicly release performance data often do not offer these data in open (free, public, machine readable) formats. Open data allow citizens to access and analyze data in an unrestricted fashion. The innovative use and reuse of open data can spark innovation in both the public and private sectors. The White House estimates that the value of innovative reuse of GPS data, for example, exceeds $90 billion USD annually. This universalization of information promotes transparency and accountability, and encourages the reuse of these data across the public, private, and nonprofit sectors.
DFID is a great example of an organization dedicated to open data formatting. In 2012, it officially declared its commitment to open data in an Open Data Strategy, which includes a pledge to enter project data into the IATI Registry, a global database of aid transparency information from nearly 400 publishers. DFID now offers project documentation in open formats, including project descriptions in .odt.
III: Donors don’t use standardized report templates
Our analysis of both open and non-open project documentation is complicated by the absence of standardized report formats. Our data analysts are able to construct systematic and replicable data scrapes for donors that have an internally standardized system, avoiding the time and resource drain that comes from manually pulling data from documents not standardized at the organizational level. Complicating the matter further, as discussed in Section I, some organizations that do have standardized report forms don’t always make the completed documents available to the public.
In tandem with our manual scraping efforts, the team is hard at work developing a series of machine learning scraping algorithms. The potential of these algorithms is enormous: the ability to accurately scrape information from projects completed across the world in a fraction of the time it would take to do so manually. Project documentation released in standardized formats would enable these algorithms to function optimally.
UNDP does an excellent job of standardized reporting through offering project managers a set of project documentation templates, including one for annual work plans and another for results frameworks. As shown below, the annual work plan for the Community Resilience Through Early Warning (Crew) project clearly and systematically reports activities and sub activities and their corresponding expenditures. Due to agency-wide use of these standardized formats, UNDP annual work plans would be a prime candidate for scraping with a data-mining algorithm.
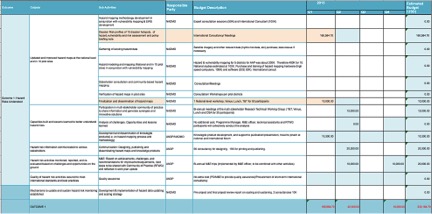
Figure 2: Documenting Excellence: UNDP Structured Documentation
While we applaud any organization that makes their project documentation available to the public, we find particularly challenging the methods certain organizations employ to release these data. Across organizations, we have seen instances in which even recent project documents are partially or completely illegible. Take, for instance, this standardized form employed to track outcome targets and projects. Though the form likely began as a “best practices” example—a standardized, open format spreadsheet that clearly linked achieved outputs to targets—over the course of the project cycle, it was printed, scanned, converted into an image file, and then size reduced. The result is a low-resolution, unscrapeable, and almost completely illegible file. As a result, we were unable to enter this project’s information into our database for further analysis, in spite of the fact that robust data for the project does exist.
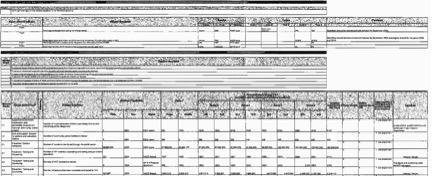
Figure 3: When Good Data Go Bad
Though our body of total project documentation is vast, our sample size of quality documents remains low. Here, we define “quality” as public, free, machine-readable (or at least relatively easily convertible), standardized datasets and forms that clearly quantify numeric outputs. A summary of the project documentation we have collected for health and agriculture projects in Ghana is below. Providing quality data can only help organizations track progress and increase accountability and transparency in the short term, and generate deeper, most sustainable outcomes in the long term. Specific benefits of improving M&E systems include: uniting teams around a shared vision; creating an environment of knowledge sharing; guiding project and program strategy; efficiently allocating resources; engaging local stakeholders; increasing responsiveness to local needs; learning from project setbacks and successes; recognizing and fixing flawed systems; and meeting project targets and milestones on time. Given the massive internal and external benefits of opening data, we encourage all donors to take steps to reform their data management systems and release quality, robust output information for all their projects.
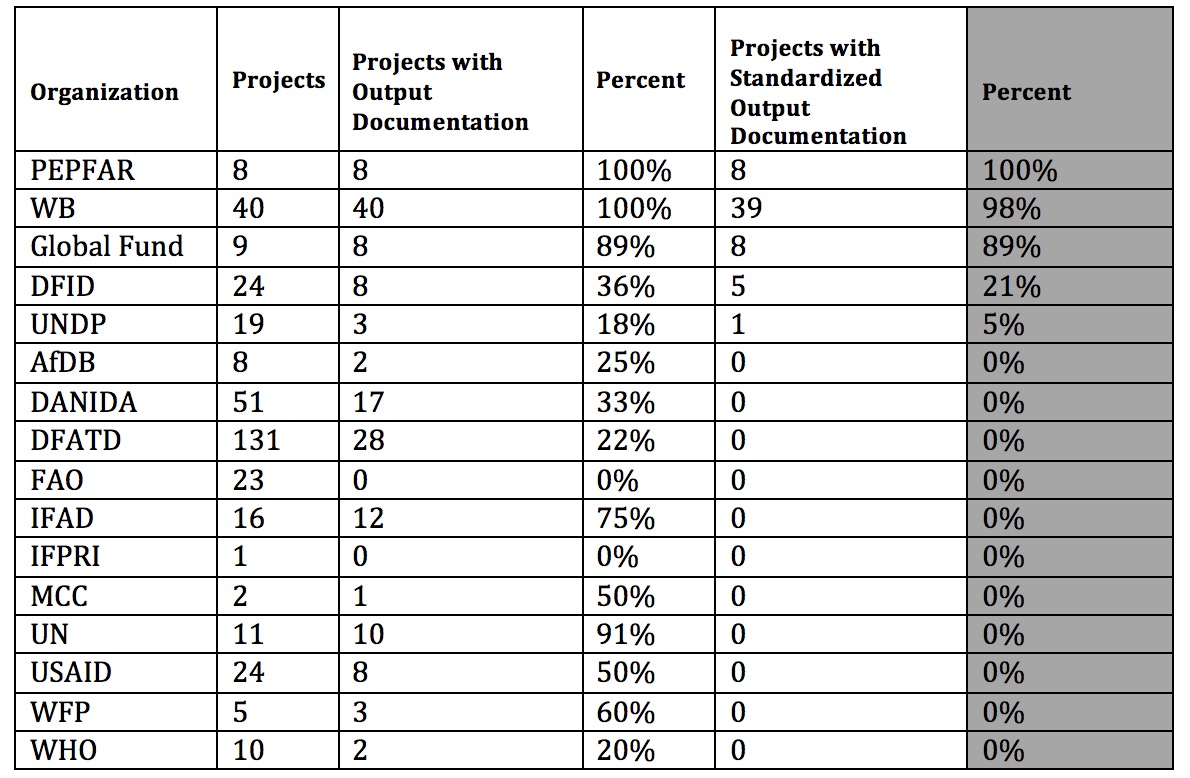
Figure 4: Cross Organizational Comparison of Quality Reporting
Next Steps: (Out)putting Your Money Where Your Mouth Is
Most donors recognize that the benefits of democratizing data access are colossal. In spite of this, no donor in our sample provides consistent and robust project-level data. The challenges our team has faced in extracting output data from project documents highlights just how much opportunity there is for donors to improve the quality of their monitoring systems. Fortunately, the commitments many donors have made to open their data have illuminated concrete steps that organizations can take to improve the quality of their reporting schema. DG is hard at work synthesizing these “most promising practices” into a “0-to-data” toolkit. Though this toolkit will be the subject of a separate post, we conclude by offering a list of 5 steps that development organizations can take right now to improve their reporting.
- Publicly release organization-wide M&E standards and frameworks
- Adopt standard definitions of terms like “outputs” and “outcomes” and clearly designate tracking and reporting norms, including who monitors and reports data, how they do so, and when in the project cycle milestones must be met
- Provide project management teams with reporting toolkits including templates, and checklists
- Upload all project documents and datasets into a publicly searchable portal
- Consider the ways project documents can begin to incorporate quantifiable measures and, ideally, spatial data
Share This Post
Related from our library

Beyond Kigali: Where Does Africa Go from Here with AI?
As governments, funders, entrepreneurs, and technology leaders rally around the AI moment and move towards actions, at Development Gateway, we are asking a different set of questions: Where is the data, and what is the quality of the data behind the algorithms? How will legacy government systems feed AI tools with fresh and usable data? Are Government ministries resourced to govern and trust the AI tools that they are being encouraged to adopt?

Building a Sustainable Cashew Sector in West Africa Through Data and Collaboration
Cashew-IN project came to an end in August 2024 after four years of working with government agencies, producers, traders, processors, and development partners in the five implementing countries to co-create an online tool aimed to inform, support, promote, and strengthen Africa’s cashew industry. This blog outlines some of the key project highlights, including some of the challenges we faced, lessons learned, success stories, and identified opportunities for a more competitive cashew sector in West Africa.
Digital Transformation for Public Value: Development Gateway’s Insights from Agriculture & Open Contracting
In today’s fast-evolving world, governments and public organizations are under more pressure than ever before to deliver efficient, transparent services that align with public expectations. In this blog, we delve into the key concepts behind digital transformation and how it can enhance public value by promoting transparency, informing policy, and supporting evidence-based decision-making.