Steps towards crosswalking development data
In today’s development sphere, donors and local governments gather increasingly large amounts of data. Open data initiatives have made more of this data accessible than ever before, but accessibility doesn’t necessarily translate to comparability or usability.
Can this data be merged or aggregated – crosswalked – to provide a more comprehensive view of a sector or location?
In an attempt to answer this question, the Results Data Initiative endeavors to harmonize results information across donors and governments. We’ve broken the RDI’s “crosswalking” exercise into three main steps: data gathering and organization, data comparing and merging, and data analysis. We’re also keeping to the RDI’s overall project scope countries (Ghana, Tanzania, and Sri Lanka), and development sectors (health and agriculture).
The first part of the crosswalk process – gathering and organizing – is to simply get all the data in one place. For example, in the case of Ghana we want to have a list of all health-related projects and other data sources, such as censuses or surveys. Once cataloged, this will allow us to request specific information from relevant data managers. Each part of this process helps support a different goal of the crosswalk. The microdata itself – which will be compared across organizations – is obviously important, but other information is also critical. Project evaluations, for instance, can help us tie microdata indicators to development outcomes – i.e., which indicators in particular led to decreases in overall poverty?
Once all of the data is in one place, we can move to the second step – comparing and merging indicators across organizations. Are both the World Bank and USAID measuring HIV/AIDS outbreaks? Do both WHO and IFAD record crop yields? To answer these questions, we use several matching algorithms. These algorithms are basically search functions – they identify an indicator, say “Number of premature births,” and search through each organization to see who has recorded a similar measure. Like-measures are tagged as such.
After these algorithms run, we will have our list of “crosswalkable” indicators based on these tags – i.e., duplicate or directly-comparable variables between organizations. We then go through this list and record what we call “variable translation” information – what is needed for the numbers themselves to be comparable (e.g., ensure they are all of the same scale, distribution, type of statistic, etc.). Once variable translation information is added our goal is to make this database ready to accept user queries. For example, say we’re looking for “HIV/AIDS data for Ghana since 2000” – the output of this search would be a spreadsheet that aggregates HIV/AIDS information across all organizations with projects in Ghana. This is demonstrated in the following figure.
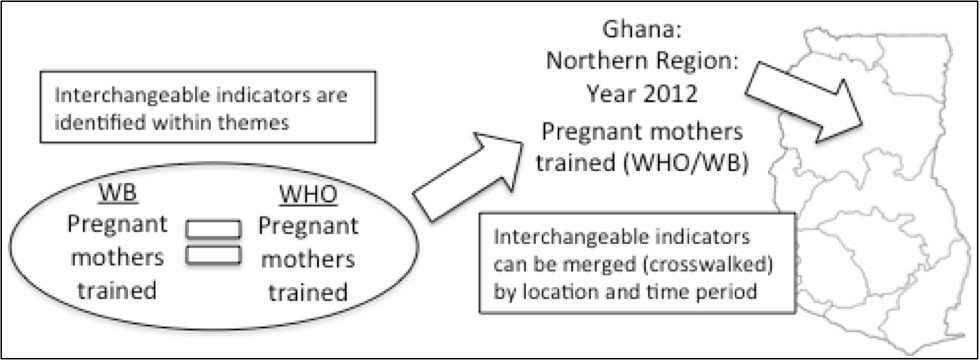
The crosswalking process
Having this searchable microdata database is a significant step forward, especially from a user perspective. Data can be aggregated and reported to administrators or used by local level workers to see project history and current developments in a given area. However, the process as we’ve described so far is still simply a data organization and reporting tool. We haven’t yet engaged with the second piece of the crosswalk: results. Are donors producing comparable results with their projects? Are they interested in similar long-term outcomes? How do they compare in measuring and reporting on these outcomes? These questions are just as important for the Results Data Initiative and will be the subject of our next “crosswalk methodologies” blog post. Stay tuned!
Image from James Clarke CC BY-NC-ND 2.0
Share This Post
Related from our library

Harnessing the Power of Data: Tackling Tobacco Industry Influence in Africa
Reliable, accessible data is essential for effective tobacco control, enabling policymakers to implement stronger, evidence-based responses to evolving industry tactics and public health challenges. This blog explores how Tobacco Industry strategies hinder effective Tobacco control in Africa, and highlights how stakeholders are harnessing TCDI Data to counter industry interference.

Building a Sustainable Cashew Sector in West Africa Through Data and Collaboration
Cashew-IN project came to an end in August 2024 after four years of working with government agencies, producers, traders, processors, and development partners in the five implementing countries to co-create an online tool aimed to inform, support, promote, and strengthen Africa’s cashew industry. This blog outlines some of the key project highlights, including some of the challenges we faced, lessons learned, success stories, and identified opportunities for a more competitive cashew sector in West Africa.
Digital Transformation for Public Value: Development Gateway’s Insights from Agriculture & Open Contracting
In today’s fast-evolving world, governments and public organizations are under more pressure than ever before to deliver efficient, transparent services that align with public expectations. In this blog, we delve into the key concepts behind digital transformation and how it can enhance public value by promoting transparency, informing policy, and supporting evidence-based decision-making.