Tackling Development Challenges with Data Visualization
“Tech@State: Data Visualization” took place on Sept. 23, 2011 at the Kennedy Center in Washington, DC. The event was organized by the U.S. Department of State, Development Gateway, AidData and the Global Facility for Disaster Reduction and Recovery. The conference presented speakers, panelists and guests with the opportunity to explore new and innovative data visualization techniques, and their applications for international development research and practice.
The event featured Edward Tufte of Yale University as a keynote speaker. Tufte discussed his “sparkline theory” and offered insights on how to make the use of data visualizations and graphics available for a mainstream audience. He encouraged a scientific and more critical approach to the use of data. “The purpose of an information display is to assist reasoning and thinking about information and evidence. It’s all about the content and the intellectual activities of the user,” Tufte stated, referencing the link between information support and analytical thinking. The challenge, according to Tufte, is to align data design principles with the principles of analytical thinking.
Jean-Louis Sarbib, the CEO of Development Gateway, moderated the plenary session entitled “Development Challenge: Open Data to Making Sense of Data” (photo). The discussion aimed to address the topics of newly available government data and its impact on governance, the role of data visualization in development assistance, the impact of transparency on the distribution of development resources, and the democratization of development. The panel featured Charles Kenny of the Center for Global Development, Stuart Gill of the Global Facility for Disaster Reduction and Recovery, and Aleem Walji of the World Bank Institute. A key message from the panelists was that better presentation of development data would make the general public in wealthy countries more supportive of aid policies. The role of innovation in making data available was another key theme of the discussion. Mr. Walji cited the Apps for Development Competition as an example of a successful effort by the World Bank to foster the use of its data by stakeholders around the world. “What we are now understanding is how to pick what you do well and how to let the world do what it does well,” Walji explained.
Other panel discussions addressed a variety of topics ranging from “The Latest Trends in Data Visualization” to “The Role of Data in Supporting Disaster Response” to “The Use of Mobile Technology and New Media.” The conference presented an exceptional opportunity for the presenters and attendees to engage in discussions on these and other topics. The main event was followed by an “unconference” on Sept. 24 at the Microsoft Innovation Policy Center, where participants continued to exchange ideas in an informal setting.
The two day event was made possible through support from the Global Facility for Disaster Reduction and Recovery (GFDRR), Fitzgerald Analytics, Esri, Microsoft, and MetroStar Systems. It is part of a series of Tech@State events, which bring together leaders, innovators, government personnel and others to collaborate on 21st century technology solutions to improve the education, health and welfare of the world’s population.
A recording of the first day of the conference is available online:
Share This Post
Related from our library

The Future of Technology Governance and Global Development: Why DG Brought DataReady In-house
DG is excited to announce we now have more robust data governance advisory services with the recent integration of DataReady.

Letting the Sunshine in: Building Inclusive, Accountable, and Equitable Climate Finance Ecosystems
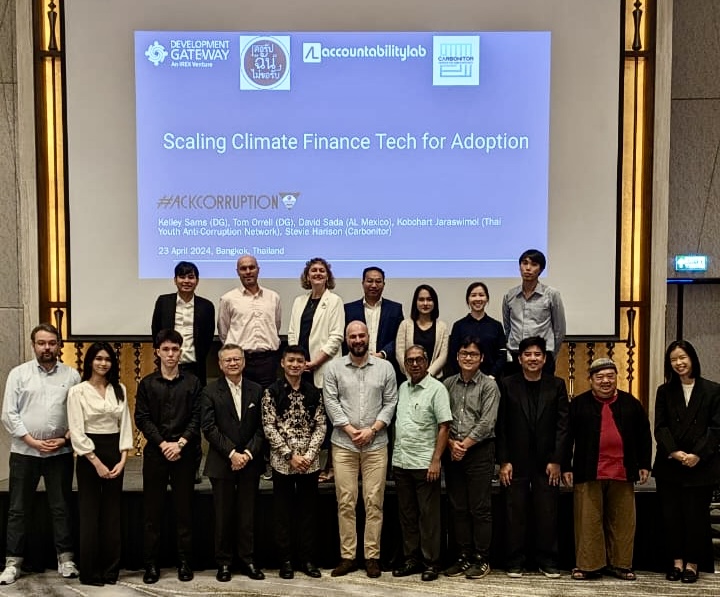
In April, DG, HackCorruption, and the Thai Youth Anti-Corruption Network hosted a roundtable in Bangkok to discuss climate financing. This blog explores the main takeaway: a multi-disciplinary and multi-stakeholder approach that prioritizes local contexts, inclusive governance, transparency, accountability, and equitable distribution of resources is essential to impactful climate financing.

Developing Data Systems: Five Issues IREX and DG Explored at Festival de Datos
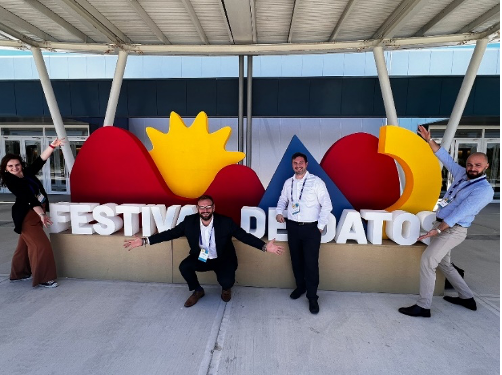
IREX and Development Gateway: An IREX Venture participated in Festival de Datos from November 7-9, 2023. In this blog, Philip Davidovich, Annie Kilroy, Josh Powell, and Tom Orrell explore five key issues discussed at Festival de Datos on advancing data systems and how IREX and DG are meeting these challenges.