The Results Data Scorecard: A glimpse at the importance and accessibility of results data
A key component of the Results Data Initiative (RDI) was the development of the Results Data Scorecard, a mechanism for assessing how development organizations gather and publish results information. Improving how DPs track and report results has the potential to reduce duplication of efforts and improve programming effectiveness – critical if we are to meet the SDGs.
So how accessible and useful are development partners’ results data? Not very: the most common source for results information is project documentation, oftentimes in PDF format. But based on our analysis, neither the PDF formats, nor differences across organizational templates, are major barriers to crosswalking results data. In fact, we were able to get the data through scraping and data algorithms. Rather, the key barrier to useful results data has to do with varying levels of data openness and completeness. By making improvements to existing internal reporting templates, development partners can make their information more accessible and comparable.
And that’s where the scorecard comes in. Our Scorecard – accessible at the bottom of the RDI data visualization page – assesses the quality of DP monitoring systems across five categories, and generates a composite score per organization.
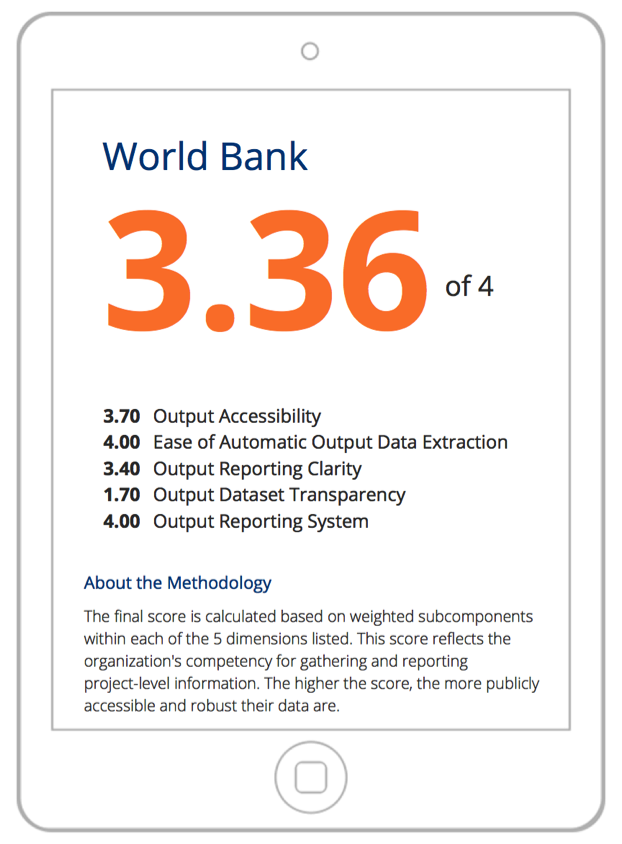
Figure 1: World Bank’s Scorecard
The scores are based on a subset (not a complete sample) of results data sources from each DP. All sub-scores and the composite score are rated on a scale of 0-4, with 4 being the highest possible score; we’ll delve into the specifics of what each category means and the criteria (submetrics) that figure into the calculation in our next post. The goal of this Scorecard is not to name and shame DPs. Rather, we aim to illuminate ways in which existing M&E data, systems, and tools can be improved, to help DPs reach the goals they set for themselves.
To begin these conversations, we are using the results of our analysis to craft tailored recommendations on a DP-by-DP basis. Below is just a brief preview of a few recommendations we have included in our donor-specific Scorecard reports. We will present and discuss these in more depth in later posts.
Table 1: Sample Scorecard Recommendations
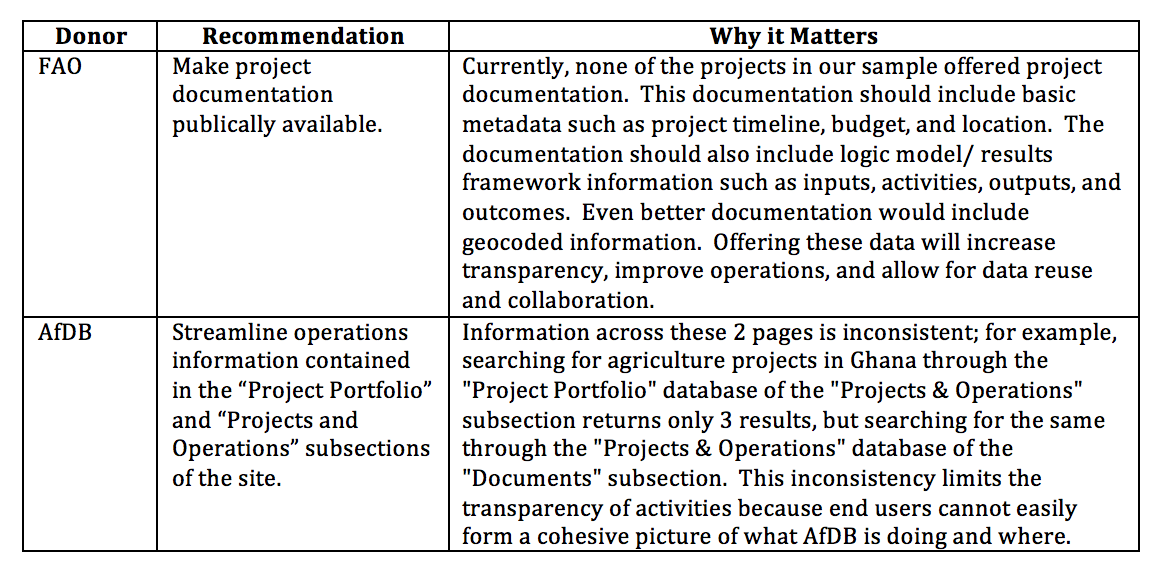
Table 1: Sample Scorecard Recommendations
While we continue our conversations with donors about our findings from the Scorecard exercise, readers can look forward to four upcoming posts that will provide deeper insight into our methodology, metrics, findings, and recommendations. We hope that series of posts will encourage development stakeholders to consider how revamping M&E and data systems can lead to cost savings, improved outcomes, and heightened accountability and transparency – stay tuned!
Share This Post
Related from our library

Harnessing the Power of Data: Tackling Tobacco Industry Influence in Africa
Reliable, accessible data is essential for effective tobacco control, enabling policymakers to implement stronger, evidence-based responses to evolving industry tactics and public health challenges. This blog explores how Tobacco Industry strategies hinder effective Tobacco control in Africa, and highlights how stakeholders are harnessing TCDI Data to counter industry interference.

Beyond Kigali: Where Does Africa Go from Here with AI?
As the AI momentum builds, Development Gateway is asking different questions: where the data comes from, how reliable it is, how legacy systems will supply usable data, and whether governments have the capacity to govern and trust the AI tools they’re being urged to adopt.

Building a Sustainable Cashew Sector in West Africa Through Data and Collaboration
Cashew-IN project came to an end in August 2024 after four years of working with government agencies, producers, traders, processors, and development partners in the five implementing countries to co-create an online tool aimed to inform, support, promote, and strengthen Africa’s cashew industry. This blog outlines some of the key project highlights, including some of the challenges we faced, lessons learned, success stories, and identified opportunities for a more competitive cashew sector in West Africa.