Unlocking Development Results Data
Over the past year, our Results Data Initiative (RDI) has explored in depth two important links in the development data “results chain”: outputs (what development organizations implement, track, and monitor) and outcomes (the conditions of a community or area of influence). While development organizations and governments gather reams of output and outcome information, it’s been nearly impossible to compare this data across organizations – until now.
Currently in beta, the portal applies a standardized methodology (blog post forthcoming) for aggregating results information – with the goal of facilitating learning for better allocation decisions and program effectiveness. For example: when UNICEF plans to distribute textbooks to children in eastern Tanzania, it should be able to easily access data on what other donors have achieved, to avoid pitfalls and iterate on what works.
In particular, the RDI Data Visualization Portal seeks to respond to three big-picture questions:
1. How can output data be aggregated and compared across organizations?
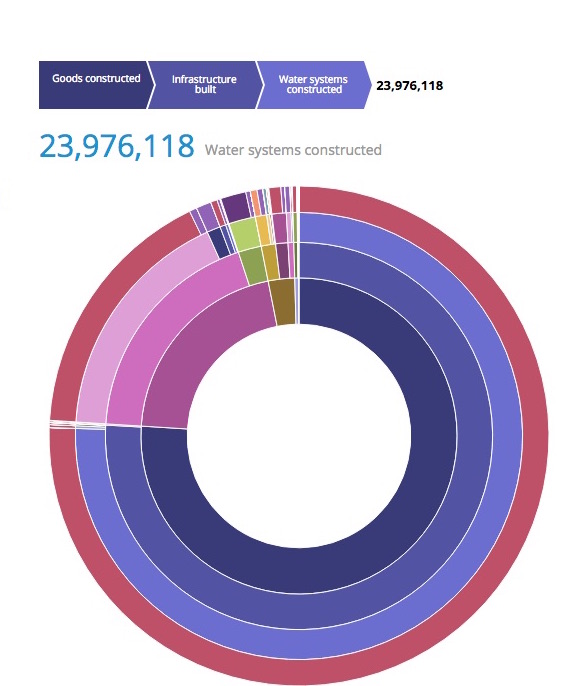
The portal’s first chart shows our “crosswalk” methodology in action. By clustering output data in this way, we have a preview of who is accomplishing what in health and agriculture sectors, across Tanzania, Ghana, and Sri Lanka.
Importantly, this chart only shows publicly-accessible data – but it lays the groundwork for a potentially powerful database of aggregated results, provided that development partners dedicate themselves to consistently publishing results information.
2. Where does outcome data come from?
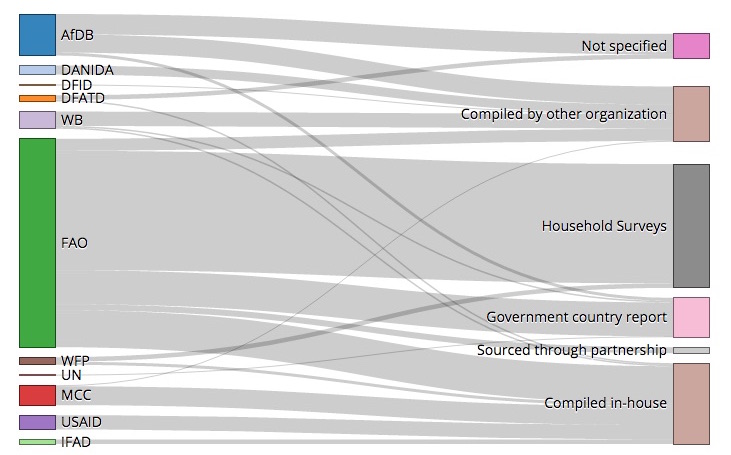
Every development organization curates its own list of priority outcome indicators – but where does the metadata come from? The portal’s second chart “maps” development organizations’ indicators back to their source.
Initially, our goal was to “crosswalk” indicators from different agencies. However, further research on results data suggests it would be more productive to identify underlying data sources, since coordinating efforts to improve the collection of indicator data – by increasing the frequency or geographic detail of Demographic and Health Surveys, for example – may be more efficient in the long run than coordinating indicators themselves.
3. How can organizations report (monitoring) results more effectively?
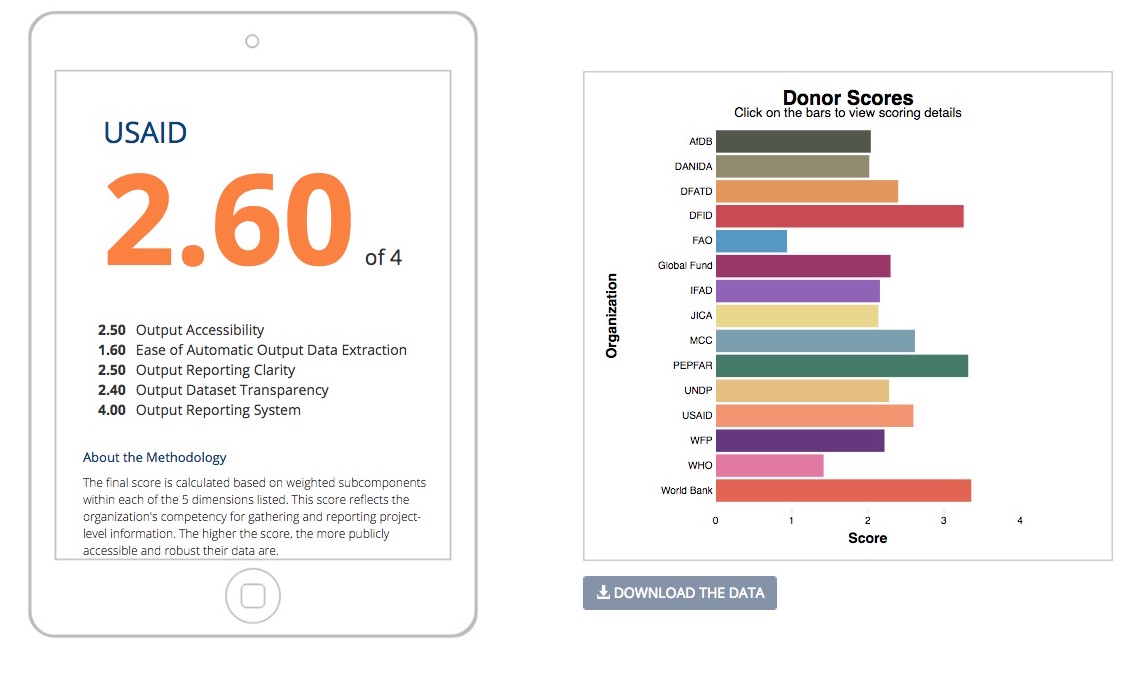
Throughout the past year, we have noted that the accuracy and usefulness of our portal’s crosswalking is dependent on the amount and quality of information provided by donors. To this end, we’ve created a Results Reporting Scorecard that outlines how well organizations gather and publish monitoring data.
The idea here is not to “name and shame” organizations, but instead to provide recommendations to aid in open data priorities. The scorecard outlines the key elements that development partners should have in place, such as standard M&E policies and online project data portals, in order to provide the type of data that makes cross-donor aggregations possible and useful.
We hope readers will explore, find useful insights, and provide feedback on the data; stay tuned for more information on our data crosswalking methodology and country-level findings.
Share This Post
Related from our library

Harnessing the Power of Data: Tackling Tobacco Industry Influence in Africa
Reliable, accessible data is essential for effective tobacco control, enabling policymakers to implement stronger, evidence-based responses to evolving industry tactics and public health challenges. This blog explores how Tobacco Industry strategies hinder effective Tobacco control in Africa, and highlights how stakeholders are harnessing TCDI Data to counter industry interference.

Beyond Kigali: Where Does Africa Go from Here with AI?
As the AI momentum builds, Development Gateway is asking different questions: where the data comes from, how reliable it is, how legacy systems will supply usable data, and whether governments have the capacity to govern and trust the AI tools they’re being urged to adopt.

Building a Sustainable Cashew Sector in West Africa Through Data and Collaboration
Cashew-IN project came to an end in August 2024 after four years of working with government agencies, producers, traders, processors, and development partners in the five implementing countries to co-create an online tool aimed to inform, support, promote, and strengthen Africa’s cashew industry. This blog outlines some of the key project highlights, including some of the challenges we faced, lessons learned, success stories, and identified opportunities for a more competitive cashew sector in West Africa.