Visualizing the Interdependencies between Conflict, Climate Change, and Natural Disasters
How do conflict, climate change, and natural disasters overlap — and how can policymakers mitigate these challenges? The Complex Emergencies and Political Stability in Asia (CEPSA) program is a 3 year project funded by the US Department of Defense that explores the interdependencies of these issues and their impact on Asia. Most importantly, CEPSA also seeks to provide potential strategies to mitigate these challenges. CEPSA is a collaborative research program led by the Robert Strauss Center at the University of Texas-Austin; the Armed Conflict Location and Event Data project; Development Gateway; and the University of California-Berkeley.
One of CEPSA’s core outputs is the Complex Emergencies Dashboard, a public, online geospatial mapping tool designed to visualize trends in disaster vulnerability, climate security, conflict, governance and disaster aid in Asia. The dashboard displays CEPSA-produced datasets for 11 countries in South and Southeast Asia — allowing policymakers, researchers, and NGOs to visualize areas of insecurity overlap. In doing so, these audiences can both prepare for and effectively design responses to complex emergencies.
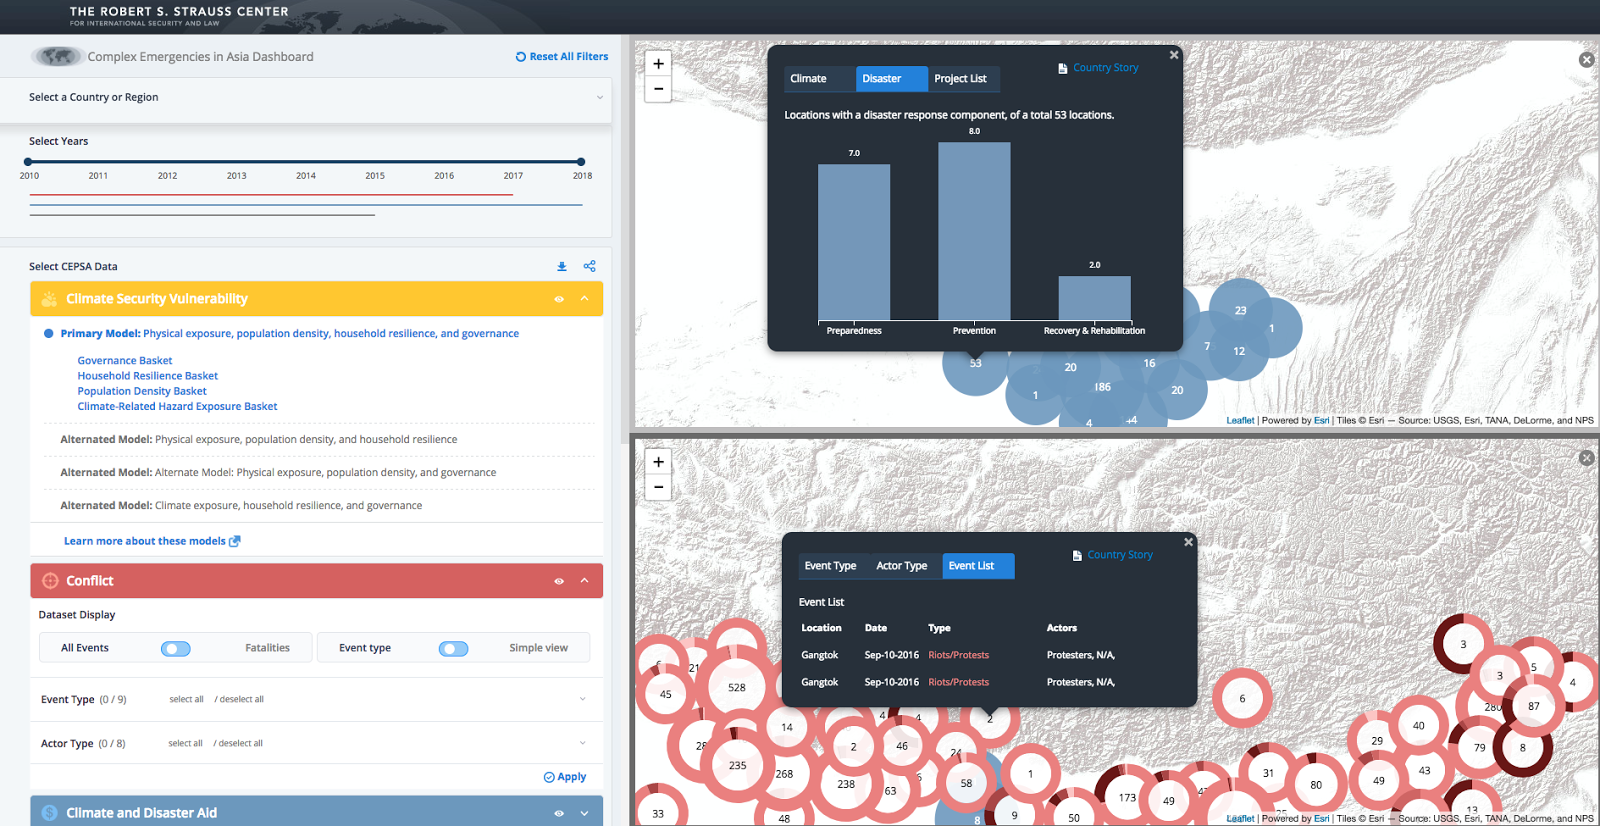
For example, users can examine the current distribution of climate and disaster aid in Bangladesh against areas most vulnerable to disaster. The dashboard also allows users to overlay externally-created geospatial data on terrorism, piracy, etc.
A key goal of the Complex Emergencies Dashboard is to help local and national governments identify communities in need of resilience-related investments. By overlaying information — such as the number of disaster response trainings taking place across India against areas of climate change vulnerability — decision makers better understand whether resource gaps exist, and which interventions would best support resilience building.
Conflict, disasters, and climate change are interdependent challenges across both Asia and the world. We believe that being able to more easily visualize and understand this interplay is an important step for policymakers towards developing holistic action plans and sustainable solutions. The Complex Emergencies Dashboard will be publicly available online in Fall 2017. Until then, be sure to check back for more updates.
Share This Post
Related from our library

A Year After USAID: Reclaiming Control of Data Systems
Just months after the 2025 U.S. aid freeze was announced, we published a blog post warning that the USAID cuts would result in a data crisis, with some countries losing access to their digital health data. This blog explores how those systems – and the countries relying on them – have fared nearly a year on.
Reflecting on 3 Years of Digital Advisory Support for Agricultural Transformation
As the DAS program concludes, this blog reflects on its impact in advancing digital transformation in agriculture, highlighting lessons on capacity building, knowledge transfer, and sustaining resilient food systems.

Introducing The HackCorruption Civic Tech Tools Repository
Introducing the Civic Tech Tools Repository: an open-source hub of digital solutions to fight corruption. Designed for growth through GitHub contributions, it brings together tools, code, and resources across six key areas for HackCorruption teams and beyond.