Where does aid go? Mapping the African Development Bank’s Activities
Last week, the African Development Bank (AfDB) and AidData launched an interactive map showing the precise locations of the AfDB’s ongoing operations in Cameroon, Morocco, and Tanzania. The map allows users to zoom in on each of these countries and explore the Bank’s activities by sector. The maps also display key development indicators, including poverty, malnutrition, and infant mortality rates, by region. This is a good starting point for analysis of where aid is flowing, and where there are gaps.
To create the map, a team of researchers from AidData identified the latitude and longitude of the location(s) where each project is being implemented. They used a geocoding methodology developed jointly by AidData and Uppsala University in Sweden, which can be adapted for use by different types of organizations. After project locations were identified, dynamic maps for the web and mobile devices were created in partnership with Esri.
Share This Post
Related from our library

The Future of Technology Governance and Global Development: Why DG Brought DataReady In-house
DG is excited to announce we now have more robust data governance advisory services with the recent integration of DataReady.
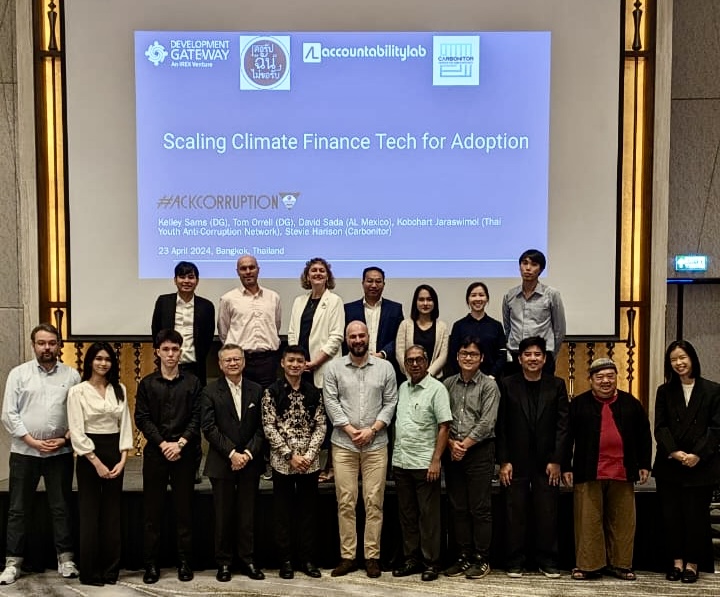
Letting the Sunshine in: Building Inclusive, Accountable, and Equitable Climate Finance Ecosystems
In April, DG, HackCorruption, and the Thai Youth Anti-Corruption Network hosted a roundtable in Bangkok to discuss climate financing. This blog explores the main takeaway: a multi-disciplinary and multi-stakeholder approach that prioritizes local contexts, inclusive governance, transparency, accountability, and equitable distribution of resources is essential to impactful climate financing.
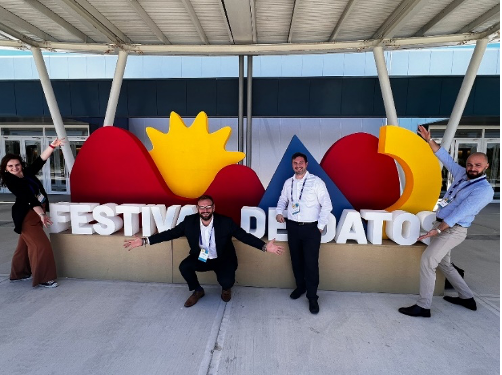
Developing Data Systems: Five Issues IREX and DG Explored at Festival de Datos
IREX and Development Gateway: An IREX Venture participated in Festival de Datos from November 7-9, 2023. In this blog, Philip Davidovich, Annie Kilroy, Josh Powell, and Tom Orrell explore five key issues discussed at Festival de Datos on advancing data systems and how IREX and DG are meeting these challenges.