Mapping the Data Ecosystem & Designing Requirements for Malawi's Agricultural Sector
An under-utilization of M&E data limits the government’s ability to understand what
works and how to allocate resources more effectively. What does it take to design a platform to collect, manage, and analyze a country’s agricultural information?
Through the Results Data Initiative (RDI), DG worked with Malawi’s Ministry of Agriculture, Irrigation and Water Development (MOAIWD) to design a National Agriculture Management Information System (NAMIS). This initiative aimed to improve the administrative and results data systems used in the country’s agriculture sector, by putting users at the center of system design.
Background
The agriculture sector is the largest contributor to economic growth and development in Malawi. It employs over 64 percent of the total national workforce, represents nearly 28 percent of the Malawi’s Gross Domestic Product, and comprises over 75 percent of the country’s foreign exchange. The sector is guided by two key strategic documents: the National Agriculture Policy (NAP, 2016-2020) and the National Irrigation Policy (NIP, 2016-2020). These policies provide a framework of priorities for state and non-state actors implementing agriculture-related activities.
The amount of agriculture data being reported, collected, and visualized is growing exponentially. In Malawi, the government recognized that an M&E management information system could improve the use of data and evidence to support decision-making at sub district, district, and central levels. The existing NAP and M&E framework outlined priority areas for measuring results – however, there was no system for measuring progress against these goals. Without the ability to measure progress, how do we evaluate policy effectiveness?
Outcomes
Rather than a narrow technical assessment centered on designing a generic agricultural monitoring system, DG worked with the Government to complete a detailed landscape analysis first. This analysis focused on understanding the true decision-making needs of a variety of stakeholders at both national and sub-national levels. DG and Government partners worked closely; building consensus and securing buy-in from champions; interviewing over 100 stakeholders; and developing a report that identified the needs of a decision-centered system.
This work is innovative and inventive, for two reasons. Firstly, we explored the intersection between the expectation of agriculture data needs and the realities of agriculture data users – working to ensure data is relevant, useful, and used. Secondly, we used a problem-driven, iterative, and adaptive (PDIA) approach to inform building of a national government information system. In designing the NAMIS, we are guided by a belief that a holistic, needs-based national data system requires two elements: (1) putting future users at the center of system design, and (2) never assuming we know what these users might need.
Exploring User Journeys
The first part of the analysis was to create detailed user journeys that map how different decision-makers obtain and interact with data to inform key decisions within the agricultural ecosystem. The journeys identify which users are mandated to make specific decisions; and which data sources are most useful for achieving their decision making goals. Articulating user journeys helps to ensure that NAMIS includes modules that respond directly to a decision-making need.
Selected User Journeys
As an Agriculture Extension Development Officer for an extension planning area, I need to analyze the Agricultural Production Estimates Survey and obtain information about farmer households. My goal is to connect non-governmental organizations with farmers that could benefit from support services.
As an Agriculture Development District Crops Officer, I need to monitor food security by tracking yield estimates, weather, pests, and diseases. My goal is to identify issue “hot spots” so that I can inform stakeholders and help farmers with mitigation measures, like improving irrigation practices. I can access this information through reports and the Agricultural Production Estimates Survey.
As an Agricultural Development Division Economist, I want to analyze the Agricultural Production Estimates Survey results. My goal is to provide programming guidance to districts about matters like crop production levels. I can access this information through national statistics and routine reports from districts.
As national Deputy Director of Planning, I need to access technical outputs, like project indicators. My goal is to monitor ministry policy implementation and programming. I can access this information through reports prepared by implementing technical departments.
Mapping the Data Ecosystem

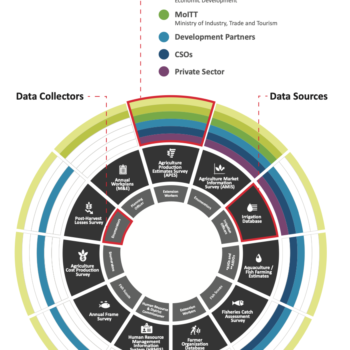
Drawing on the user journeys, we were able to create a detailed data ecosystem map, which provides a comprehensive picture of the Malawi agriculture sector, highlighting which data are gathered and used by which actors. This map helped to identify and prioritize data sources in later phases.
Creating a Framework
After the landscape analysis, user journeys, and ecosystem mapping, we worked with MoAIWD to create a framework and requirements to design a National Agriculture Management Information System (NAMIS). The framework included a list of fourteen distinct system modules. Each module responds to different user needs, as identified through user journeys; and each should incorporate relevant analysis and visualization tools. The proposed system will be used by MoAIWD staff at national and local levels, as well as private sector, non-governmental, and development partner collaborators. Strengthening the collection, management, and use of M&E data can support the achievement of Malawi’s agriculture development goals. NAMIS has the potential to address key stakeholder needs, strengthening users’ abilities to allocate resources more effectively.
MoAIWD has adapted the framework, requirements, and phased development plan created by Development Gateway into a detailed proposal for potential funders.