Catalyzing Use of Gender Data
March is International Women’s History Month. DG is publishing a series of blogs that highlight and honor the work that we and others are doing to support the vital role of women.
Kicking off the series last week in Part 1 of our Gender Data series, we discussed the importance of gender-disaggregated data (GDD) for development and humanitarian programming, and how each kind of gender data can be leveraged to improve programming outcomes for women and girls. But we know from our experience understanding data use that the primary obstacle to measuring and organizational learning from feminist outcomes is that development actors do not always capture gender data systematically.
For example, Global Affairs Canada, International Assistance (GAC-IA) and many others have adopted policies that target gender equality and the empowerment of women and girls – also known as “feminist development.” However, GAC and others have only recently required implementing partners and project officers to report activities and beneficiaries by gender. Gender policy markers and sector codes are new introductions into M&E strategies – so their uptake and standardization has been slow. Last year, DG worked with GAC-IA to develop its Feminist International Assistance Policy (FIAP) M&E work plan using existing data, and worked closely with these indicators. We aimed to establish a clear feminist M&E plan within FIAP’s first year of existence.
Take, for example, GAC-IA’s FIAP indicator on health and nutrition:
Number of people benefitting from gender-sensitive health and nutrition services through GAC projects (linked to SDG 2)
Though the indicator is simple in concept, methodological challenges have prevented organization-wide aggregation of project data. Questions arose about if and how projects were collecting GDD on health and nutritional programming, but also around:
- To what extent do gender-sensitive services need to be a core component of the project? For example, can “education” data coming from a secondary school that provides nutrition information on boys and girls be counted, even if its primary outcome is not health/nutrition based?
- What specific activities constitute “gender-sensitive health or nutrition” services? Do they exclusively include sexual, reproductive, maternal, and newborn and child health or nutrition services, or do other activities qualify?
- To what extent must nutritional/health services be a project focus for that data to be included? For example, if a 3-year education project highlights nutrition for one day, does that project contribute to this indicator?
- What information is documented and reported that would allow identification of these qualifying activities?
Because of these reporting challenges, GAC-IA anticipated that understanding exactly how many women and girls their programs were reaching would be difficult to pin down. However, challenges in extracting data were less anticipated, and prevented GAC-IA from aggregating gender insights across the organization to quantify feminist outcomes.
There are no universally-accepted indicators or codebooks for feminist development. Further, project cycles (design, contracting, and implementation) are often years long. If donors and agencies wait for new programming cycles to begin to start collecting and analyzing gender data, years could pass before solid insights can be drawn.
The question becomes: how do we bridge the gap between theoretical best practice, and more immediate, practical solutions that meet agencies’ current programming and abilities?
Question 1 for Feminist M&E: What Are You Measuring?
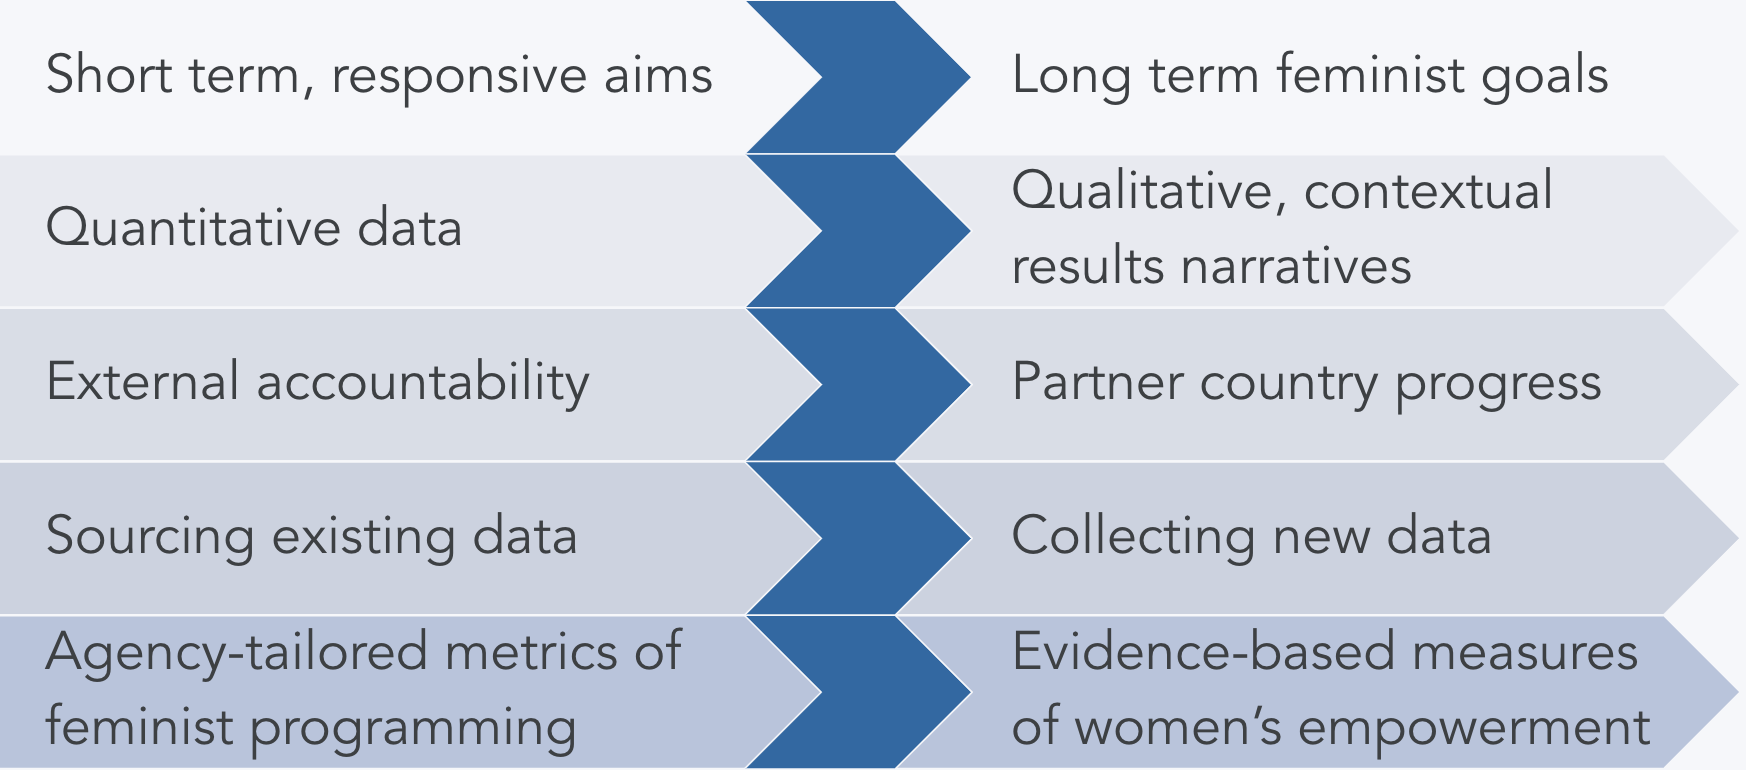
Indicator design involves achieving a balance between which measurements are “ideal,” and which measurements are practical and actionable. To achieve this balance, GAC-IA developed what is known as its “placemat,” a comprehensive results framework with 26 global indicators (derived mostly from SDG indicators) and 24 GAC-specific key performance indicators (derived from project-level M&E data). These key performance indicators were reviewed alongside global metrics, to arrive at an accurate, actionable measure of GAC-IA’S contribution to women’s empowerment.
In developing a framework that is both forward-thinking and responsive to current needs, we worked closely with GAC-IA to identify realistic tradeoffs in design – with the idea that down the road, these tradeoffs would become less and less necessary.
Question 2 for Feminist M&E: How do You Measure Results?
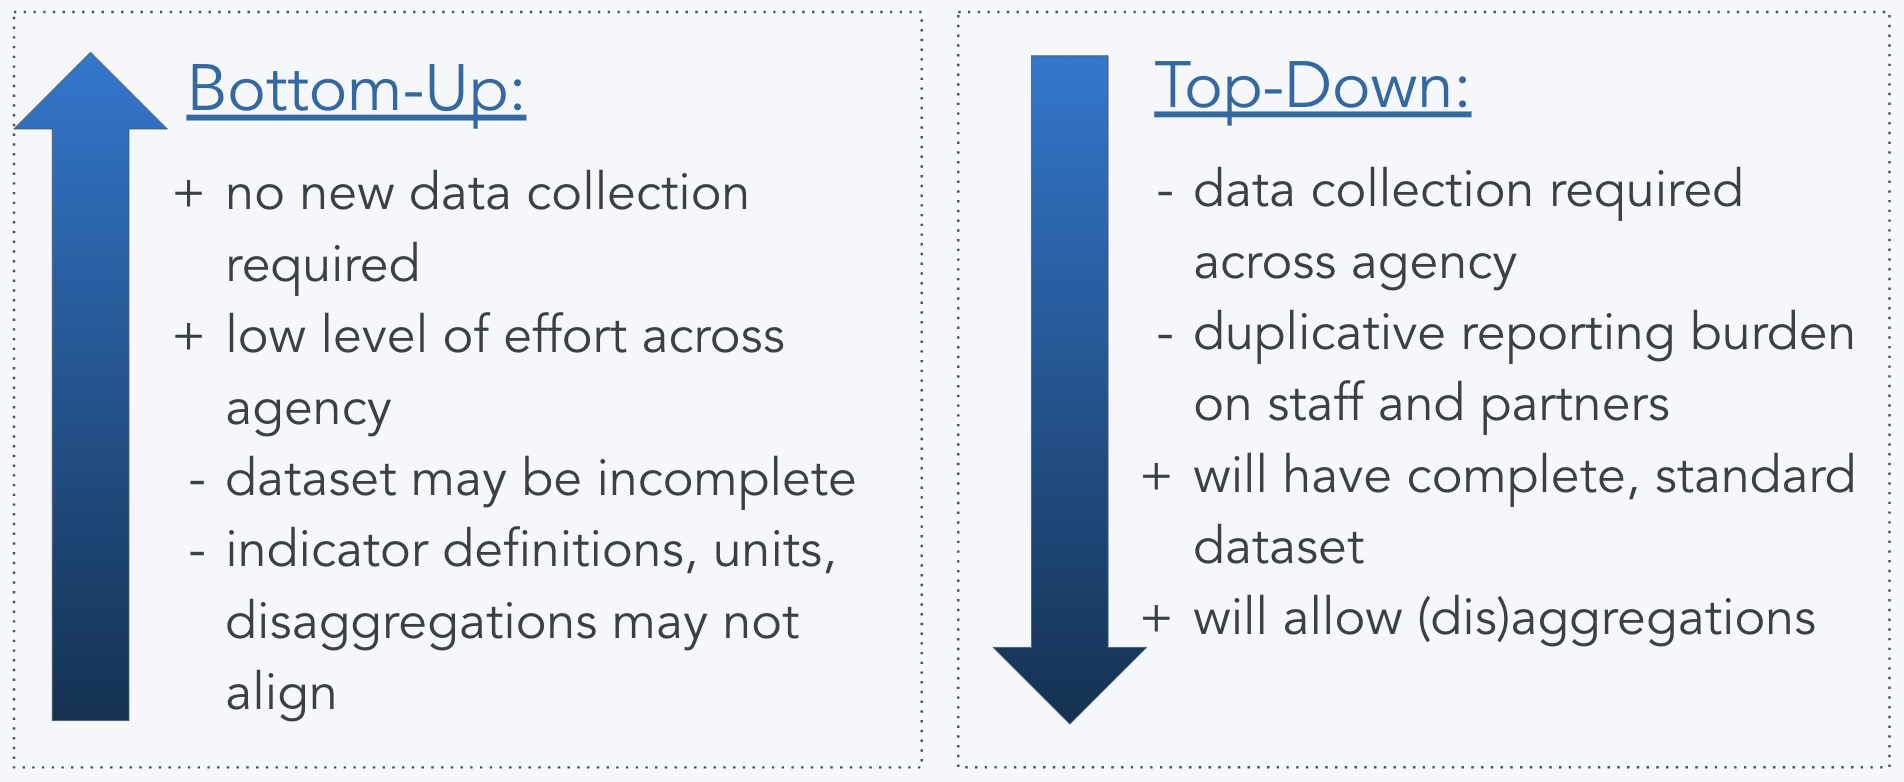
Once you have identified goals and standard definitions for how and where to capture relevant gender data, there are two methods to develop the new indicators:
1. Top-Down: Commission new data collection based exclusively on your new indicators.
2. Bottom-Up: Use existing data in M&E channels and try to fit it into your new indicators.
The costs and benefits of each approach depend on the organization’s data and reporting management structures. For example, using the Top-Down approach may effectively surface the intended data, but requires a significant time and effort investment. With Bottom-Up, the level of effort is more immediately attainable, but the “right” data may be incomplete or not exist.
Case Study: Working with GAC-IA on its Bottom-Up Approach
In line with GAC-IA’s priorities, DG used existing data and the Bottom-Up approach to calculate the baseline. In one example, we fit existing M&E data into one of FIAP’s education indicators:
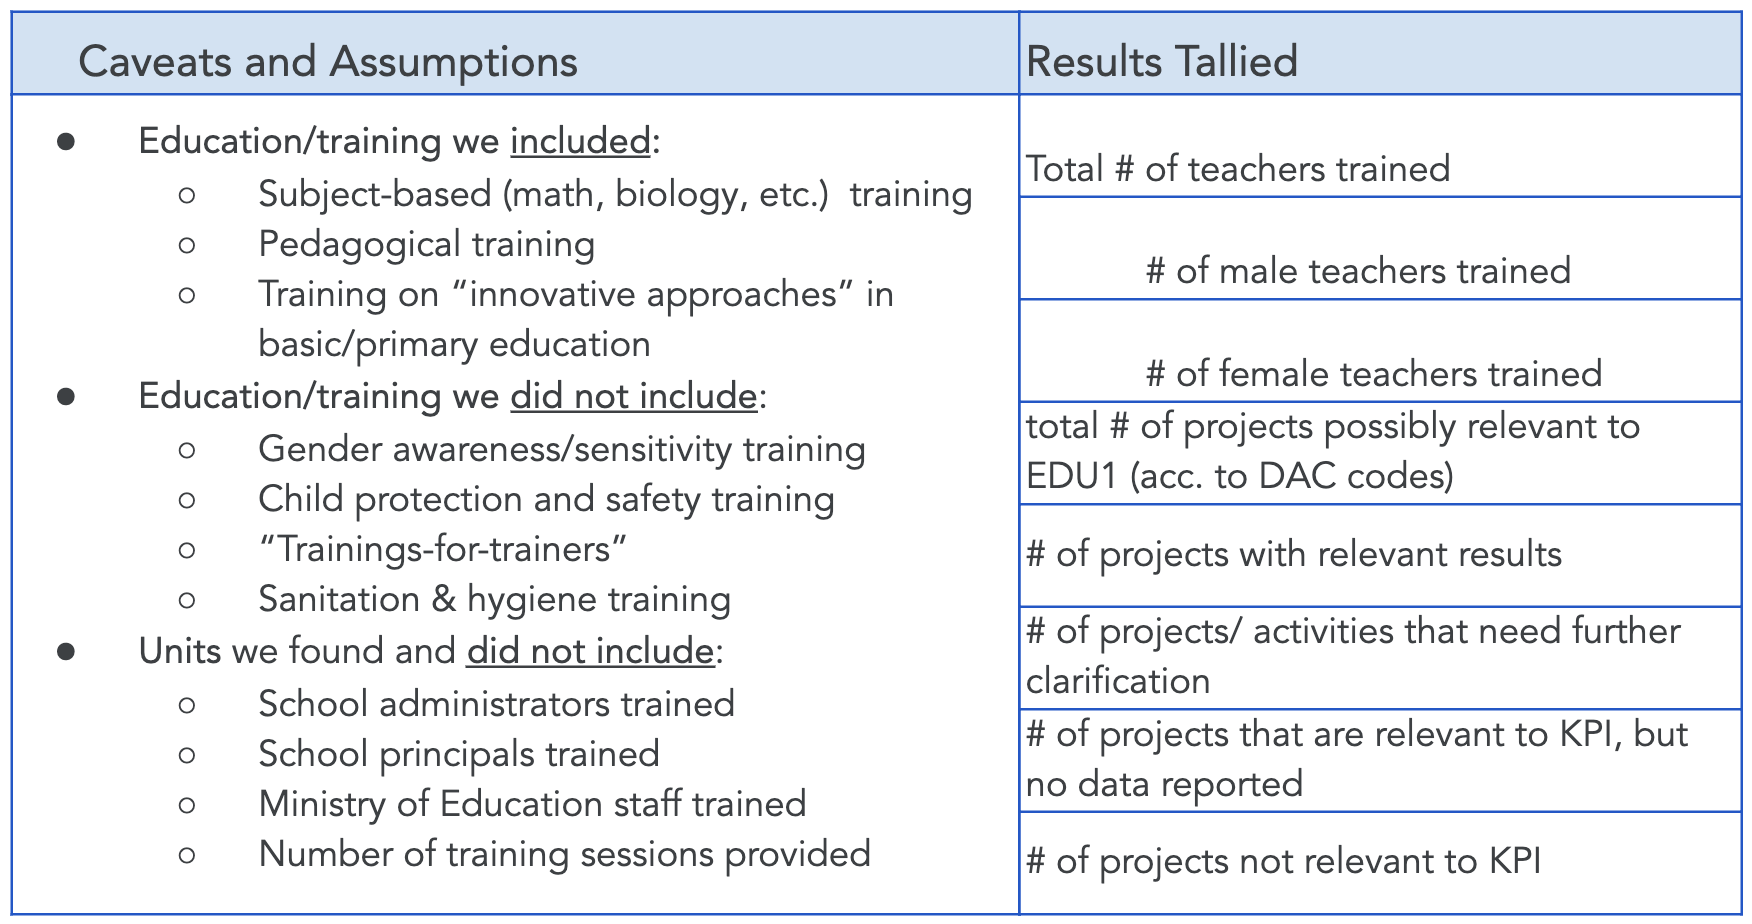
EDU1: # of teachers trained (m/f), according to national standards, supported by GAC programming
To make the existing M&E data compatible with the new indicators, DG took the following steps:
1. Use information already on-hand to isolate projects that are sector-relevant (in this case, OECD education projects).
This will more easily identify where corresponding gender data might exist.
2. Be specific with indicator definitions, and give methodological guidance for aggregating data to FIAP indicators.
For example, does the term “teachers” also include technical and vocational education trainers, or strictly refer to primary and secondary school educators?
3. Organize your data and document your assumptions.
This one speaks for itself – organization and documentation are both essential to the sustainability of your data.
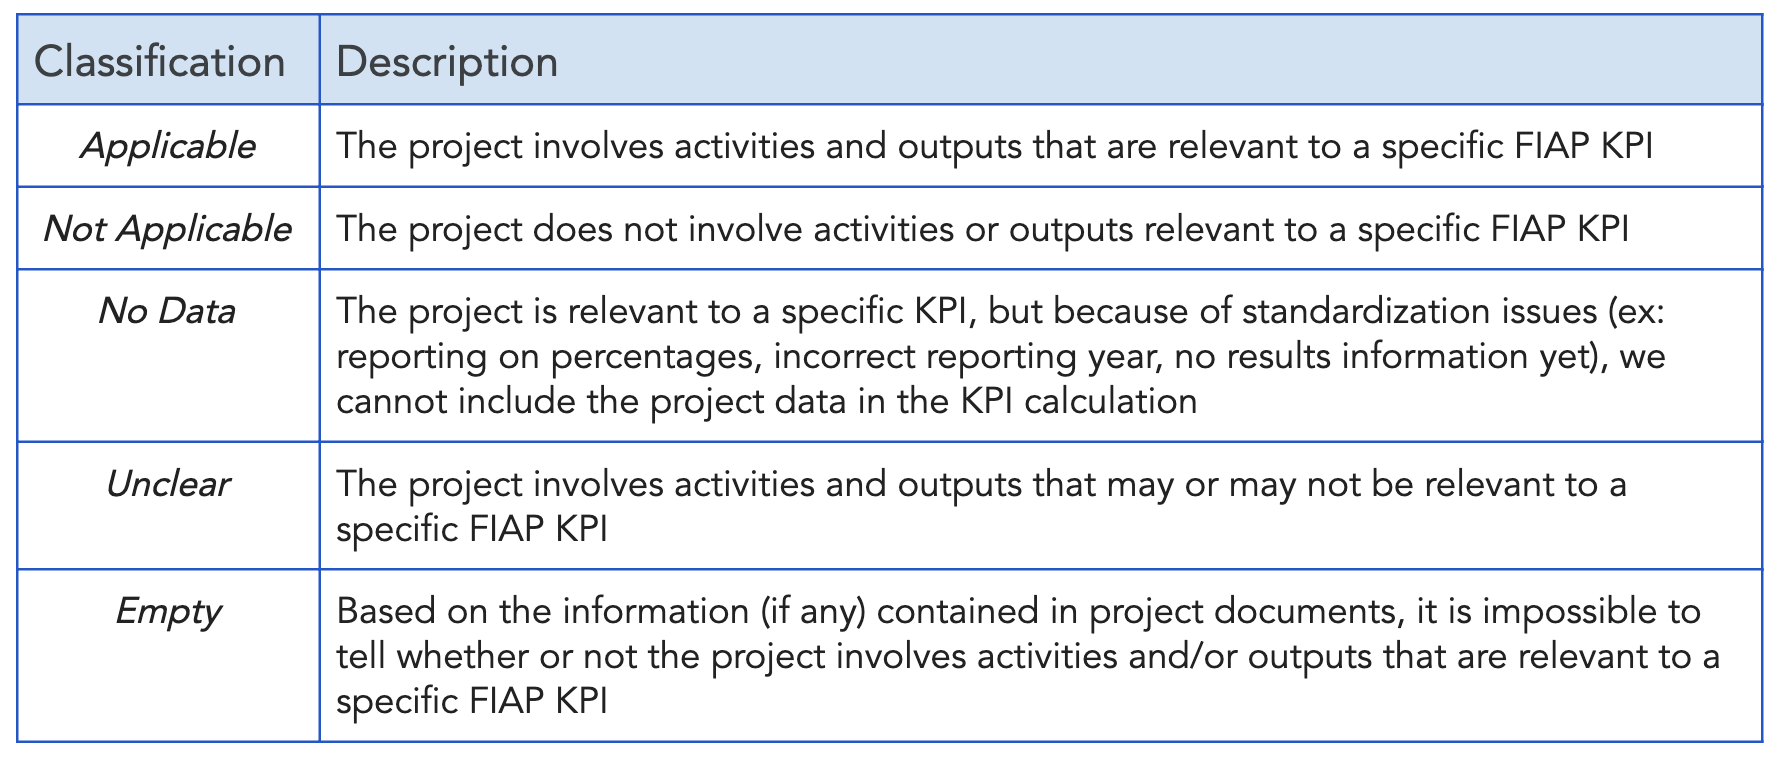
4. Tag each project to any applicable gender key performance indicators (KPI).
If it is unclear whether project components fit KPI definitions, classifications that allow more options on a “sliding scale” can help flag projects for further review with sector experts. For GAC-IA, we classified each project as one of the following:
5. Refine the dataset.
Review assumptions, definitions, and methodology with gender experts and project teams.
6. As a final step, (re-)calculate final KPIs.
After DG reviewed all potentially relevant project documentation, the following assumptions and results were presented to GAC-IA for further review by their gender and project experts:
Case Study Conclusions
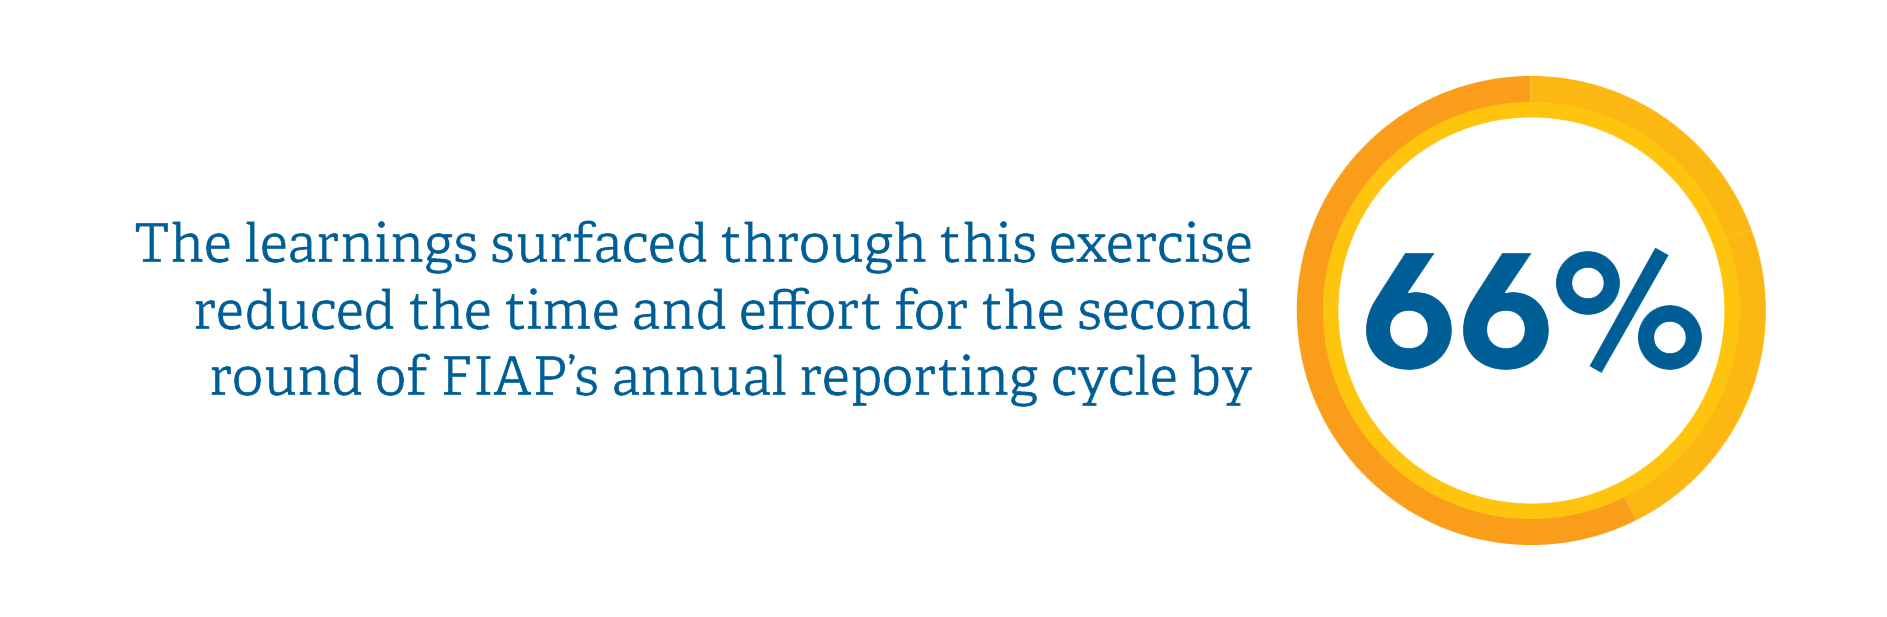
This approach to aggregating, flagging, and categorizing project data on a sliding scale was important to implementing the FIAP M&E plan. GAC-IA took DG’s assumptions, converting each into methodological guidance for their program teams. This saved GAC-IA months of expert analysis and debate on indicator definitions, because they were rooted in examples of what GAC-IA projects were already doing. Further, the exercise provided tangible insight into barriers to data use for GAC’s feminist decision-making – an important note in the first year of FIAP implementation.
Working with GAC-IA to establish a clear pathway to feminist, results-driven monitoring and evaluation was a new undertaking on both sides. It required close collaboration between GAC-IA and DG, and we gathered lessons along the way that are applicable to others looking to bridge best practice theory with pragmatism. Even in the absence of perfect data, this work has established that with a bit of flexibility and initiative, we can arrive at a custom made, actionable, and fit-for-purpose M&E plan.
If you missed Part 1 of our Gender Data series, check it out here. Stay tuned for Pt. 3, where we’ll lay out our biggest takeaways from this work, and how lessons uncovered through the GAC-IA experience resonate with other government agencies who have sought to measure gender-sensitive or feminist policies.
Photo credit: Juan Arredondo/Getty Images/Images of Empowerment
Share This Post
Related from our library

Development Gateway Collaborates with 50×2030 Initiative on Data Use in Agriculture
Development Gateway announces the launch of the Data Interoperability and Governance program to collaborate with the 50x2030 initiative on data use in agriculture in Senegal for evidence-based policymaking.
From Data to Impact: Why Data Visualization Matters in Agriculture
This blog explores why data alone isn’t enough; what matters is turning it into usable insights. In agriculture, where decisions have lasting impacts, user-friendly tools help farmers and policymakers alike make better choices.

Harnessing the Power of Data: Tackling Tobacco Industry Influence in Africa
Reliable, accessible data is essential for effective tobacco control, enabling policymakers to implement stronger, evidence-based responses to evolving industry tactics and public health challenges. This blog explores how Tobacco Industry strategies hinder effective Tobacco control in Africa, and highlights how stakeholders are harnessing TCDI Data to counter industry interference.