A Six Step Recipe for Effective Data Use
At Development Gateway: An IREX Venture (DG), we love food. In fact, many of our conversations—when they’re not about work—are all about which country makes the best Jollof and what new recipes we’re trying.
We know that when you make a great dish, all the right elements must work together at the right time. Finding the perfect balance of ingredients reminds us of how we help government ministries, international organizations, and others find the perfect balance in their work to use data more effectively.
As program managers at DG, we oversee multi-million dollar programs, one related to health and one to agriculture. Through our work, we have developed a six step “recipe” for effective data use. In particular, our approach highlights the importance of partnerships and innovation, which we see as central to ensuring our digital tools and websites respond to users’ needs and that data and statistics are fully inclusive and address issues relevant to all people.
Step #1: Gather the Right Partners
For our Visualizing Insights on Fertilizer for African Agriculture (VIFAA) program, finding reliable fertilizer-related data in sub-Saharan Africa is often a challenge. Data is usually fragmented or closely held in silos within different stakeholder groups.
A critical activity we undertake in VIFAA is mapping out stakeholders in the fertilizer sector based on their interests and influence. These partners are government representatives, customs officers, and private sector actors, among others.
By mapping these partners and identifying data sources, we’ve created country–specific dashboards—that visualize key fertilizer indicators, including product availability, use, price, and policy—as well as a continental dashboard with core data for 14 countries.

Step #2: Conduct Data Validation and Quality Checks
Data needs to be checked for accuracy, clarity, and completeness to reduce risks. If you don’t validate your data, you might make inaccurate decisions based on out-of-date or incorrect information.
At DG, verifying and validating data’s correctness is essential to avoid mistrust in our data management process and to ensure we accurately represent the current circumstance. This inclusive and transparent approach ensures our partners’ willingness to share their data because they see the value and understand how their collaboration contributes to the bigger picture. This also increases partners’ trust since the validation happens in plenary sessions, during which each partner can contest or approve any data set presented.
Each year, the VIFAA program organizes Fertilizer Technical Working Groups (FTWGs), meetings in which actors from private and public sectors come together and validate combined datasets. In 2022, information gathered during FTWGs held in 12 countries led to important insights about Africa’s fertilizer industry, including how geopolitical events have affected the industry and how to protect Africa’s food security.
Step #3: Innovate!
When data needs to be collected on a large scale, in a timely manner, and within a small budget, innovation through technology is a great avenue to accelerate data management efforts.
In 2020, VIFAA needed to quickly collect large amounts of data in order to map croplands in Nigeria and Ghana. Existing map data did not provide enough granularity or detail for stakeholders. To accomplish this challenging task, innovation was imperative! We opted for cutting-edge technology (i.e., satellite imagery) combined with machine learning to provide rapid and scalable access to high-resolution imagery of these croplands.
The data gathered from these cropland maps informs the government and private sector in Nigeria and Ghana on allocating investments to strengthen the agricultural sector. This data helps ensure that the availability and variety of fertilizer products meet market needs.
Step #4: Visualize the Data
In almost all cases, our stakeholders don’t find raw datasets to be helpful. Many of our stakeholders are civil society advocates and, like most people, don’t have a statistics or economic background to parse through highly technical datasets. However, they receive multiple requests to speak to government officials or media representatives with very little advanced notice, so they need the latest research and data in an accessible format.
In DG’s Tobacco Control Data Initiative (TCDI) program, which collects and aggregates data relevant to stakeholders who work in tobacco control in six African countries, we’ve made it a priority to display information in a way that’s easily understandable, using graphs and infographics to express key information. By collecting and displaying data in new formats with clear visuals, we’ve ensured stakeholders can access the key data and takeaways from our latest research quickly.
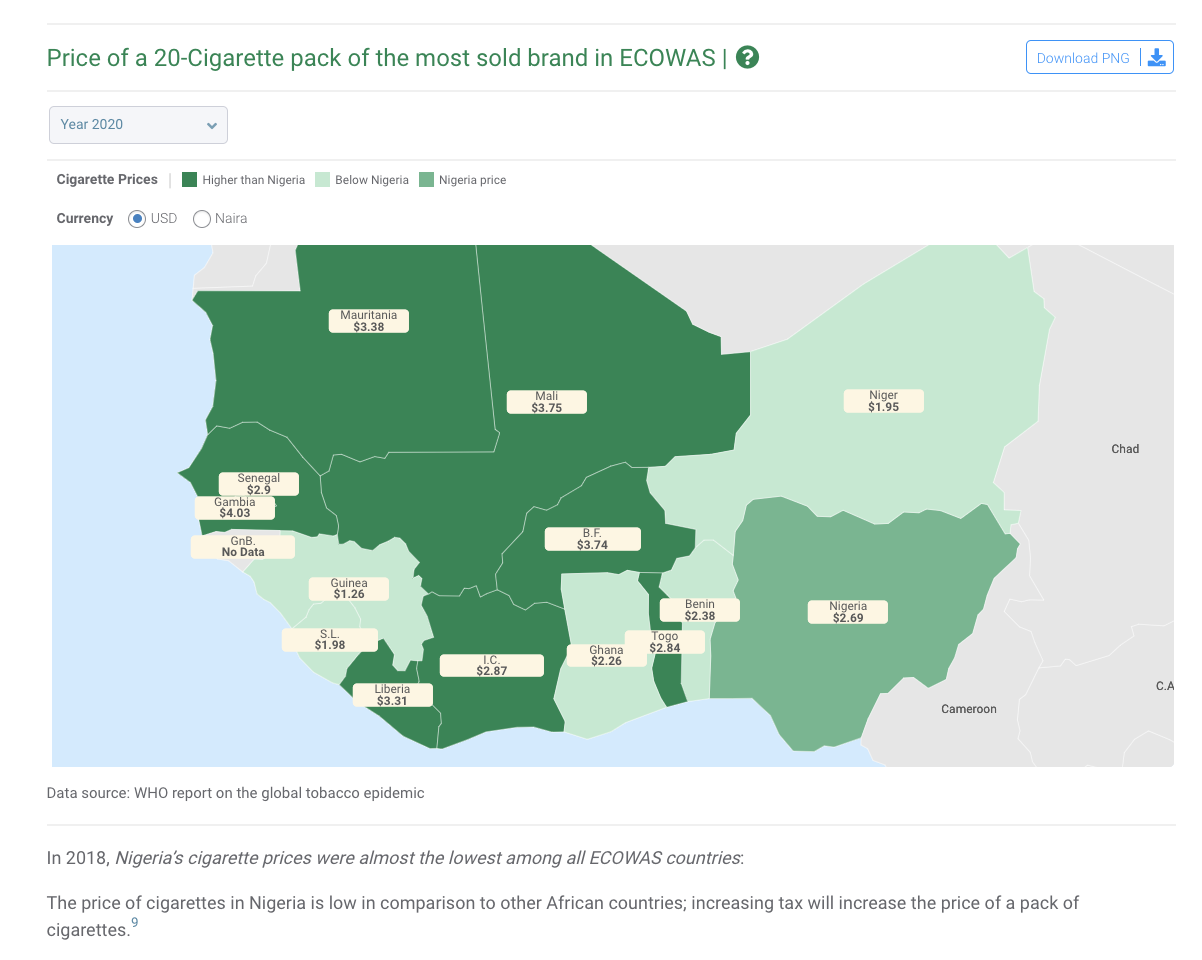
Step #5: Design with Decision-Making in Mind
Data use for decision-making is critical. When designing a digital tool, we ask ourselves and our partners what decisions need to be made using the latest research and data and how they could best access that data.
In South Africa, for example, stakeholders repeatedly told us that tax and economic information needed to be included in our TCDI websites. They also alerted us to the fact that the tobacco industry often spreads misinformation about the impact of excise taxes on cigarette products. We responded to these needs by adding key insights from economic data as well as a “myths and facts” sections to our TCDI websites.
Step #6: Build Trust in the Data
Our final ingredient is data trust. If our stakeholders don’t trust the data sources we’re using or don’t trust the way in which we’re analyzing data, then our websites aren’t helping anyone.
So, how do we build trust? We’ve found that we need to (1) work closely with key government ministries, civil society representatives, and academics from the beginning of the project; (2) be very clear about the data sources from any information we cite; and (3) invest in relationships with our stakeholders to better understand their needs.
Share
Recent Posts

Three Fundamentals for Climate and the Future of Health
Climate change is no longer a distant environmental concern; it is a growing public health challenge. Reflecting on discussions during London Climate Action Week, this blog explores why stronger investment, cross-sector collaboration, and better data are essential to building climate-resilient health systems.

(inter)National Models for Women’s Safety Online
Development Gateway and IREX spent the last year analyzing how different nations approach the "how-to" of online safety regulations. This blog discusses our research, which suggests that the most effective models go beyond reactionary and punitive measures to facilitate a functional ecosystem of trust and accountability.
From Ambition to Adoption: Reflections on AI in Higher Education in Kenya and Jordan
Higher education institutions are being asked to move beyond AI experimentation toward meaningful adoption. Drawing on a strategic dialogue in Nairobi, this blog explores how universities can bridge that gap through AI sovereignty, partnerships & practical adoption priorities.