Improving Land and Crop Use Data in Nigeria – The VIFAA Innovation Fund
Nigeria has the largest population and economy in sub-Saharan Africa (SSA). However, with more than 90% arable land and the largest agricultural output in SSA, Nigeria still relies on the import of staples such as maize and rice to meet food demand.1
Basic statistics on hectares of cropland and major crops are outdated, if they exist at all. Availability of reliable and up-to-date land and crop usage data will help inform the government and private sector on how to allocate investments to strengthen Nigeria’s agriculture sector and, in particular, will help ensure that the availability and variety of fertilizer products meet market needs.
The VIFAA Innovation Fund
Development Gateway: An IREX Venture’s (DG’s) Visualizing Insights for Fertilizer in African Agriculture (VIFAA) Program2, funded by the Bill & Melinda Gates Foundation, launched an Innovation Fund to address data shortages relating to total crop production. Building on its track record of mapping land cover, Quantitative Engineering Design (QED)3 was selected to tackle the challenge of mapping Nigeria’s croplands. Through the Innovation Fund, DG and partners is using the resulting data and maps to answer two questions:
- What is the total cropland under production in Nigeria?
- What is the cropland under production by crop type?
Background
Historically, there have been attempts to map croplands and crop types across Nigeria; however, the immense size of Nigeria has made traditional mapping efforts cost prohibitive.4 Recent advancements in technology (i.e., satellite imagery) combined with machine learning have provided rapid and scalable access to high-resolution images of the ground that covers the globe. These tools have been used to map large, industrial-scale croplands in developed countries.5 However, mapping initiatives using remote sensing imagery in tropical countries dominated by smallholder agriculture have not been as successful, largely due to dense cloud cover during the growing seasons and the size, complexity, and diversity of smallholder farm plots.
Mapping Methodology
QED’s high-level approach to land cover mapping is four-fold:
- Survey: Generate training data by labeling satellite imagery and looking at the visual patterns in the landscape between different land uses (e.g., agriculture, urban, forests, etc.).
- Model: Build and test multiple artificial intelligence (AI) models using the training data so that the computer learns from the training data to classify unknown areas across the country.
- Validate: Create predictive maps with each model and assess each one’s performance. This is followed by refinement whereby steps 1-3 are repeated in selected areas requiring further improvement.
- Statistics and visualization: Generate summary statistics based on predictive maps.
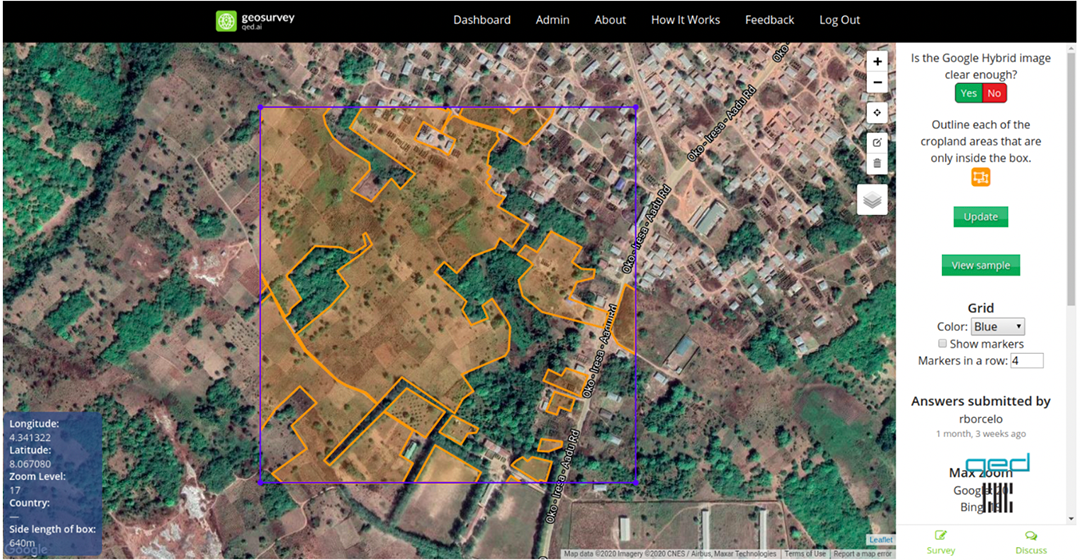
Surveying
QED developed Geosurvey, which is a software tool for efficiently collecting and labeling visual training data. This tool feeds labeled images of agricultural landscapes into a computer program, where trained surveyors assess each image and classify the features within each image (e.g., croplands or not). The process requires a team of skilled surveyors to identify visual indicators of agricultural features and learn patterns which can change depending on the cropping system and geographic region where the specific training data was developed to match the unique locations.
Due to the diversity of agricultural landscapes in Nigeria, conducting a single geosurvey for all of Nigeria would not provide the quality of training datasets required. This necessitated partitioning the country into six smaller, more homogenous, and sometimes overlapping agro-ecological zones to aid familiarity with region-specific fingerprints to the survey team. Using these dimensions, areas of interest (AOI) were identified. However, ecological subdivisions were found within these zones that affected surveyor calibrations such as in the northeast and the delta where croplands and agroforestry systems can subtly blend into the surrounding area, making differentiation difficult.
To overcome these challenges, a series of region-specific training materials were created. They consist of visual guides, videos, and interactive training sessions. To increase the quality and accuracy of the image labeling, QED developed peer review systems whereby each survey submission was reviewed by three different levels of experts. Using this system, the team was able to fully annotate over 10,000 square kilometers of Nigeria within the space of two months.
Modeling
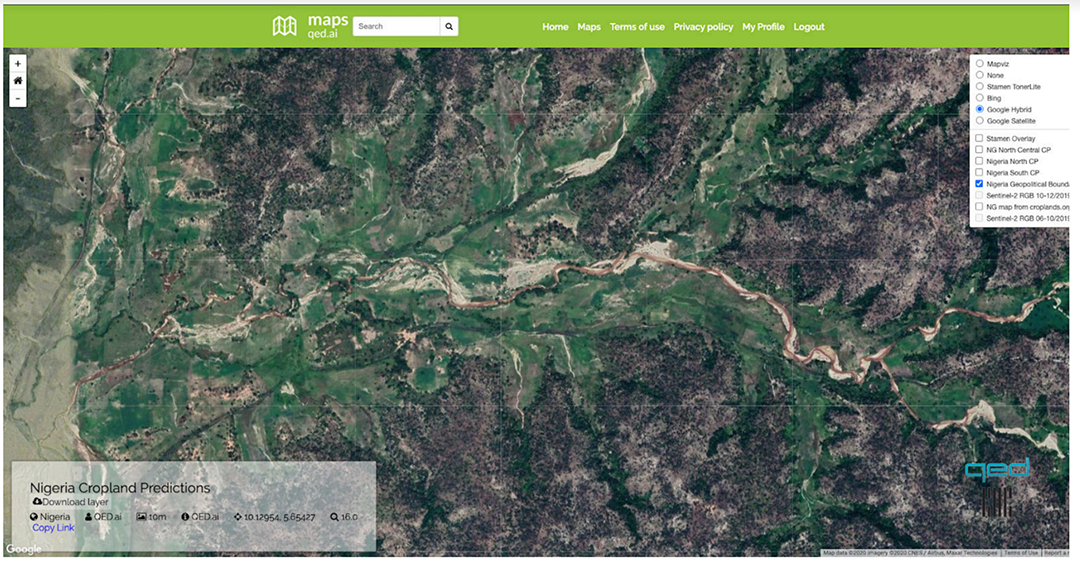
In addition to the training datasets, QED also used a combination of publicly available high-resolution satellite imagery datasets, including Sentinel-2 which is a public satellite run by the European Space Agency. The satellite data is collected every five days (since 2015) to train the models to infer patterns and correlate with crop cycles between satellite imagery and the training datasets. The results are then extrapolated across Nigeria. Using high-performance computing, QED trained and evaluated more than 50,000 different models to produce cropland maps with an accuracy and precision of 85%.
However, even with the level of detail provided by the Sentinel satellite imagery, the main rice and maize growing seasons occur during the rainy season, which is also the period when the availability of cloud-free imagery is scarce. With transfer learning, QED leveraged modeling and data gleaned from the mapping of other countries. Having the basic model built upon previously developed models allowed the team to spend more effort fine-tuning the models to suit local conditions.6
An outstanding question is the ability to differentiate land under fallow from land under active cropping. Attempting to model fallow lands is difficult, as fallow lands may be hard to differentiate from natural lands. Historically, cropland maps have rarely accounted for fallow cropland but, when factored in, the inaccuracies may be substantial. To improve crop yield estimates more broadly, it is vital to estimate the proportion of fallow cropland. QED will continue to review the literature on possible fallow land types and incorporate these types into the field validation surveys used by ground teams in Nigeria.
Validation
In addition to satellite-based verification, QED has been working with Nigerian agricultural experts for further validation of the maps, drawing on the expertise of on-the-ground experts and field staff.
From April 2020, QED began collecting ground data in North Central Nigeria. During the wet season, the region grows mostly maize and rice. QED provided field tools, including mobile phones that were pre-authenticated and pre-loaded with data collection applications; navigation software; mobile data; and communication tools. In the field, surveyors followed predefined waypoints and collected a balanced mix of locations of croplands and non-croplands (e.g., roads, natural vegetation, fallow fields, buildings, etc.).
The survey tool contained data on land use class, present and historical fertilizer use, and the number of seasons under cultivation (if classified as cropland). For data classified as croplands, surveyors were required to include a photograph of the field for verification purposes. Using digital collection tools allowed for near real-time monitoring and feedback for the team. Data from more than 1,000 locations across the North Central region of Nigeria was collected within one month.
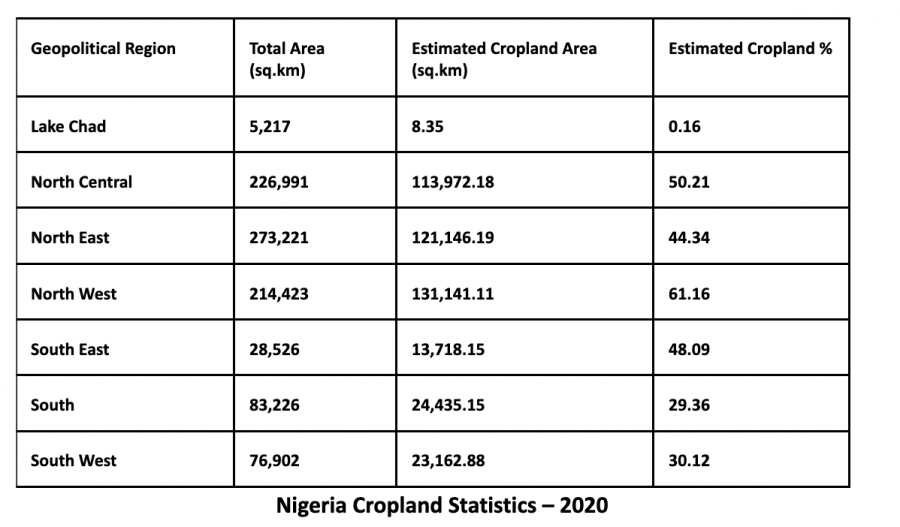
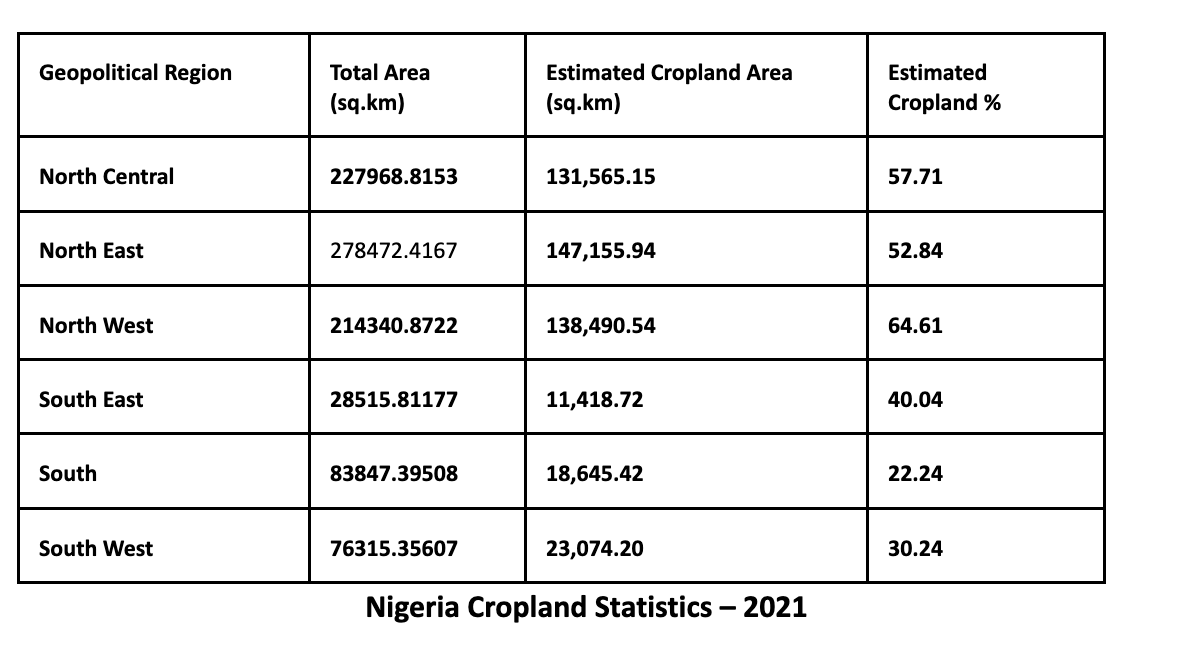
Cropland Statistics
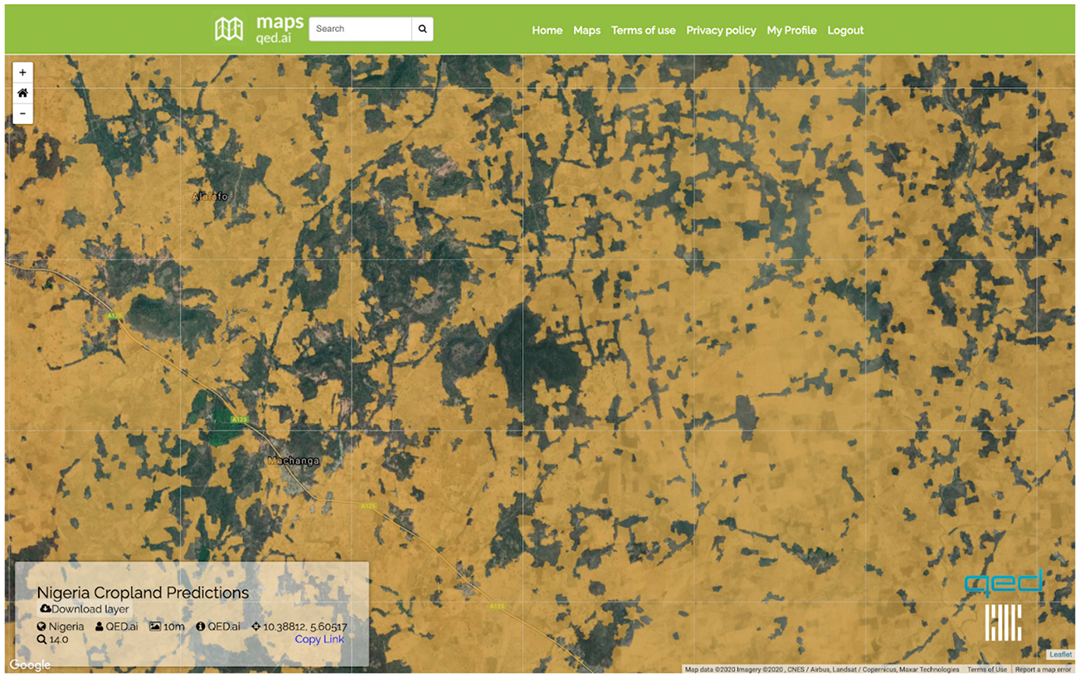
Statistics have been generated for cropland areas under production across the various geopolitical regions and states in Nigeria (see table below). These statistics include total land area, estimated cropland area, and estimated cropland percentage, which can be compared against statistics from other sources. A further breakdown on regional and state statistics can be viewed via an interactive map.7
Cropland Area Comparison Nigeria: 2020 vs. 2021
QED has updated the previous 2020 cropland map produced for Nigeria in order to reflect cropland estimates in 2021 and review any changes between the two years. To derive multi-year cropland predictions, QED employed Transfer Learning (TL), an AI technique which is used in scenarios with a large existing dataset and trained models and a smaller but related dataset from which new models are trained. Rather than collecting enough new data to build new models, the existing data and models are leveraged to develop the new models and are augmented with smaller sets of new data to provide additional data for the model to learn. In this case, QED used the cropland model developed for 2020 and adapted it to work with the dataset for 2021. Using this technique, the updated cropland map for Nigeria from the 2021 season was produced with slightly higher accuracy than from 2020.Developing the ability to map croplands across multiple years provided additional insights into national crop production dynamics. We estimate that arable land across Nigeria between 2020 and 2021 experienced a net increase of 1.34%. While numerically small as an absolute percentage (given the size of Nigeria), 1.34% equates to 12,225.19 km, roughly half of the total land area of Rwanda.These results demonstrate promise for more cost-effective updating of national-scale maps, if there is demand to regenerate them on a yearly subscription basis across multiple African countries.
Highlight: Comparisons estimate an increase of 1.34% in Nigeria’s national cropland production equal to +12,225.19 km.
We also noticed that many inter-annual differences occurred around the borders of natural areas. Many bandits (e.g., Boko Haram) use the forested areas as home bases. There appears to be consistent correlations between the regions known to have banditry and corresponding reductions in cropland.
VIFAA Going Forward
In November 2022, AfricaFertilizer (AFO), our partner on the Visualizing Insights on Fertilizer for African Agriculture (VIFAA) program, rebranded and launched a new website. This website includes the integration of country-specific VIFAA dashboards, which were previously housed in separate websites. By integrating the country-specific dashboards as well as fertilizer data on trade, production, consumption, and retail prices for 18 countries in sub-Saharan Africa, the new AFO data allows easier comparative analysis across countries and contributes its quota to the advancement of food security throughout Africa.
We have updated the previous country-specific dashboards links to now redirect you to AFO’s new website in order to ensure you are accessing the most up-to-date resources.
- Chapin Metz, 1991.
- Learn more about the program at go.developmentgateway.org/vifaa.
- For more information about QED please visit https://qed.ai.
- I.D. Hill et al 1978.
- Kussul et al 2017. Available at https://ieeexplore.ieee.org/abstract/document/7891032.
- Engage with the map: https://maps.qed.ai/map/ng_cp_preds.
- The map is available at https://cropstats-ng.qed.ai.
Share
Related Posts
From Data Gaps to Impact: Key Insights from the VIFAA Program
Over the last six years, DG, together with its partners AfricaFertilizer (AFO) and Wallace & Associates, collaborated to implement the Visualizing Insights on Fertilizer for African Agriculture (VIFAA) Program. In the program’s final year (2024), the team undertook a “program learning process” to reflect on outcomes, challenges, and successes through internal interviews. This blog captures five key learnings, which we hope will guide similar programs aiming to bridge data gaps in agricultural development.
Case Study: Fostering Sustainable Agriculture through Data-Driven Collaboration and Partnership: Ethiopia, Mozambique, and Nigeria
Through DG’s Visualizing Insights on Fertilizer for African Agriculture (VIFAA) program, we recently published a case study titled “Fostering Sustainable Agriculture through Data-Driven Collaboration and Partnership: Ethiopia, Mozambique, and Nigeria.” It dives deep into how the VIFAA program has impacted the fertilizer data and markets in Ethiopia, Mozambique, and Nigeria. In this blog, we explore the overall impact that the VIFAA program is making, why the program was needed, and offer some key highlights from the case study.
Fertilizer Technical Working Groups Provide Key Insights into Africa’s Fertilizer Sector
From June 2021 to September 2022, Development Gateway: An IREX Venture’s (DG’s) Visualizing Insights on Fertilizer for African Agriculture (VIFAA) program convened 12 Fertilizer Technical Working Groups in 14 countries which have yielded essential information on Africa’s fertilizer sector, including insights on how geopolitical events have impacted the fertilizer sector and what is needed to mitigate resulting threats to food security throughout Africa.