The Need for Stronger Systems
Estimates show that upwards of USD $2.5 billion annually is spent performing program monitoring and evaluation (M&E). But investments in information management and M&E systems suffer from high levels of inefficiency, ineffectiveness, and redundancy.
Why such a high rate of failure? And how can we ensure that what we learn is not shelved, but rather is used to reshape or inform future decisions?
Building Tools that Track Results
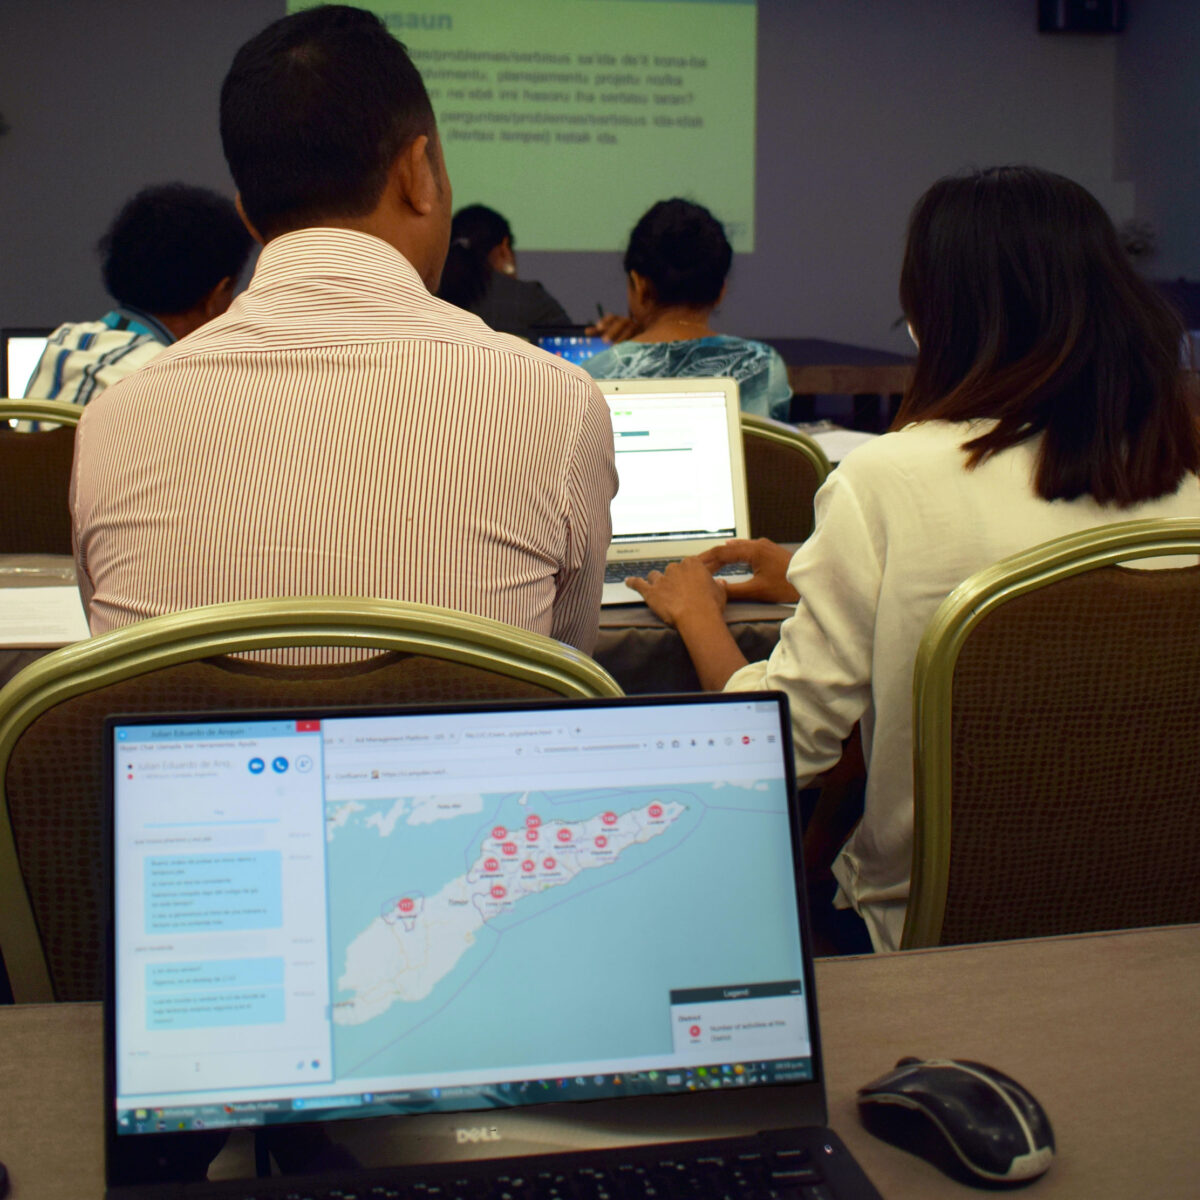
We specialize in developing comprehensive databases for partners with easy-to-use interfaces for internal and external audiences. Through customizable and interactive data portals, DG enables users to quickly get the information they need, in the way they need it, to increase learning and support decision-making.
Finding Balance Between Accountability and Learning
We support decision-makers, researchers, and practitioners with access to more reliable, timely, and usable data. Instead of simply counting inputs and outputs, our systems focus on learning in addition to reporting for accountability.
Creating Systems Together with Users
By creating tools directly with stakeholders, we build dashboards for practical, everyday use. By continuously iterating our working designs based on real user feedback, we create buy-in and tools that respond to proven user needs. Underpinning all components is attention to the human and technical processes and capacities of our partners.
Tools for Decision-Making and SDG Progress
We have a deep background in data for monitoring, evaluation, and learning – particularly how it can be used to inform decision-making. We create platforms and portals that intuitively aggregate data, and that make monitoring and evaluation data accessible, transparent, and dynamic.
Tracking Indicators That Matter
M&E tools are built on indicators – the information that is being measured. The usefulness of an indicator is directly dependent on its quality – timeliness, representativeness, and accuracy. Working with partners, we identify the right indicators and create systems that can track and visualize data, which can feed into project design.


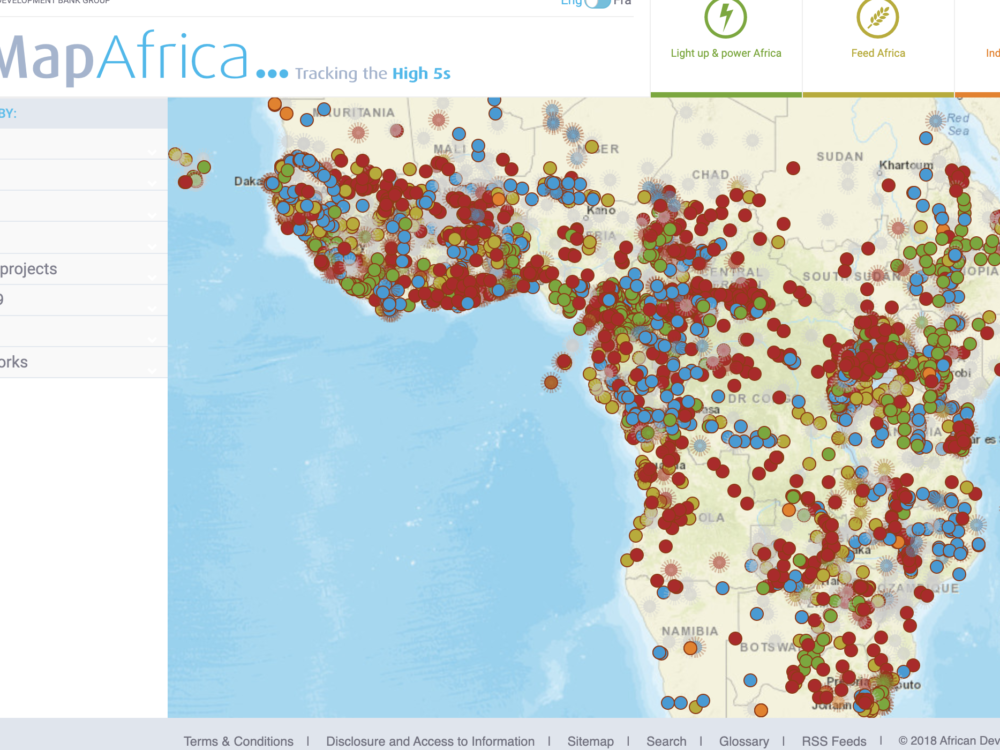
MapAfrica: Interactive Dashboard of the African Development Bank’s Portfolio
MapAfrica displays the African Development Bank's full portfolio of work across the continent – developed by DG and launched in 2014 to enable citizens, governments, and donors access to information about AfDB’s investments. Since launch, we've continued to work with AfDB to advance geocoding, created a tool to add country briefs and results stories, and enabled AfDB to sustain the system itself.

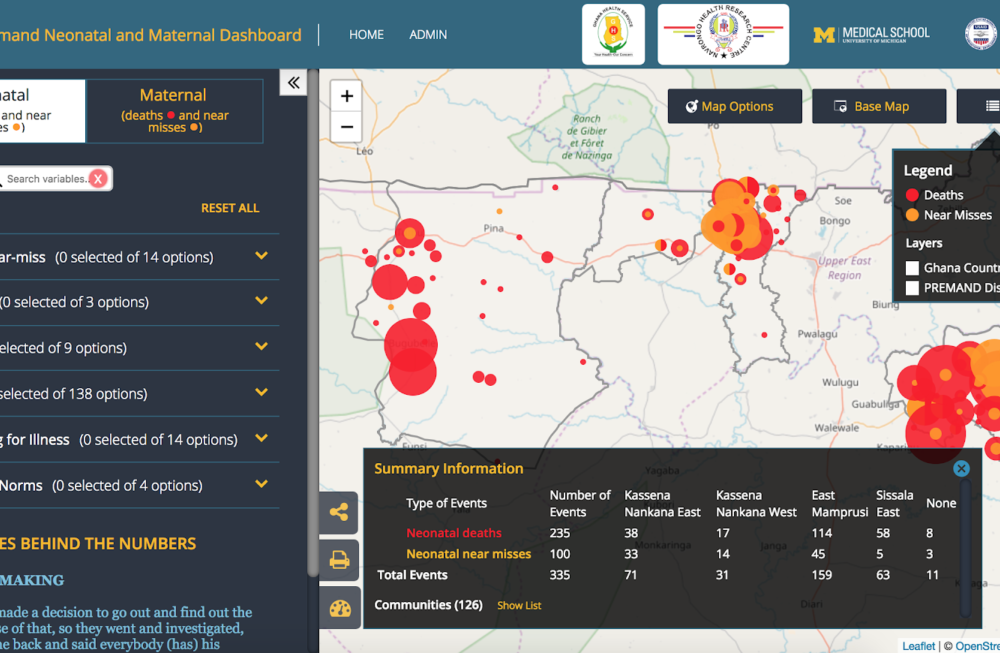
PREMAND: Preventing Maternal and Neonatal Deaths in Northern Ghana
The PREMAND dashboard highlights interactions of social, cultural, and geographic factors in contributing to maternal and neonatal health outcomes. The flexible tool serves a range of users: from district health policymakers to local community leaders. It translates highly technical research data into an easily-understandable map, to make this information approachable and usable by decision-makers at all levels.

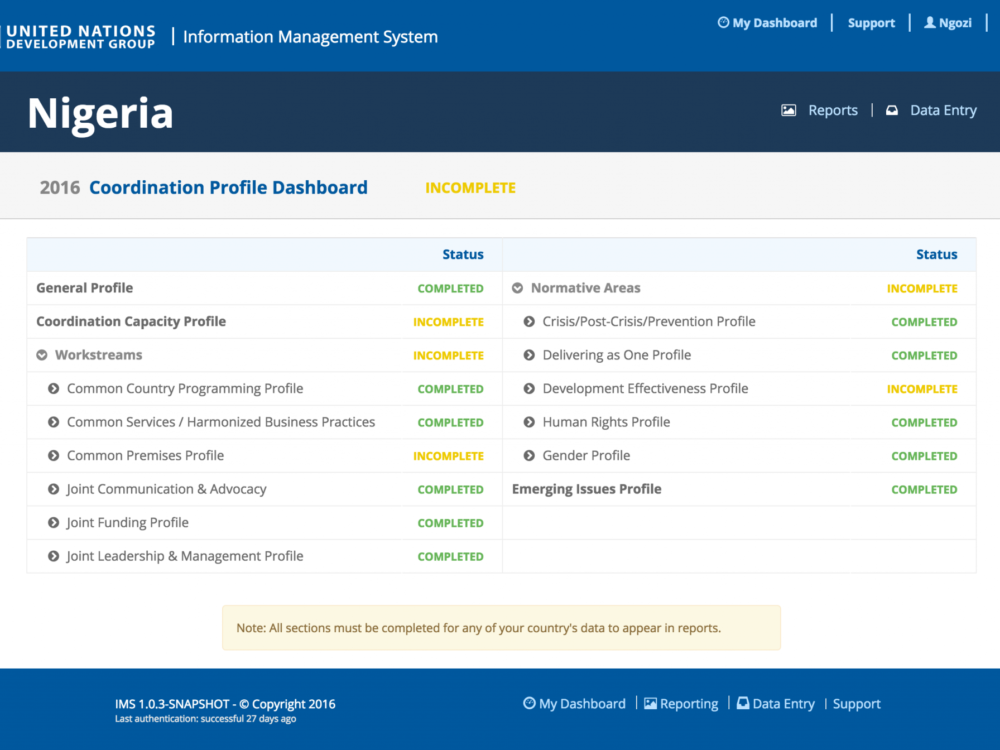
UNDG Information Management System
The UNDG Information Management System (IMS) is a dynamic web application designed to improve coordination and knowledge sharing among the 130+ global country offices, mechanisms, and departments that make up the UN. The IMS allows for the creation of annual work plans, reporting on progress, and collection of a wide range of indicators tied to the Development Cooperation Office (DCO)’s priority workstreams and goals.