Changing the Data Landscape: The VIFAA Nigeria Dashboard
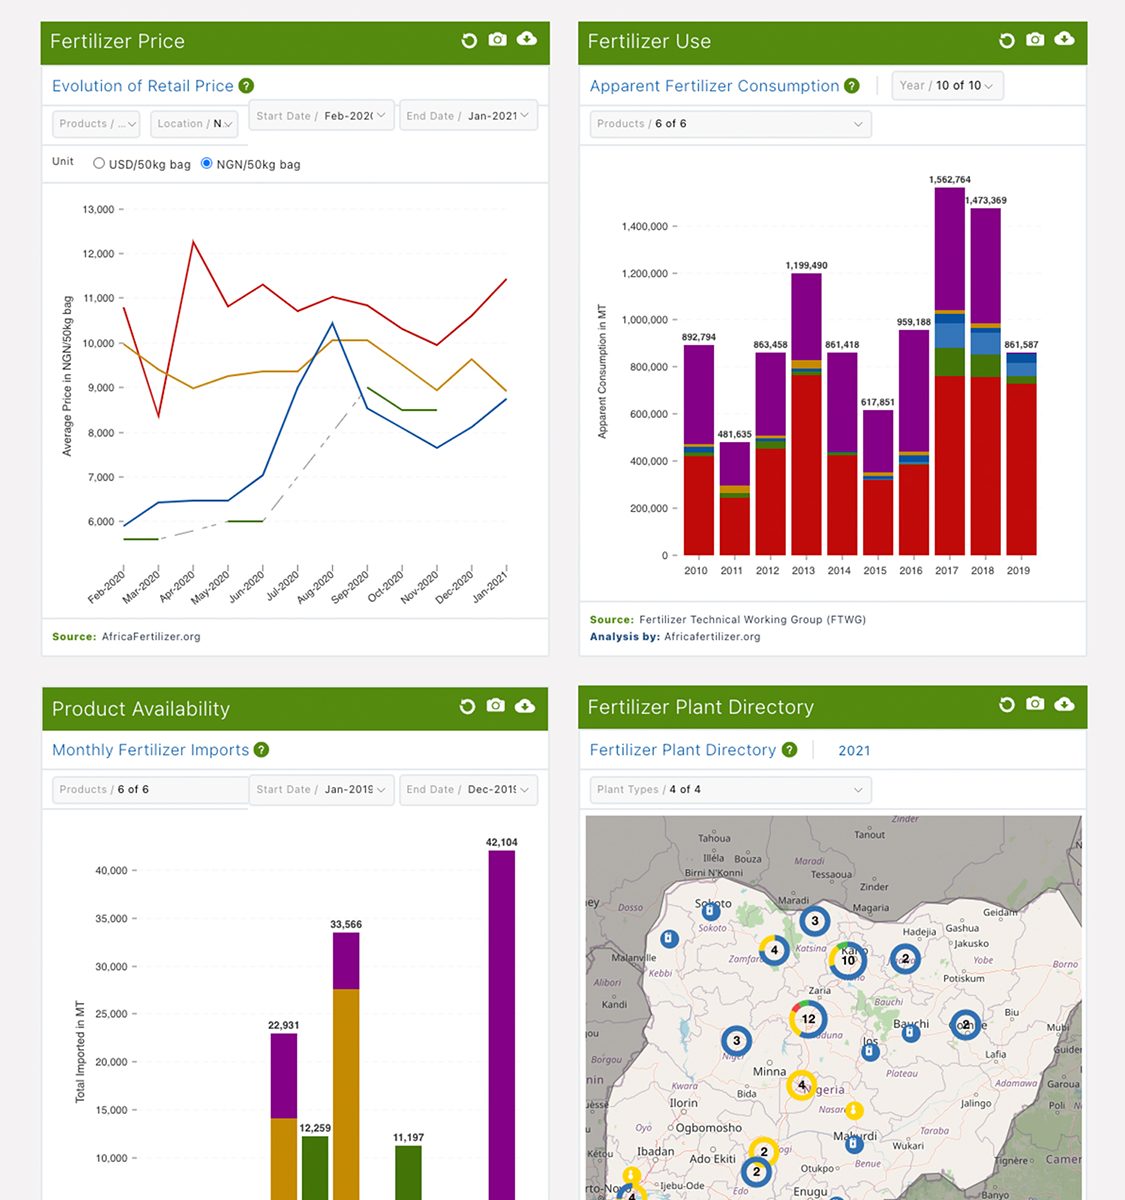
In place of unwieldy spreadsheets and dozens of sources, the VIFAA Dashboard introduces a “one-stop-shop” for trustworthy, visually appealing information that is key to understanding Nigeria’s fertilizer sector.
Over the last two years, Development Gateway (DG) has collaborated with Africafertilizer.org (AFO), the International Fertilizer Development Center (IFDC), the Federal Ministry of Agriculture and Rural Development, Quantitative Engineering Design (QED), the private sector, research institutions, and development partners to map Nigeria’s demand, supply, and use of fertilizer data. These findings have come together through the Visualizing Insights on Fertilizer for African Agriculture (VIFAA) program, which is generously supported by the Bill & Melinda Gates Foundation and implemented in Kenya, Nigeria, and Ghana.
The Nigeria Dashboard
Together, partners co-designed a publicly available dashboard that aims to address key decision-making needs. The Dashboard contains 14 core indicators, such as fertilizer retail price, cropland under production, and monthly product imports, to highlight and visualize key aspects of Nigeria’s fertilizer supply chain. Partners worked extensively through group and individual sessions to gather feedback on data priorities, receiving input from stakeholders across institutions. Data for the dashboard comes from a broad range of private and public fertilizer stakeholders, with Africafertilizer.org gathering, validating, and updating the data on a regular basis. A full list of data sources and methodology for each indicator is available on the dashboard site.
Cropland Under Production
In a first for the VIFAA Program, partners worked to generate comprehensive cropland under production maps, some of the first in Nigeria’s recent history. Collaborating with machine learning and satellite imagery experts, QED, resulted in the generation of an updated map that provides information on the total land under production (across all crops) in Nigeria; what percentage is under production versus uncultivated; and how production breaks down by state and geopolitical zone. The partners hope that the dashboard and use of innovative tools to fill data gaps are the beginning of boosting data quality and use across Nigeria’s fertilizer sector.
VIFAA Going Forward
In November 2022, AfricaFertilizer (AFO), our partner on the Visualizing Insights on Fertilizer for African Agriculture (VIFAA) program, rebranded and launched a new website. This website includes the integration of country-specific VIFAA dashboards, which were previously housed in separate websites. By integrating the country-specific dashboards as well as fertilizer data on trade, production, consumption, and retail prices for 18 countries in sub-Saharan Africa, the new AFO data allows easier comparative analysis across countries and contributes its quota to the advancement of food security throughout Africa.
We have updated the previous country-specific dashboards links to now redirect you to AFO’s new website in order to ensure you are accessing the most up-to-date resources.
Related Posts
From Data Gaps to Impact: Key Insights from the VIFAA Program
Over the last six years, DG, together with its partners AfricaFertilizer (AFO) and Wallace & Associates, collaborated to implement the Visualizing Insights on Fertilizer for African Agriculture (VIFAA) Program. In the program’s final year (2024), the team undertook a “program learning process” to reflect on outcomes, challenges, and successes through internal interviews. This blog captures five key learnings, which we hope will guide similar programs aiming to bridge data gaps in agricultural development.
Case Study: Fostering Sustainable Agriculture through Data-Driven Collaboration and Partnership: Ethiopia, Mozambique, and Nigeria
Through DG’s Visualizing Insights on Fertilizer for African Agriculture (VIFAA) program, we recently published a case study titled “Fostering Sustainable Agriculture through Data-Driven Collaboration and Partnership: Ethiopia, Mozambique, and Nigeria.” It dives deep into how the VIFAA program has impacted the fertilizer data and markets in Ethiopia, Mozambique, and Nigeria. In this blog, we explore the overall impact that the VIFAA program is making, why the program was needed, and offer some key highlights from the case study.
Fertilizer Technical Working Groups Provide Key Insights into Africa’s Fertilizer Sector
From June 2021 to September 2022, Development Gateway: An IREX Venture’s (DG’s) Visualizing Insights on Fertilizer for African Agriculture (VIFAA) program convened 12 Fertilizer Technical Working Groups in 14 countries which have yielded essential information on Africa’s fertilizer sector, including insights on how geopolitical events have impacted the fertilizer sector and what is needed to mitigate resulting threats to food security throughout Africa.