Sourcing Fertilizer Data in Sub-Saharan Africa
Scott Wallace is an agriculture development expert and a Senior Fertilizer Advisor to the VIFAA program. He has been advising DG since 2017. Grace Chilande is a Fertilizer Markets Specialist and AfricaFertilizer.org Coordinator at IFDC. Vinisha Bhatia-Murdach is Senior Learning Advisor and has been with DG since 2015.
For a deeper understanding of the data shown through The Visualizing Insights on Fertilizer for African Agriculture (VIFAA) program dashboard read the first blog in this series.
Previously, we talked about the importance of price, policy, consumption, and availability sub-indicators that inform the high-level indicator called Kilograms per Hectare (Kg/Ha) or more formally referred to as the National Average Fertilizer Consumption. In advance of the first VIFAA country dashboard launch next week, we will explore the importance of and how we source accurate and reliable data for each of the indicators. This is a crucial step in making data available in a way that stakeholders can use to inform their decisions.
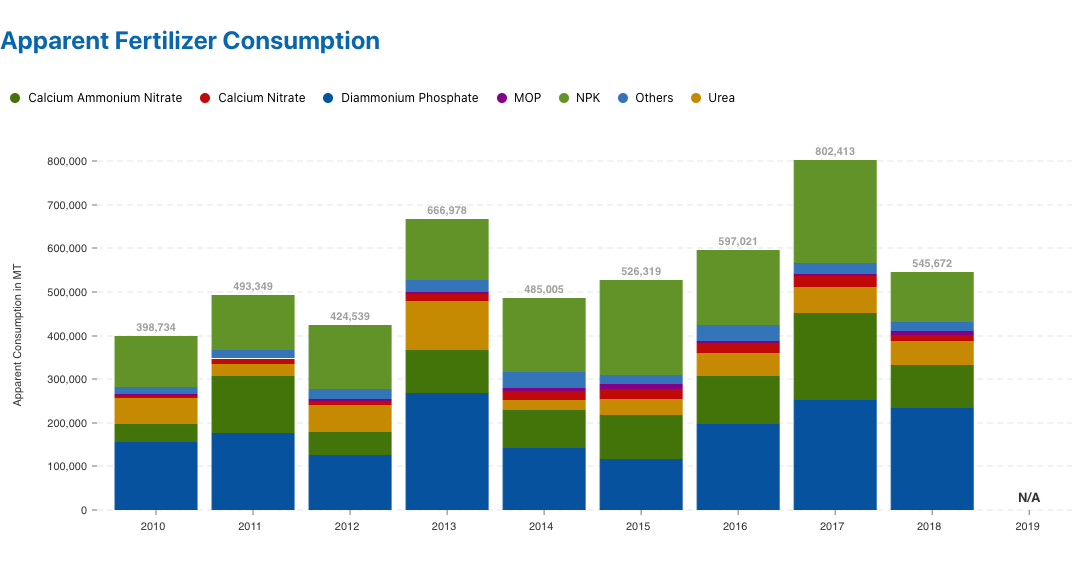
Source: Fertilizer Technical Working Group (FTWG)
Analysis by: Africafertilizer.org
Why is accessing reliable consumption data important but challenging?
The Kg/Ha or National Average Fertilizer Consumption indicator is crucial to benchmark a country’s fertilizer use with its neighbors, the rest of the world, and in a historical context to understand year on year progress. At a high level, the indicator, Kg/Ha, relies on two critical pieces of information that are difficult to acquire. First, the numerator (Kg) equates to the total fertilizer consumed in a calendar year. Second, the denominator (Ha) equates to how much arable land was utilized during the same time frame.
For now, let’s focus on the numerator (total fertilizer consumed) and why this data is so difficult to acquire, despite being one of the most important pieces of information sought by stakeholders. This information relies on data such as how much fertilizer was produced domestically, how much was imported, how much was exported, how much was consumed during the year, as well as the amount of fertilizer held in storage for the next farming season. When the various data sets remain in silos, government, and private sector market actors are not able to make decisions that ensure there are no supply shortages and agricultural production shortfalls. Surveying all the supply-chain participants and smallholder farmers in a given country would be one solution, but is simply not possible. Even if it were, the process could be riddled with response biases that make it difficult to acquire accurate information. Thus, fertilizer consumption data has to be triangulated from multiple sources.
To highlight some of the problems that occur when gathering data, let’s study the fertilizer market of a non-existent country called Nabanda.
In Nabanda there are 5 major private sector fertilizer suppliers that import and distribute fertilizer. Last year these suppliers imported 250,000 metric tons of fertilizer. The Government also announced a tender to supply 75,000 metric tons of product at a 50% discount. However, the announcement came late due to the government awaiting budget approval. Thus, halfway through the season, an additional supply of fertilizer was distributed. However, the price was quite attractive to traders who purchased a large quantity of product and smuggled it across the border into neighboring landlocked countries where profits are higher. Two of the major importers utilized their imported product as raw material to blend the fertilizer for maize farmers (the largest crop produced in Nabanda). Due to delays at the port, a significant percentage of their product was not able to be blended before the rains fell. Thus, this product will remain in storage for next year’s farming season. The other three private-sector importers (two of which participated in the government tender) sold all of their product to five key distributors in the country. These distributors had large amounts of urea (a nitrogen-based product) in their warehouses from the previous year so their warehouses increased the amount of product in storage, but could not get enough fertilizer to satisfy farmer demand. At the end of the year, the Customs office declared that 325,000 metric tons of fertilizers reached smallholder farmers during the year. The Ministry of Agriculture highlighted the 75,000 metric tons had a major impact on the yield of smallholder farmers. Simultaneously, the National Bureau of Statistics reported that 50% of the states in Nabanda did not have enough product to meet the needs of the maize farmers during the year. Most likely, your head is swirling with numbers. This is a typical example of issues that create confusion when trying to understand how much fertilizer was actually utilized by farmers during the year.
Where Does the VIFAA Program Get the Necessary Fertilizer Data for its Dashboards?
Keeping in mind the case study of Nabada, early in the program we realized that if VIFAA dashboards are to be used in decision making, they need a strong data provider with deep roots in public and private sector partnerships to access quality data. Therefore, in 2019, the International Fertilizer Development Center’s (IFDC) AfricaFertilizer.Org (AFO) initiative joined the VIFAA program and AFO is now the main source of data for VIFAA dashboards. VIFAA- AFO partnership has been crucial in ensuring that data from both the public and private sector are brought forward and reliably sourced in the dashboards.
AFO was started in 2009 to address the gaps in fertilizer data on availability and market information in sub-Saharan Africa (SSA) with the goal of increasing fertilizer nutrient use to 50Kg/Ha. Over the years, AFO has worked to consistently collect, process, and publish official national statistics on production, trade, consumption, and price.
AFO collects this data in three ways:
1. Direct collection through consultants and field data collectors
2. Partnerships and data sharing agreements with market analysis firms, government ministries, customs, and revenue authorities, and from private sector companies that enable it to gather so much important data
3. Initiatives such as national Fertilizer Technical Working Groups (FTWGs).
As the case study of Nabada highlights above, many stakeholders have information about how much fertilizer was consumed in a given year, but in their own silos. FTWGs provide a crucial mechanism for understanding how much fertilizer was consumed, by bringing together stakeholders from the public and private sector to triangulate the existing fertilizer data. Depending on the country, the FTWG typically represents the customs office, the port authority, the ministry of agriculture, the national bureau of statistics, and key private sector representatives. The FTWG meetings usually take place during the first quarter of the year when government data becomes available for the previous year. The FTWG representatives spend two days going through each organization’s data to resolve differences between the various organizations and identify the “apparent consumption” amount for that year, which all stakeholders can agree to. This allows all stakeholders both public and private sector to understand the market situation, agree on a common set of data, and better prepare for the needs in the upcoming season.
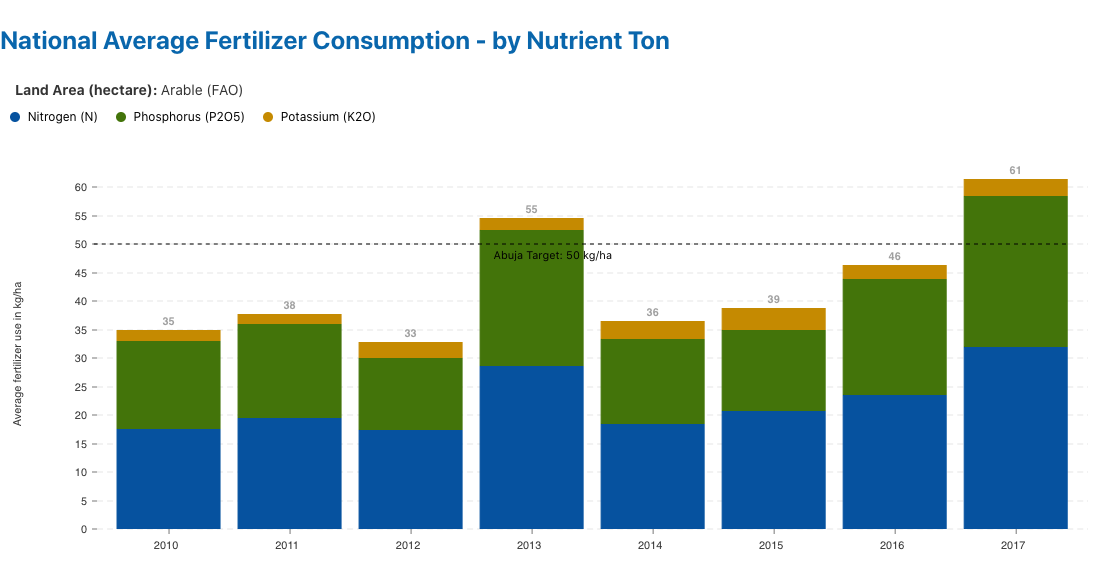
This apparent consumption data, collected by AFO at the FTWG meetings is the very same one used in the numerator of the fertilizer sector’s most important high-level indicator – Kg/Ha. VIFAA visualizes both the apparent consumption and the national average fertilizer consumption data on the dashboards. VIFAA users in the public sector apply this information to track progress against the fertilizer goals or adjust policies and create incentives for actors in the supply chain as needed. The private sector can apply this information to better plan procurement and imports for the following season.
VIFAA Going Forward
In November 2022, AfricaFertilizer (AFO), our partner on the Visualizing Insights on Fertilizer for African Agriculture (VIFAA) program, rebranded and launched a new website. This website includes the integration of country-specific VIFAA dashboards, which were previously housed in separate websites. By integrating the country-specific dashboards as well as fertilizer data on trade, production, consumption, and retail prices for 18 countries in sub-Saharan Africa, the new AFO data allows easier comparative analysis across countries and contributes its quota to the advancement of food security throughout Africa.
We have updated the previous country-specific dashboards links to now redirect you to AFO’s new website in order to ensure you are accessing the most up-to-date resources.
Share
Related Posts
Understanding Fertilizer Data
Finding reliable agriculture data in sub-Saharan Africa is often difficult. If available at all, data is usually fragmented and tucked away in silos within government ministries or closely held by private companies. It is also significantly delayed or in a format that makes analysis difficult. For stakeholders who need information for decision making, a lack of reliable data is a significant barrier. The Visualizing Insights on Fertilizer for African Agriculture (VIFAA) program is working towards making fertilizer-related data, a key subset of agriculture data, more accessible to stakeholders for decision making.
Why a Fertilizer Dashboard for Kenya?
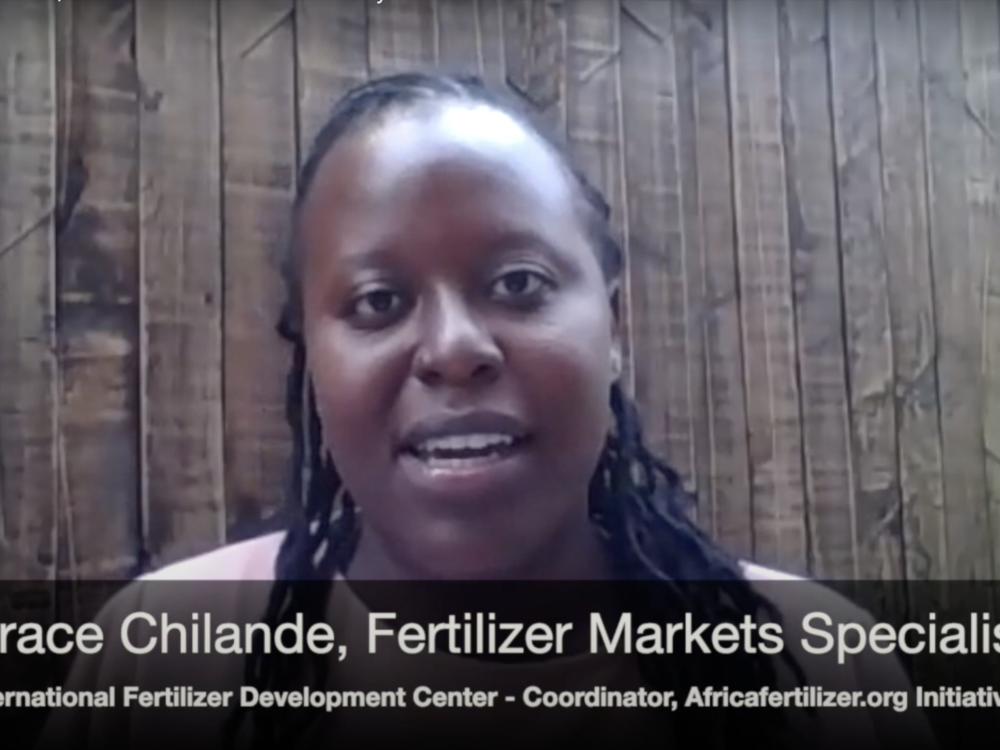
In developing the VIFAA Kenya Dashboard, we worked in partnership with Africafertilizer.org (AFO) and the International Fertilizer Development Center (IFDC) to understand the cycle of demand, supply, and use of Kenya’s fertilizer data. Grace Chilande of AFO and IDFC provides more information on why the dashboard is needed and how it will be used.
Measuring COVID-19’s Impact on the Fertilizer Sector in Sub-Saharan Africa
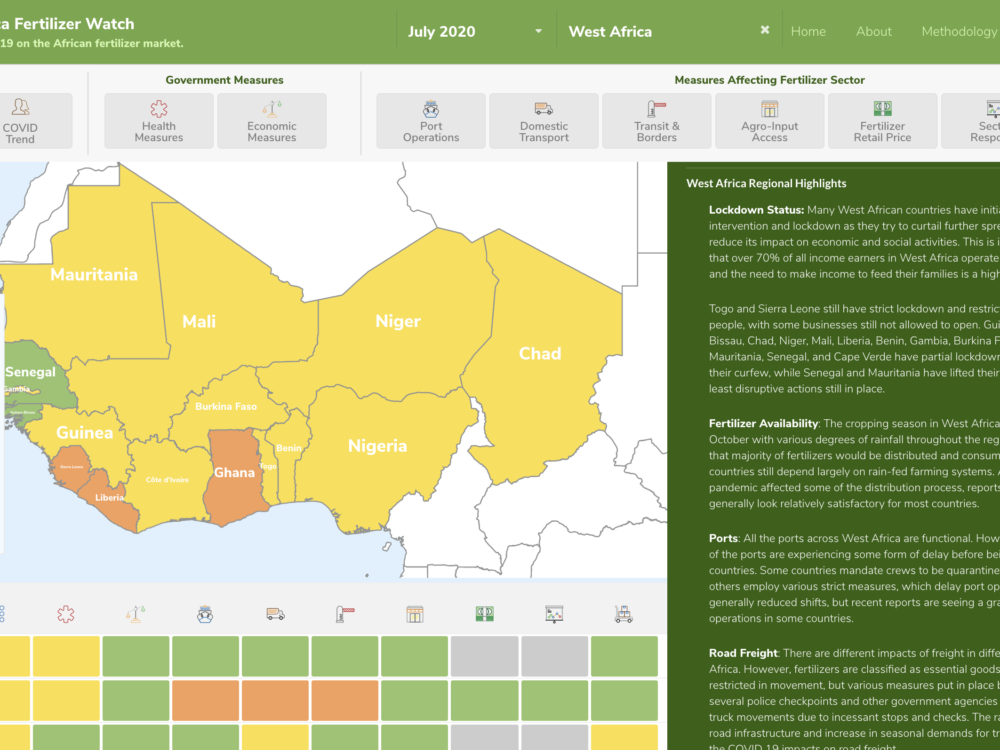
The COVID-19 Africa Fertilizer Watch Dashboard, covering 28 countries across sub-Saharan Africa was launched today. This dashboard uses 11 indicators to track COVID-19 country-specific mitigation measures on the delivery & use of fertilizers to identify impacts on productivity & food security across the continent. The goal of this dashboard is to support efficient and effective responses to the evolving global health emergency, and ensure that sufficient and appropriate fertilizers reach farmers.