New Crisis Monitoring Tool Provides Insight into Sub-Saharan Africa’s Fertilizer Sector
Background
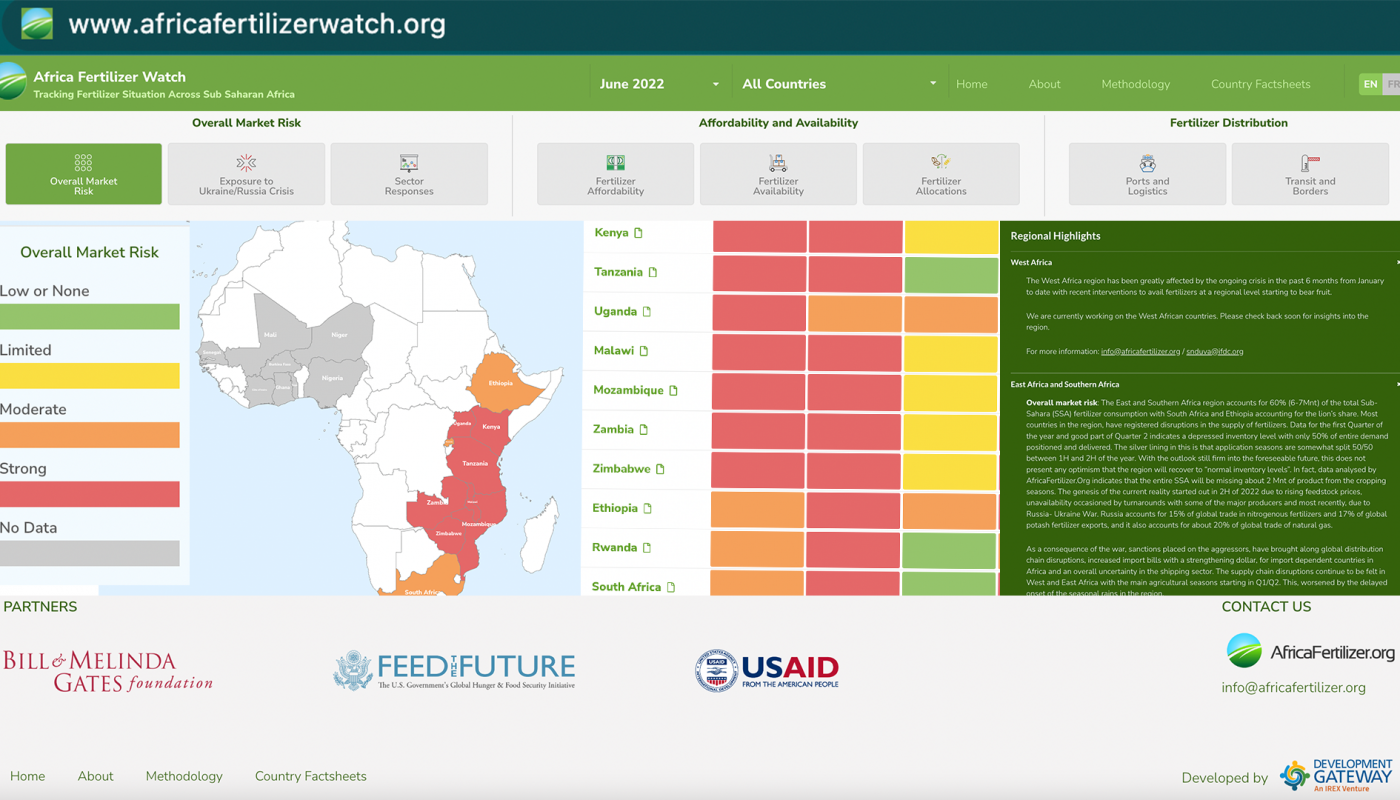
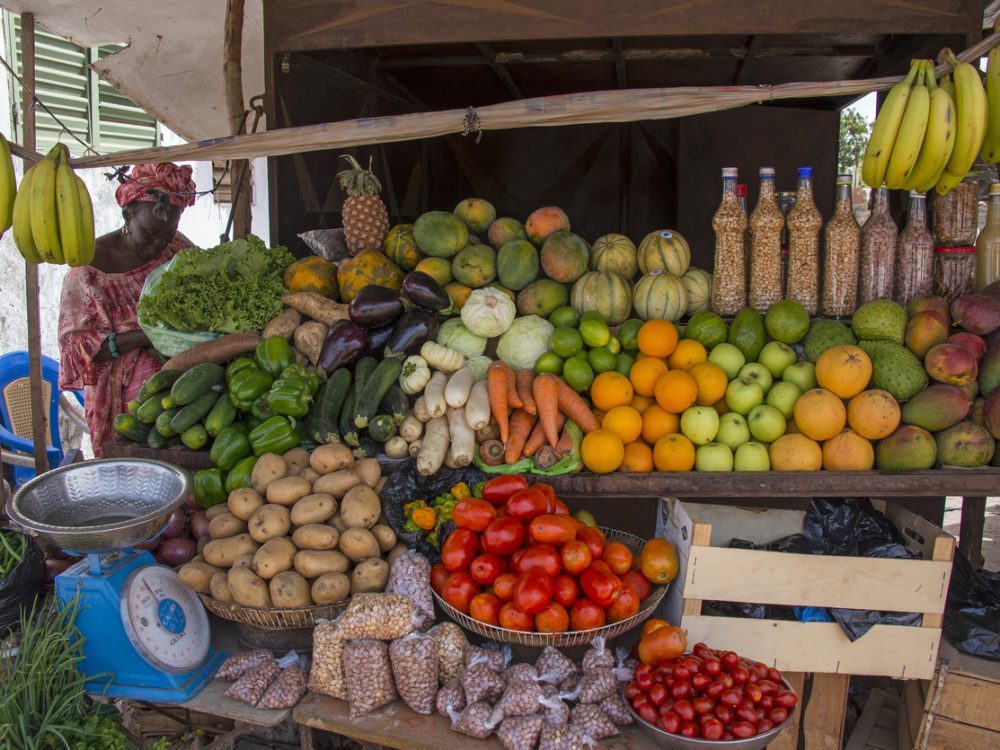
On July 24, Development Gateway: an IREX Venture (DG), the International Fertilizer Development Center (IFDC), and AfricaFertilizer.org (AFO) released an update to the Africa Fertilizer Watch Dashboard, a project which grew out of the AFO and DG’s Visualizing Insights on Fertilizer for African Agriculture (VIFAA) program. The VIFAA Program aims to improve, manage, and visualize fertilizer data in Africa. The Africa Fertilizer Watch Dashboard was originally developed to track COVID-19’s impact on the fertilizer sector. The Dashboard has been updated to cover ten countries in Eastern and Southern Africa and includes added indicators designed to track the impact of the invasion of Ukraine on the delivery and use of fertilizers across the continent. The Africa Fertilizer Watch supports efficient and effective responses to the evolving food and fertilizer crises and ensures that sufficient quantities of appropriate fertilizers reach farmers in time for planting.
Currently, sub-Saharan Africa (SSA) has the lowest fertilizer usage in the world; it is insufficient to replace the soil nutrients lost every year to crop production. In addition, huge demographic shifts in SSA could have a major impact on food security. Understanding where and how barriers to fertilizer access and availability are affecting farmers is crucial for agricultural productivity.
The Africa Fertilizer Watch was developed through a partnership between IFDC’s AFO initiative and Development Gateway. It is jointly funded by the U.S. Agency for International Development (USAID) Bureau for Resilience and Food Security, through the Feed the Future Soil Fertility Technology Adoption, Policy Reform, and Knowledge Management under the Sustainable Opportunities for Improving Livelihoods with Soils (SOILS) Consortium, and the Bill & Melinda Gates Foundation, through the Visualizing Insights on Fertilizer for African Agriculture (VIFAA) program. Other technical partners include the African Fertilizer and Agribusiness Partnership (AFAP) and AFRIQOM.
Russia is the world’s largest exporter of fertilizers. Given that the continent of Africa relies on Russia for some of its fertilizer needs, the Africa Fertilizer Watch monitors the impact of the Russian invasion of Ukraine on fertilizer market systems in SSA. Other key indicators are related to the affordability and availability of fertilizer within the SSA region.
Africa Fertilizer Watch: Tracking the Fertilizer Situation Across Sub-Saharan Africa
The Africa Fertilizer Watch is publicly available online and monitors eight indicators: overall fertilizer market risk with regard to stock levels and supply anomalies, availability, affordability, and distribution measures to track and visualize the invasion of Ukraine’s impact on access and use of fertilizers across Africa. It also monitors:
- how countries are allocating fertilizer, whether for food production or otherwise, in light of the global fertilizer crisis
- countries monthly inventory level
- government responses to the ongoing crisis
- and fertilizer-specific measures and/or logistical issues affecting the movement of fertilizers from ports to farms (ports, roads, borders, retail, stocks, and sector-wide responses).
Data on the war in Ukraine is obtained from various public press releases. Overviews of market risk, affordability/availability, and distribution bottlenecks are informed by direct communications from fertilizer stakeholders and regional fertilizer associations, government agencies, local media, and other relevant trackers. The Africa Fertilizer Watch data is periodically updated as needed or as new information is available. More information about the methodology can be found on the Africa Fertilizer Watch website.
Project Partners
International Fertilizer Development Center (IFDC) – As an independent non-profit organization, IFDC works throughout Africa and Asia to increase soil fertility and develop inclusive market systems. Combining science-backed innovations, an enabling policy environment, holistic market systems development, and strategic partnerships, the organization bridges the gap between identifying and scaling sustainable agricultural solutions, resulting in improved household food security and enriched family livelihoods around the world. Using an inclusive approach, IFDC employs locally driven solutions that are environmentally sound and impact oriented that bring change at local, regional, and national levels.
Sustainable Opportunities for Improving Livelihoods with Soils (SOILS) Consortium – IFDC has implemented the USAID-funded Bureau for Resilience and Food Security Feed the Future Sustainable Opportunities for Improving Livelihoods with Soils (SOILS) Consortium (BRFS-SFT-SOILS) program since 2015. The project bridges the gap between scientific research and technology dissemination to smallholder farmers. BRFS-SFT conducts research with partners from universities, national and international research and development institutions, and the private sector. The overall goal of SOILS is to offer practical, profitable, scale-appropriate soil, and land-use management technologies and recommendations for healthier and productive farming systems globally. SOILS priority areas include developing and transferring soil fertility technologies that improve nutrient use efficiency, in alignment with the 4Rs of Nutrient Stewardship: right source, right time, right rate, and right place. This is achieved by strengthening inorganic fertilizer-based systems and promoting integrated soil health and fertility management practices for optimal economic returns, focusing on smallholder cropping systems.
AfricaFertilizer.org (AFO) – the premier source for fertilizer statistics and information in Africa. It is hosted by IFDC and supported by several partners, key among them being the International Fertilizer Association (IFA), Argus Media, and the Bill & Melinda Gates foundation through Development Gateway under the VIFAA program. Since 2009, AFO has been collecting, processing, and publishing fertilizer production, trade, and consumption statistics for the main fertilizer markets in sub-Saharan Africa. AFO has an extensive network of fertilizer industry players in the main fertilizer trade corridors and maintains key information on the major producers, their production facilities and capacities, importers/suppliers, and various distribution channels.
African Fertilizer and Agribusiness Partnership (AFAP) – an independent non-profit organization founded in 2012 by a partnership of African development organizations. It was built on the work of the Comprehensive Africa Agriculture Development Programme (CAADP), a framework for achieving ambitious agriculture development goals set by African nations and leaders. AFAP implements sustainable development projects and advises the public sector, private sector clients, non-governmental organizations (NGOs), and donors on policies and market-driven business solutions in the agriculture inputs and agribusiness value chain. AFAP is a technical partner of the Africa Fertilizer Watch.
AFRIQOM – an independent privately held firm that provides market research, analytics, trading intelligence, and consultancy studies, with a focus on African fertilizer markets. By doing so, and being the leaders on the continent, AFRIQOM brings transparency to an opaque market to help and contribute to an Africa Green Revolution. AFRIQOM has recently launched the AFRIQEVENTS program, in partnership with major associations, for conferences around the continent that offer a novel platform to develop the fertilizer consumption rate in Africa.
This blog is a press release jointly written with IFDC and AFO.
VIFAA Going Forward
In November 2022, AfricaFertilizer (AFO), our partner on the Visualizing Insights on Fertilizer for African Agriculture (VIFAA) program, rebranded and launched a new website. This website includes the integration of country-specific VIFAA dashboards, which were previously housed in separate websites. By integrating the country-specific dashboards as well as fertilizer data on trade, production, consumption, and retail prices for 18 countries in sub-Saharan Africa, the new AFO data allows easier comparative analysis across countries and contributes its quota to the advancement of food security throughout Africa.
We have updated the previous country-specific dashboards links to now redirect you to AFO’s new website in order to ensure you are accessing the most up-to-date resources.
Share
Related Posts
From Data Gaps to Impact: Key Insights from the VIFAA Program
Over the last six years, DG, together with its partners AfricaFertilizer (AFO) and Wallace & Associates, collaborated to implement the Visualizing Insights on Fertilizer for African Agriculture (VIFAA) Program. In the program’s final year (2024), the team undertook a “program learning process” to reflect on outcomes, challenges, and successes through internal interviews. This blog captures five key learnings, which we hope will guide similar programs aiming to bridge data gaps in agricultural development.
Case Study: Fostering Sustainable Agriculture through Data-Driven Collaboration and Partnership: Ethiopia, Mozambique, and Nigeria
Through DG’s Visualizing Insights on Fertilizer for African Agriculture (VIFAA) program, we recently published a case study titled “Fostering Sustainable Agriculture through Data-Driven Collaboration and Partnership: Ethiopia, Mozambique, and Nigeria.” It dives deep into how the VIFAA program has impacted the fertilizer data and markets in Ethiopia, Mozambique, and Nigeria. In this blog, we explore the overall impact that the VIFAA program is making, why the program was needed, and offer some key highlights from the case study.
Fertilizer Technical Working Groups Provide Key Insights into Africa’s Fertilizer Sector
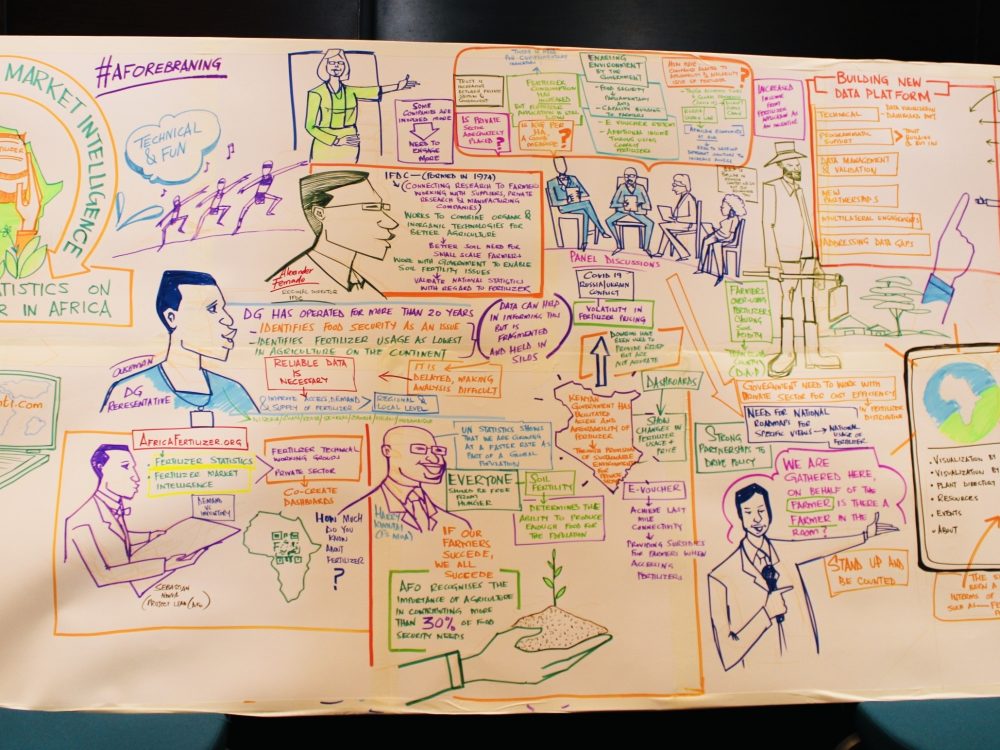
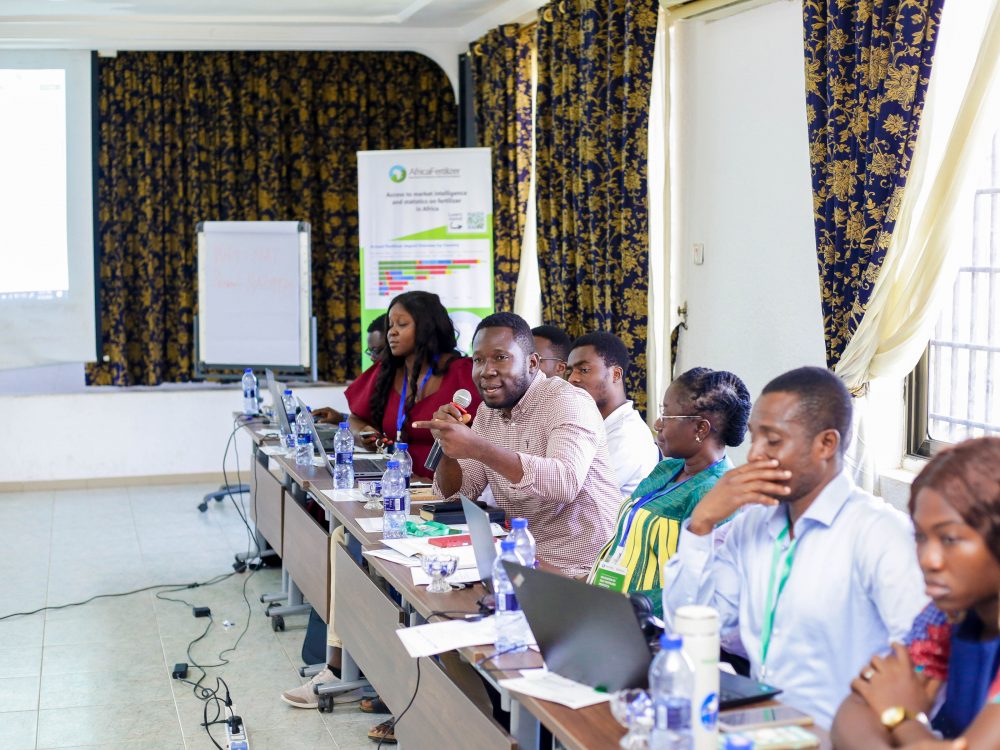
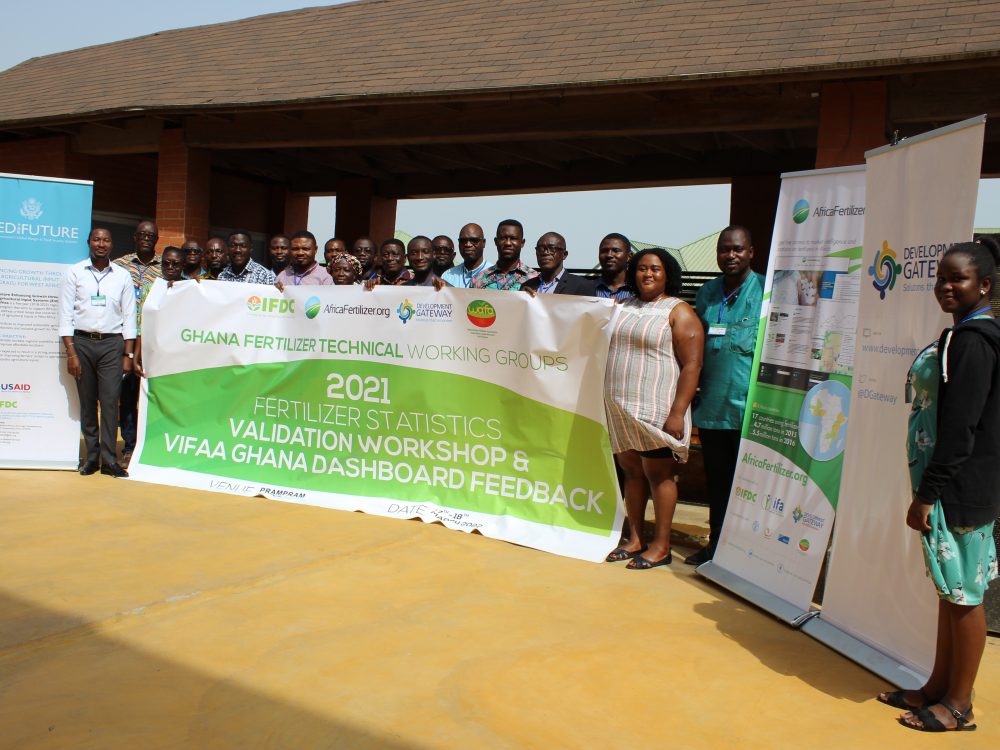
From June 2021 to September 2022, Development Gateway: An IREX Venture’s (DG’s) Visualizing Insights on Fertilizer for African Agriculture (VIFAA) program convened 12 Fertilizer Technical Working Groups in 14 countries which have yielded essential information on Africa’s fertilizer sector, including insights on how geopolitical events have impacted the fertilizer sector and what is needed to mitigate resulting threats to food security throughout Africa.
Filling Tobacco Control Data Gaps in Nigeria
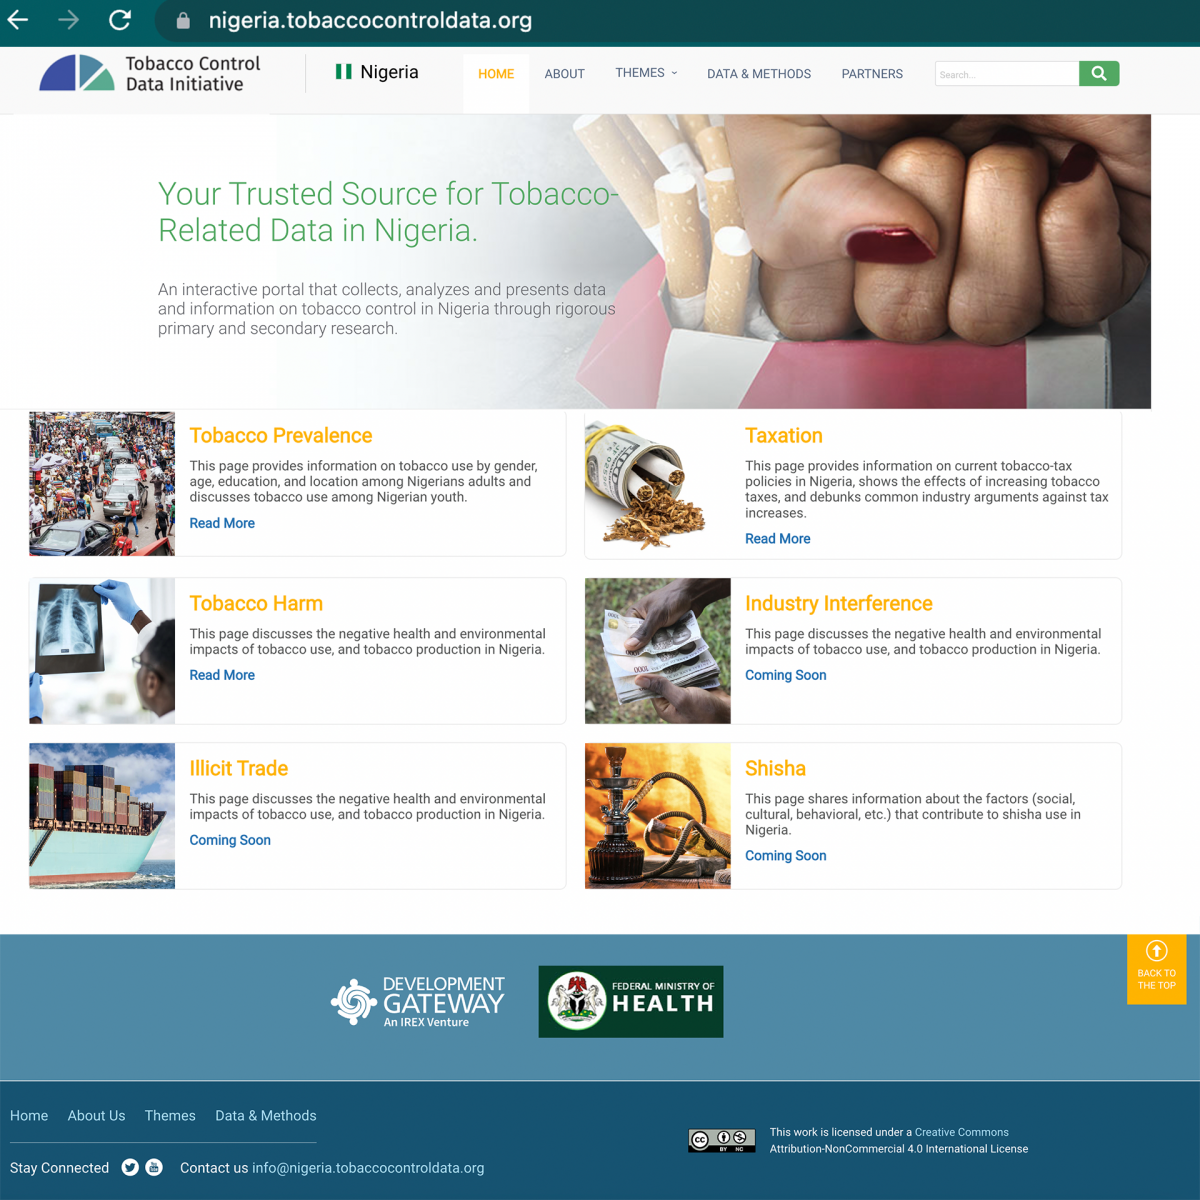
Last week, in partnership with the Ministry of Health of Nigeria and the University of Cape Town, Development Gateway (DG) launched the Tobacco Control Data Initiative (TCDI) Nigeria Dashboard. The Dashboard is a website that is a “one-stop-shop” to access the relevant data that Nigeria’s policymakers need to advance tobacco control legislation.
In June, DGers Aminata Camara Badji, the West & Central Africa Coordinator for TCDI, and Seember Ali, DG’s Nigeria Country lead for TCDI, sat down for a conversation about the Dashboard and its usability for stakeholders.
Meeting Stakeholder Needs
During the initial assessment, stakeholders frequently described needing data but did not know where to find it or if it could be trusted. The Dashboard is designed to meet this need with validated and reliable information around prevalence, taxation, and tobacco harm. Three other topics: industry interference, illicit trade, and shisha will be finalized and on the dashboard by the end of 2022.

TCDI has worked to ensure the Dashboard will be both easy for stakeholders to use and that it contains relevant information. Stakeholders were particularly interested in Nigeria-specific information or examples of other countries in Africa.

Unique Features
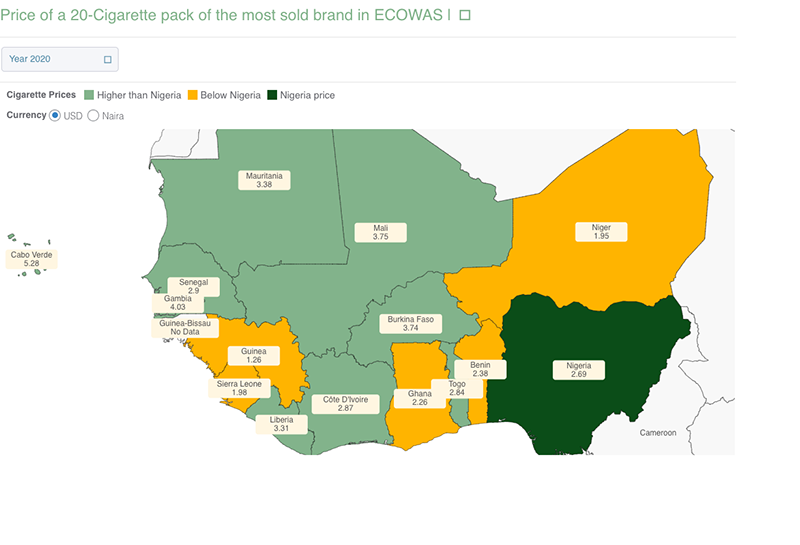
One unique feature is a map of cigarette prices across ECOWAS countries over time. This feature allows stakeholders to compare policy decisions across similarly-situated countries and their impacts.

The Dashboard features Nigeria-specific data on prevalence, taxation, tobacco harm, industry interference, illicit trade, and shisha.
The Dashboard features South Africa-specific data on prevalence, taxation, illicit trade, health, impact of policy, e-cigarettes, and agriculture.
Share
Related Posts

The Cancer-Tobacco Link: Using Data to Drive Stronger Tobacco Control Policies
As we observe World Cancer Day today, it is crucial to recognize the significant role smoking plays in the global cancer epidemic. Tobacco use is the leading preventable cause of cancer and cancer-related deaths worldwide, necessitating a dynamic, multidisciplinary approach to tobacco control interventions. DG’s Tobacco Control Data Initiative (TCDI) contains country-specific websites designed to
Stakeholder, Where Art Thou?: Three Insights on Using Governance Structures to Foster Stakeholder Engagement
Through our Tobacco Control Data Initiative (TCDI) program and its sister program Data on Youth and Tobacco in Africa (DaYTA), we have learned that creating governance structures, such as advisory boards or steering committees, is one approach to ensuring that digital solutions appropriately meet stakeholders’ needs and foster future stakeholder engagement. In this blog, we explore three insights on how governance structures can advance buy-in with individual stakeholders while connecting them to one another.
Raising Awareness on World No Tobacco Day 2024: DaYTA/TCDI’s Work on Tobacco Industry Interference
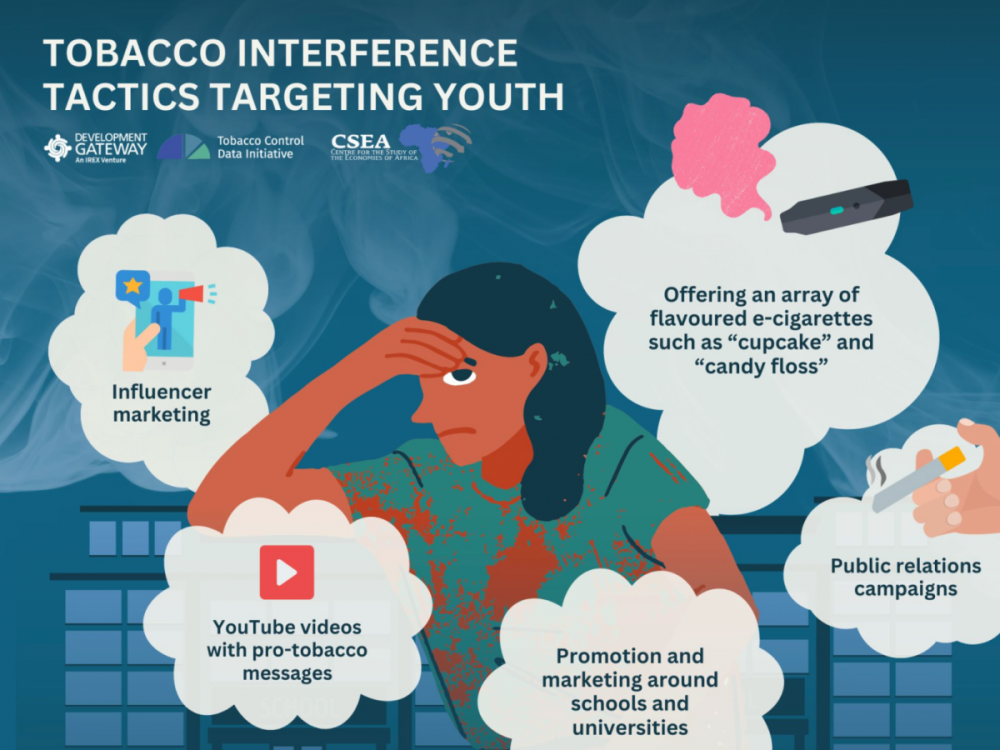
As tobacco companies have aggressively deployed creative strategies to market retail nicotine and tobacco products at children and adolescents, it is imperative that tobacco control stakeholders have access to timely and high-quality data to inform robust policies, regulations, and enforcement mechanisms.
Advancing Tobacco Control in Nigeria: The TCDI Website
In response to the impending threat of increased tobacco use in Nigeria and the various dangers that accompany it, the Tobacco Control Data Initiative Website creates a “one-stop-shop” to access the relevant data that Nigeria’s policymakers need to advance tobacco control legislation.
28 June, Abuja, Nigeria – Since 2019, Development Gateway (DG) has collaborated with University of Cape Town’s Research Unit on the Economics of Excisable Products (REEP) to address barriers to data use in tobacco control by consolidating available and trusted tobacco control data, identifying and filling data gaps, and creating an online resource for policymakers to access the relevant data needed to pass and monitor tobacco control legislation. These findings have come together through the Tobacco Control Data Initiative (TCDI), which is supported in partnership with the Bill & Melinda Gates Foundation and implemented in Nigeria in addition to South Africa, Kenya, Ethiopia, Zambia, and the Democratic Republic of the Congo.
Why TCDI?
At least 16,100 Nigerians die annually because of illnesses linked to tobacco use. 3.2 million Nigerians between the ages of 15 and 49 used tobacco in 2018; and about 200,000 tobacco users are women (NDHS, 2018). While tobacco consumption globally is decreasing, by 2030 the number of smokers in Africa is anticipated to rise by nearly 40% from 2010 levels. This is the largest expected increase in the world; particularly alarming when juxtaposed with the fact that Nigeria is a tobacco production hub and was the third largest exporter of cigarettes in 2018 (Africa’s Tobacco Epidemic, Tobacco Tactics, 2020). Even though there seems to be a downward trend of tobacco use in Nigeria, the World Health Organization (WHO) warns this should not cause complacency in tobacco control efforts as studies show that the tobacco industry is ramping up efforts in Africa to attract new smokers, especially among the predominantly young population. Strong tobacco control measures are needed to ensure that smoking rates do not increase.
Certain legislative policies are proven to reduce the use of tobacco products. Through their research, the TCDI team identified common themes in the data landscape. These relate to concerns about data accuracy, comparability, timeliness, and accessibility. As a result, the TCDI team understands the data needs and gaps, has identified existing data, and developed the TCDI Nigeria website that enables decision-makers to use essential data to inform tobacco control policy more effectively.
Together, partners co-designed a publicly available website (https://nigeria.tobaccocontroldata.org/) that aims to address key decision-making needs. The website equips stakeholders in government, civil society, academia, and the general public with reliable and up-to-date evidence to promote tobacco control and public health. It draws on both primary and secondary data sources and presents tobacco control information in user-friendly formats such as graphs, infographics, myths and facts, and success stories. The website will feature six themes: tobacco prevalence, tobacco harm, illicit trade, taxation, industry interference, and shisha use. The website will be updated with new information as this becomes available over the course of the program.
The Development Process
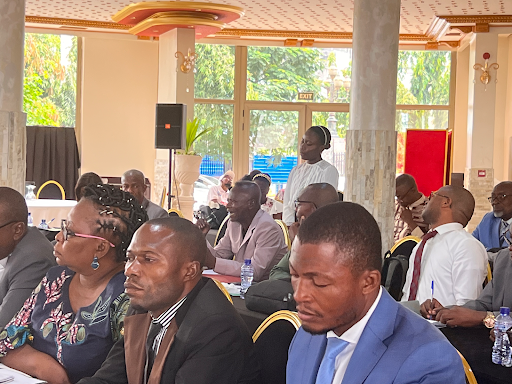
Before creating the TCDI Nigeria website, the TCDI team assessed the existing data and stakeholder needs through hour-long interviews with key members of the tobacco control community. The learnings from the assessment were validated with stakeholders during a workshop in November 2020 before technical development was started in early 2021. The website was created through an agile, co-design process in close consultation with key tobacco control stakeholders in Nigeria, including the Federal Ministry of Health; Nigerian Tobacco Research Group, Federal Revenue Inland Services. (Find the full list of our stakeholders and partners here.) Initial mockups and website designs were shared back with stakeholders for their input and suggestions. As a final step before launching the site, a last validation workshop with stakeholders was led by the Federal Ministry of Health in March 2022. The Federal Ministry of Health approved the finalized website prior to launch in May 2022.
About the Partners
Development Gateway: An IREX Venture (DG)
Development Gateway provides data and digital solutions for international development. DG creates tools that help institutions collect and analyze information; strengthen the institutional capacity to use data; and explore what processes are needed to enable evidence-based decisions. A mission-driven nonprofit since 2000 with staff based in five global hubs and around the world, DG supports the use of data, technology, and evidence to create more effective, open, and engaging institutions. More at www.developmentgateway.org.
Federal Ministry of Health, Nigeria (FMOH)
The Federal Ministry of Health is concerned with the formulation and implementation of policies related to health with the mandate of providing quality stewardship and services for the health of all Nigerians. Its vision and mission as a world-class government institution is to ensure a healthy Nigeria to develop and implement policies that strengthen the national health system for effective, efficient, accessible and affordable delivery of health services in partnership with other stakeholders. More at www.health.gov.ng.
University of Cape Town’s Research Unit on the Economics of Excisable Products (REEP)
REEP focuses its research on economic aspects related to a variety of excisable products, including tobacco, through its Economics of Tobacco Control Programme, which aims to enhance the knowledge of economic and tax issues among tobacco control advocates and policymakers, and to strengthen support for tobacco tax and price increases in low- and middle-income countries.
Share
Related Posts
The Cancer-Tobacco Link: Using Data to Drive Stronger Tobacco Control Policies
As we observe World Cancer Day today, it is crucial to recognize the significant role smoking plays in the global cancer epidemic. Tobacco use is the leading preventable cause of cancer and cancer-related deaths worldwide, necessitating a dynamic, multidisciplinary approach to tobacco control interventions. DG’s Tobacco Control Data Initiative (TCDI) contains country-specific websites designed to
Stakeholder, Where Art Thou?: Three Insights on Using Governance Structures to Foster Stakeholder Engagement
Through our Tobacco Control Data Initiative (TCDI) program and its sister program Data on Youth and Tobacco in Africa (DaYTA), we have learned that creating governance structures, such as advisory boards or steering committees, is one approach to ensuring that digital solutions appropriately meet stakeholders’ needs and foster future stakeholder engagement. In this blog, we explore three insights on how governance structures can advance buy-in with individual stakeholders while connecting them to one another.
Raising Awareness on World No Tobacco Day 2024: DaYTA/TCDI’s Work on Tobacco Industry Interference
As tobacco companies have aggressively deployed creative strategies to market retail nicotine and tobacco products at children and adolescents, it is imperative that tobacco control stakeholders have access to timely and high-quality data to inform robust policies, regulations, and enforcement mechanisms.
Voices of the Cashew Sector – André M. Tandjiekpon
In 2020, Development Gateway (DG) partnered with Cultivating New Frontiers in Agriculture (CNFA) under the USDA West Africa PRO-Cashew project to develop the Cashew-IN data collection and analysis platform.
The project has identified gaps in the data collection, storage, usage and dissemination related to the cashew sector in all five of the implementing countries (Côte d’Ivoire, Benin, Burkina Faso, Ghana, and Nigeria). The project is now working to address these gaps through a multi-country cashew data management system (Cashew-IN) that will facilitate access to and use of data to improve decision-making for policymakers, farmers, and the private sector. The ultimate goal is to generate better market outcomes for cashew nuts in these countries.
André M. Tandjiekpon, Executive Secretary of the Consultative International Cashew Council (CICC), gives an overview of CICC’s work and explains how the Cashew-IN platform developed by CNFA and DG will support his work.

In a few words, what’s the CICC?
The CICC is an international organization for the promotion of cashew value chains that currently has 11 member states, including Benin, Burkina Faso, Cameroon, Côte d’Ivoire, Ghana, Guinea, Guinea Bissau, Mali, Nigeria, Senegal, and Togo. Created in 2016, its objective is to provide a framework for consultation and promotion of the cashew sector through policy coordination and cooperation among member states.
What is your ambition for the cashew sector over the next five years?
The CICC’s ambition is to bring together States that collectively hold at least 80% of the world’s cashew nut production to increase the processing capacity installed and used to at least 40% in African countries, to influence the international governance of the sector by harmonizing attractive, and to secure policies to increase private investment.
How can the Cashew-IN tool help you achieve your objectives?
The Cashew-IN tool will contribute to the availability of reliable statistical data and information on the development of the sector in terms of production, processing, marketing, and consumption. Additionally, Cashew-IN will support the decisions of member states on policy issues, as well as, public and private actors to increase and secure investments in the sector.
This interview was edited for clarity and style.
To learn more about Cashew-IN, check out our Cashew-IN program playlist on YouTube.
For any questions or comments, please reach out to Constance Konan at ckonan@developmentgateway.org
Partners
USDA
The U.S. Department of Agriculture is a federal department that provides leadership on food, agriculture, natural resources, rural development, nutrition, and related issues based on public policy, the best available science, and effective management. Through their PRO-Cashew project, USDA is working to boost the competitiveness of West African producers by improving efficiency and quality in production and trade, and by working to develop more coherent regional trade and investment policies.
CNFA
Cultivating New Frontiers in Agriculture is an international agricultural development organization that specializes in the design and implementation of sustainable, enterprise-based agricultural initiatives. We work with businesses, foundations, governments, and communities to build customized local and global partnerships that meet the world’s growing demand for food. Since its inception in 1985, CNFA has designed and implemented enterprise-based, agricultural development initiatives to facilitate market access, enhance agribusiness competitiveness, increase productivity, and improve access to inputs and financing in 47 countries around the world.
Share
Recent Posts

Three Fundamentals for Climate and the Future of Health
Climate change is no longer a distant environmental concern; it is a growing public health challenge. Reflecting on discussions during London Climate Action Week, this blog explores why stronger investment, cross-sector collaboration, and better data are essential to building climate-resilient health systems.

(inter)National Models for Women’s Safety Online
Development Gateway and IREX spent the last year analyzing how different nations approach the "how-to" of online safety regulations. This blog discusses our research, which suggests that the most effective models go beyond reactionary and punitive measures to facilitate a functional ecosystem of trust and accountability.
From Ambition to Adoption: Reflections on AI in Higher Education in Kenya and Jordan
Higher education institutions are being asked to move beyond AI experimentation toward meaningful adoption. Drawing on a strategic dialogue in Nairobi, this blog explores how universities can bridge that gap through AI sovereignty, partnerships & practical adoption priorities.

How IREX and DG’s Data Ecosystem Assessment Tools Advance Local Priorities
IREX and Development Gateway each bring unique tools and expertise to their strategic partnership that expand the range of resources available to support local leaders and communities around the world. Both organizations place a high value on identifying the solutions most relevant to local contexts, which helps us partner seamlessly. This is illustrated in the complementary assessment tools for institutional data ecosystems—IREX’s Data Compass and Development Gateway’s Custom Assessment Landscaping Methodology (CALM).
Both IREX and Development Gateway believe that a strong data ecosystem can support an institution’s ability to systematically increase their impact, particularly at the sub-national and local levels. An institution’s data ecosystem reflects their unique data infrastructure environment (i.e., systems and resources that support the consumption and production of data), staff and their skill sets, processes and policies which work together towards creating value from data, and in some instances, help other stakeholders (e.g., civil society, academia, government, international organizations, private sector, and individual citizens) to benefit from it. Addressing local challenges and issues demands vibrant engagement between these diverse elements to continuously inform activities and adapt to evolving conditions. For local institutions with limited resources to invest, having a clear awareness of the key barriers fostering inefficiencies and opportunities for improvement can facilitate sustainable impact to meet their unique local priorities.
What are data ecosystem assessments?
In global development, there are a wide range of data ecosystem assessment tools that differ in methodology, outputs, and objectives. Some, like Data Compass and CALM, look into how an organization uses data for a specific issue. Others analyze how organizations contribute to data use across a sector (e.g., health or education) or across a system on a specific thematic focus (e.g., transparency or digital ecosystems). The various data assessment tools produce different outputs because there is not much consensus, with the exception of data infrastructure, policies and processes, on which elements and details are important to incorporate when analyzing a data ecosystem. Many of the tools also do not center local priorities. While Data Compass and CALM each produce different outputs based on different needs, both emphasize a methodology that prioritizes local collaboration and development to produce insights and outputs that reflect local priorities and actionable recommendations that institutions can own and implement.
The following adaptive and collaborative exercises are specific examples of how Data Compass and CALM assess data ecosystems to support institutions with activities that are actionable and solutions that are sustainable:
- Mapping the ecosystem and defining the root problem,
- Interviewing local staff and stakeholders,
- Conducting a technical assessment and validating findings, and
- Identifying recommendations and designing solutions with the institution.
What is the Data Compass?
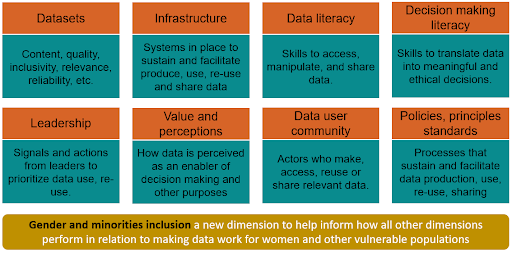
Data Compass assesses eight dimensions of data use relevant to a specific challenge or issue with which an organization routinely deals in order to inform how data is being used to make decisions around the issue, understand it better, learn from it, and/or seek relevant solutions. The dimensions include datasets; infrastructure; data literacy; decision-making literacy; leadership; value and perception; data user community; policies, principles, and standards; and a cross-cutting gender and social inclusion dimension. Rather than providing a prescriptive list of expected capacities, the assessment considers organizations’ unique operating environment, priorities, and limitations.
The final assessment of each dimension informs the “direction” of the activities, providing dimensions with the highest priority of investment for sustainable results, recommendations to achieve those results, baseline metrics to monitor progress, and an action plan designed with local leaders and staff they can commit to implement.
Case study for Data Compass
As part of the Data Zetu project in Tanzania, funded by the Data Collaboratives for Local Impact (DCLI), IREX was commissioned to use Data Compass to assess the ability of rural health facilities to use data as part of the Direct Health Facility Financing system rollout, and provide recommendations that would help facilities maximize the use of the system.
What is CALM?
CALM focuses on assessing the data landscape that an organization operates within to support the organization on their journey to enable better data-driven decision-making, specifically through digital transformation, process improvements, or strategic investments in data. CALM maps the organization’s needs to make decisions and then analyzes the business processes and components needed to enable data-driven decision-making. These components include data availability, quality, and interoperability; capacity and skills; and authority/agency for change. CALM pairs research methods with mixed-methods evaluation tools for user-centered solutions that are anchored by the organization’s strategic priorities, combined with the staff’s needs to make decisions to advance those priorities. The final products from a CALM assessment include:
- A data landscape analysis that identifies the context, opportunities, and challenges for data-driven decision-making,
- An action plan for strategic investments and improvements,
- User journeys based on key personas that can be applied for improvements to the technology and business process improvements,
- Design of data or digital strategies, and
- Design of technology solutions (such as MIS tools or dashboards) and data reporting or management process.
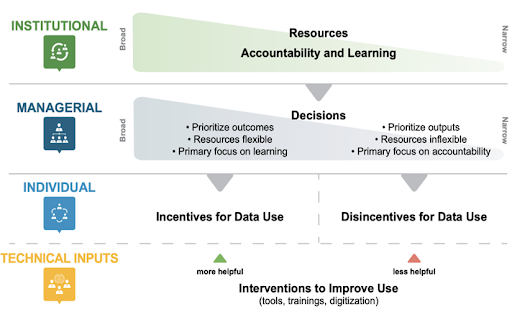
Image 2: Decision-making spaces analyzed with CALM during ecosystem landscapes
Case study for CALM
Development Gateway collaborated with Malawi’s Ministry of Agriculture to complete a landscape analysis of the agriculture sector. Through desk research and key stakeholder interviews, the team mapped the priority decisions, existing data, existing tools, and barriers for data use within the agriculture sector. This information was then used to design the National Agriculture Management Information System (NAMIS).
How do these tools advance local priorities?
Data Compass and CALM are intended for different contexts and produce different outputs, but both meaningfully prioritize collaboration at the sub-national and local levels directly to develop solutions and advance local priorities, which fosters more sustainable impact. This is achieved in the following ways:
- The tools are flexible and customized to the priorities articulated by local leaders.
- Data collection processes ensure accessibility and inclusiveness reflective of the local environment and community.
- Reasonable recommendations are informed by recurring feedback loops with diverse stakeholders.
- Local leadership identifies and commits to the activities to invest.
As the strategic partnership between IREX and Development Gateway unfolds, both organizations are exploring ways to incorporate each of these tools into their projects. Ultimately, Data Compass and CALM will be used to expand IREX and Development Gateway’s contributions to the data ecosystem assessment landscape and advance local priorities with their partner institutions.
Share
Recent Posts
Three Fundamentals for Climate and the Future of Health
Climate change is no longer a distant environmental concern; it is a growing public health challenge. Reflecting on discussions during London Climate Action Week, this blog explores why stronger investment, cross-sector collaboration, and better data are essential to building climate-resilient health systems.
(inter)National Models for Women’s Safety Online
Development Gateway and IREX spent the last year analyzing how different nations approach the "how-to" of online safety regulations. This blog discusses our research, which suggests that the most effective models go beyond reactionary and punitive measures to facilitate a functional ecosystem of trust and accountability.
From Ambition to Adoption: Reflections on AI in Higher Education in Kenya and Jordan
Higher education institutions are being asked to move beyond AI experimentation toward meaningful adoption. Drawing on a strategic dialogue in Nairobi, this blog explores how universities can bridge that gap through AI sovereignty, partnerships & practical adoption priorities.

Measuring digital transformation? Get real.
This piece was originally published by The Data Values Digest. The original post can be found here.
How digitally developed is your organization? If you don’t know, you’re not alone: Despite what many indices, scorecards, and self-assessments would lead you to believe, there’s no single measure of digital transformation—defined as adopting digital technologies to improve efficiency, value, or innovation. As countries embark on digital transformation at a national scale, they need to monitor their progress, evaluate the impact of initiatives, learn from and adapt approaches, and—perhaps most importantly—demonstrate returns on investments. However, even in the private sector, fewer than 15 percent of companies can quantify the return on investment of their digital initiatives.
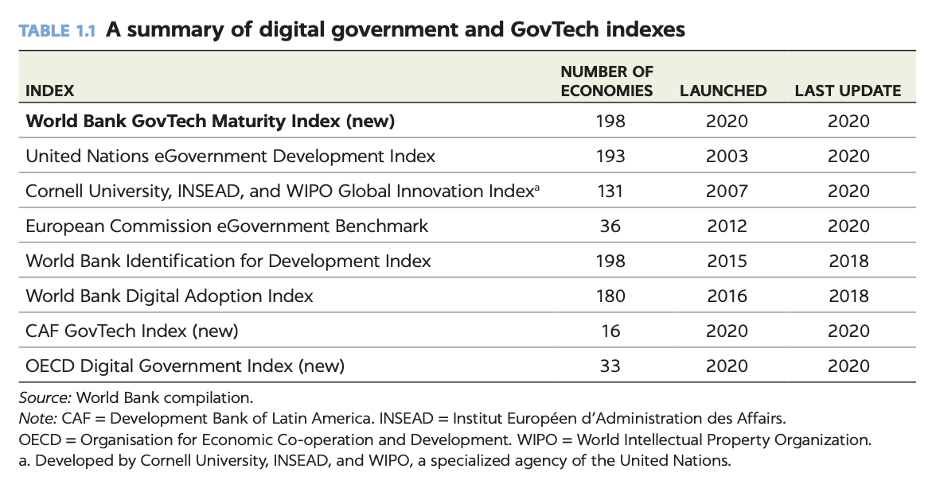
Still, multiple digital transformation indices and self-assessments aim to help countries evaluate their progress and make a case for digital investments (see a sample of these in the chart below). They also, in effect, propose theories for how countries should achieve digital transformation. The problem is that there is no “digital utopia.” For an agenda that is crucial to global development, no single measure of digital transformation presents an objective picture of progress in this area. Understanding the limits of existing measures is key to effectively measuring and targeting investments in digital transformation.
No one-size-fits-all approach
Countries, like companies, have varying baseline capacities for going digital. But many digital transformation measurement frameworks still evaluate countries in terms of rankings or scores compared to other countries. These frameworks assume that a specific recipe of policies, human capacity, physical infrastructure, and data standards will result in successful digital adoption without much evidence to support this theory or even clear examples of what a “successful” digital transformation looks like.
While some evidence suggests that a top-down, whole-of-government approach to digital transformation is ideal, few digital development initiatives are implemented at this scale. To better understand the impacts of digital transformation initiatives, users of these frameworks should be realistic about the aspect of digital transformation that an initiative is targeting and only use metrics that relate to that aspect.
Oversimplifying challenges, especially at the “last mile”
Good intentions to introduce digital technology and data often create and reinforce power imbalances, especially at the last mile. Existing measurement frameworks focus on digital for digital’s sake without a clear connection to improvements in people’s lives such as: Do e-government initiatives result in improved service delivery, even at the “last mile”? How valuable are 5G or e-government services to rural villages with unreliable access to electricity and low levels of digital literacy? How many citizens prefer using digital platforms? Do people trust their government not to abuse digital technologies for surveillance or use their data for nefarious purposes?
Countries and development agencies are becoming increasingly aware of the “last mile” challenges of digital adoption, such as connectivity, literacy, affordability, relevancy, and trust. To better measure the success (or failure) of digital initiatives, measurement frameworks should not oversimplify or understate their impact on people’s daily lives. Some additional, more useful measures of success might include:
- Levels of trust in data and digital technologies,
- Government transparency on uses of data generated from digital services,
- Levels of participation and engagement in data governance agreements, and
- People’s rates of satisfaction with digital tools and services.
Downplaying the impact of bottom-up and locally-led initiatives
Existing digital transformation measures are framed around a top-down, whole-of-government approach, but this isn’t how governments or development initiatives work in practice. Even though the 2020 UN E-Government Survey underscored “the need to conduct separate assessments at the national and local levels,” metrics on digital transformation are typically available only at aggregate, country levels; key disaggregated and subnational data are not available in most countries. For example, data on digital adoption and use is critical to addressing the digital divide between men and women, urban and rural areas, high and low income households, and other groups. Yet, this level of data granularity is rarely made public (if it exists at all).
Local-level assessments of digitalization are rare, and little guidance or evidence exists on how subnational and national digitalization efforts should relate to one another for data and systems interoperability. Small-scale digital transformations at the county, state, or regional levels should not be discounted. This is the level at which digital initiatives are typically implemented and arguably where they have the most potential to impact communities directly.
Digital transformation is still worth measuring.
It’s tempting to simply throw our hands up and say that digital transformation is too complicated and diverse to measure simplistically. But there are compelling reasons to find better ways to measure country’s progress. Such information equips governments and development agencies to make the case for investment and measure impact. It can also help to identify and solve “last mile” challenges.
So how can we do better? When trying to assess the value and impact of digital transformation, we can:
- Be specific and realistic about which problems can be addressed with digital technologies;
- Seek to understand how the presence or absence of a digital tool impacts peoples’ daily lives; and
- Consider the value of alternative approaches to digital transformation, such as those that are locally-led or sector-specific.
As long as transformation measurement frameworks fail to address the realities of “going digital,” understanding returns on investment will continue to evade decision-makers amidst persistent inequalities.
Share
Recent Posts
Development Gateway Collaborates with 50×2030 Initiative on Data Use in Agriculture
Development Gateway announces the launch of the Data Interoperability and Governance program to collaborate with the 50x2030 initiative on data use in agriculture in Senegal for evidence-based policymaking.
From Data to Impact: Why Data Visualization Matters in Agriculture
This blog explores why data alone isn’t enough; what matters is turning it into usable insights. In agriculture, where decisions have lasting impacts, user-friendly tools help farmers and policymakers alike make better choices.

Harnessing the Power of Data: Tackling Tobacco Industry Influence in Africa
Reliable, accessible data is essential for effective tobacco control, enabling policymakers to implement stronger, evidence-based responses to evolving industry tactics and public health challenges. This blog explores how Tobacco Industry strategies hinder effective Tobacco control in Africa, and highlights how stakeholders are harnessing TCDI Data to counter industry interference.
Échos du secteur de la noix de cajou – Joseph Zerbo
En 2020, Cultivating New Frontiers in Agriculture (CNFA) s’est associé à Development Gateway (DG) dans le cadre du projet USDA West Africa PRO-Cashew pour développer la plateforme de collecte et d’analyse de données Cashew-IN.
Le projet a identifié des lacunes dans la collecte, le stockage, l’utilisation et la diffusion des données relatives au secteur du cajou dans les cinq pays de mise en œuvre (Côte d’Ivoire, Bénin, Burkina Faso, Ghana et Nigeria). Le projet s’efforce maintenant de combler ces lacunes par le biais d’un système de gestion des données sur la noix de cajou dans plusieurs pays (Cashew-IN) qui facilitera l’accès aux données et leur utilisation pour améliorer la prise de décision des décideurs, des agriculteurs et du secteur privé. L’objectif ultime est de générer de meilleurs résultats sur le marché de la noix de cajou dans ces pays.

Joseph Zerbo, conseiller aux affaires économiques directeur général du Conseil burkinabé du cajou (CBA), dresse un panorama de la filière cajou au Burkina Faso.
Présentation des défis de la filière du Burkina en termes d’accès aux données
La filière anacarde est une filière à forte création de richesses et d’emplois qui nécessite des données statistiques fiables et actuelles afin de faciliter les interventions et actions de développement. Les défis d’accès aux données de qualité sont effectifs dans la production, la transformation et la commercialisation. Les acteurs directs et indirects ont besoin des données statistiques pour la prise de décisions stratégiques afin de booster le développement de la filière conformément aux orientations du Gouvernement à travers le Plan de Développement Économique et Social II.
Quelle est votre ambition, ces 5 prochaines années, pour la filière anacarde au Burkina?
Notre ambition pour les cinq (05) prochaines années est de disposer d’une base de données exhaustives et à jour sur la filière anacarde. Ces données statistiques permettront à l’Administration publique et aux partenaires au développement d’intervenir plus efficacement dans la filière d’une part et d’autre part, aux acteurs directs de la filière de développer leurs activités de production, de transformation et de commercialisation ; toute chose qui contribuera à créer plus de richesses et d’emplois au profit des populations.
Comment l’outil Cashew-IN peut vous aider à atteindre vos objectifs?
Cashew-In étant une plateforme de données sous régionale pourrait contribuer à la diffusion des données au profit des utilisateurs au niveau national et international. C’est une opportunité pour le Burkina Faso à travers le Conseil Burkinabè de l’Anacarde de mutualiser les efforts afin de promouvoir la culture de la production et de la diffusion des données statistiques combien important pour le développement de nos pays de façon globale et de la filière anacarde de façon
Cette interview a été modifiée pour des raisons de clarté et de style.
Pour en savoir plus sur Cashew-IN, consultez notre liste de lecture du programme Cashew-IN sur YouTube.
Pour toutes questions ou suggestions, merci de vous rapprocher de Madame Constance Konan, ckonan@developmentgateway.org.
Partenaires
USDA
Le ministère américain de l’agriculture est un département fédéral qui assure le leadership dans les domaines de l’alimentation, de l’agriculture, des ressources naturelles, du développement rural, de la nutrition et des questions connexes, sur la base de politiques publiques, des meilleures données scientifiques disponibles et d’une gestion efficace. Grâce à son projet PRO-Cashew, l’USDA s’efforce de stimuler la compétitivité des producteurs ouest-africains en améliorant l’efficacité et la qualité de la production et du commerce, et en travaillant à l’élaboration de politiques régionales plus cohérentes en matière de commerce et d’investissement.
CNFA
Cultivating New Frontiers in Agriculture est une organisation internationale de développement agricole spécialisée dans la conception et la mise en œuvre d’initiatives agricoles durables basées sur les entreprises. CNFA travaille avec des entreprises, des fondations, des gouvernements et des communautés pour établir des partenariats locaux et mondiaux personnalisés qui répondent à la demande croissante de nourriture dans le monde. Depuis sa création en 1985, nous avons conçu et mis en œuvre des initiatives de développement agricole basées sur les entreprises afin de faciliter l’accès au marché, d’améliorer la compétitivité des entreprises agricoles, d’accroître la productivité et d’améliorer l’accès aux intrants et au financement dans 47 pays du monde.
Share
Recent Posts
Three Fundamentals for Climate and the Future of Health
Climate change is no longer a distant environmental concern; it is a growing public health challenge. Reflecting on discussions during London Climate Action Week, this blog explores why stronger investment, cross-sector collaboration, and better data are essential to building climate-resilient health systems.
(inter)National Models for Women’s Safety Online
Development Gateway and IREX spent the last year analyzing how different nations approach the "how-to" of online safety regulations. This blog discusses our research, which suggests that the most effective models go beyond reactionary and punitive measures to facilitate a functional ecosystem of trust and accountability.
From Ambition to Adoption: Reflections on AI in Higher Education in Kenya and Jordan
Higher education institutions are being asked to move beyond AI experimentation toward meaningful adoption. Drawing on a strategic dialogue in Nairobi, this blog explores how universities can bridge that gap through AI sovereignty, partnerships & practical adoption priorities.