The Evolution of Ghana’s Fertilizer Sector – From Subsidies to Crop Specifics
Through the Visualizing Insights on Fertilizer for African Agriculture (VIFAA) Program, Development Gateway – and partners International Fertilizer Development Center (IFDC) and AfricaFertlizer.org – aim to fill key fertilizer information gaps, increase data-driven policy and investment decisions in the fertilizer sector, and develop comprehensive, user-centered fertilizer data dashboards. The goal is to support development partners and the private sector to respond efficiently and effectively to changes in the fertilizer market, ensuring that sufficient quantities and appropriate fertilizers reach farmers at the right time for planting.
This is the second blog of our three part blog series on Ghana’s Fertilizer sector. The first blog can be found here.
In looking at the data and talking to stakeholders in Ghana, several key trends are starting to emerge in the country’s fertilizer market and in turn through the data captured in the VIFAA Ghana Dashboard. These trends are important for decision-makers planning for each season, and when thinking about the future of the market. In this blog we’ll dive into these features of the Ghana market, including where (and how) the data fits in.
Subsidies
Subsidies were the topic most commonly mentioned during stakeholder interviews, and in many ways subsidies are intertwined with all aspects of the market. Started in 2008, there is a thirteen step approach1 to subsidies that includes a plan to gradually phase the subsidy program out. However, subsidies are highly political. As farmers do not always see farming as a business, subsidies become a government program to ensure food security. One politician we spoke to mentioned that subsidies cannot be reduced during an election year because it would be too unpopular. Subsidies make up 80% of the total Ghana fertilizer market,2 making it a key consideration for new businesses wanting to enter the market.
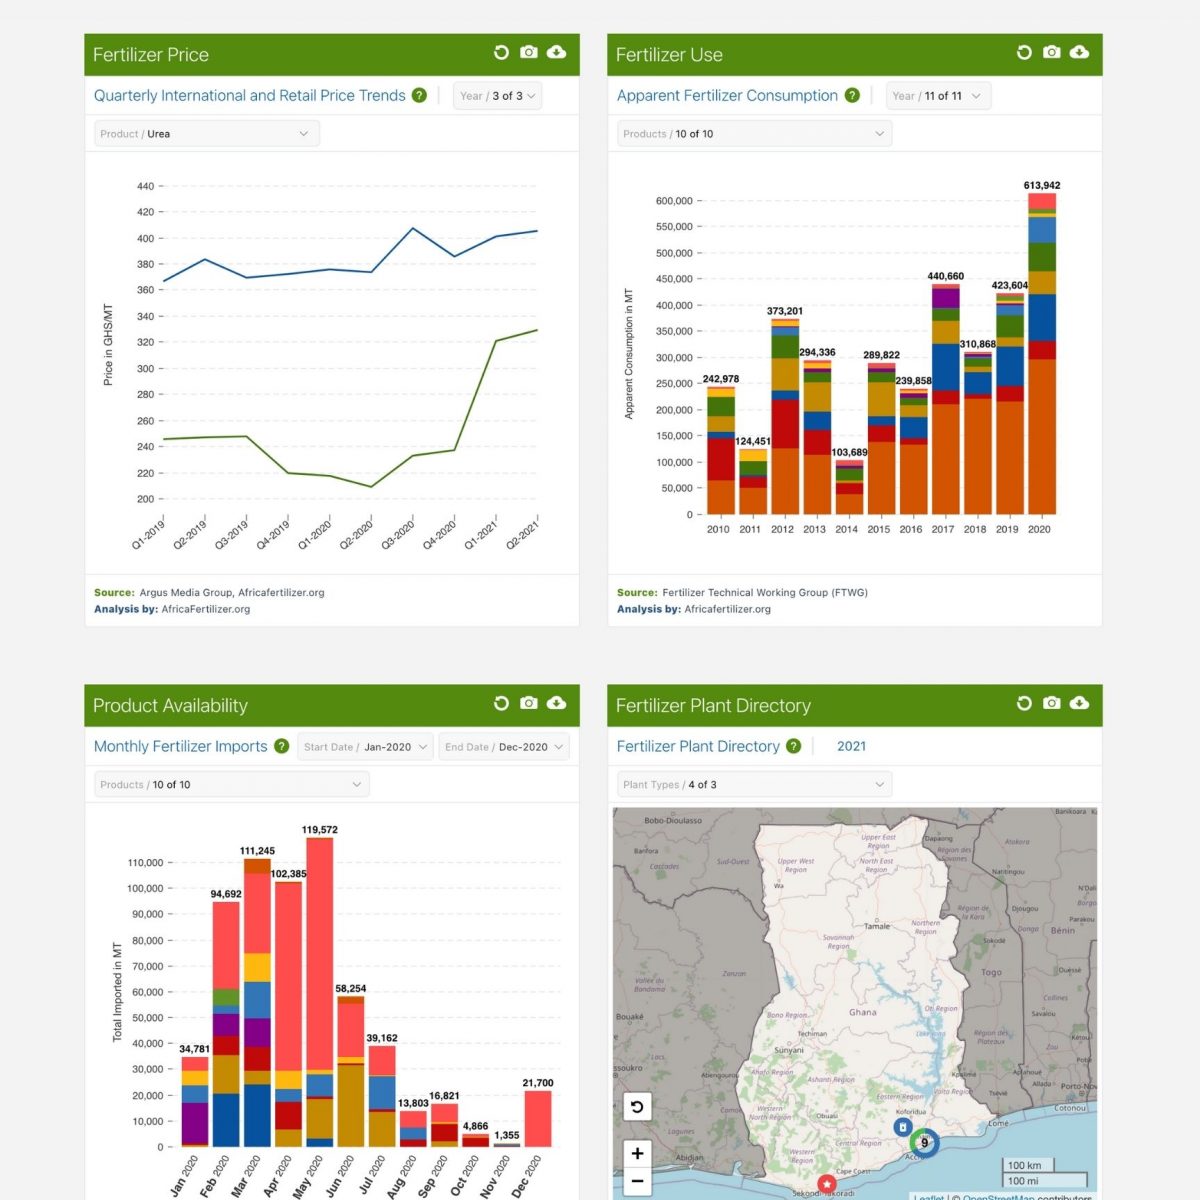
There is a clear link between fertilizer consumption and subsidies. 2014, for example, had the lowest apparent fertilizer consumption in the past eleven years – which was also a year when the government did not provide subsidies. Under the current subsidy plan, each farmer receives fifteen bags of fertilizer (5 urea and 10 NPK). It is hard to truly know how much of that is used each year and how much might be resold or smuggled out of the country for a profit. The VIFAA Dashboard could be one tool used to better understand how many bags of fertilizer each farmer actually needs by informing policy on when to buy/import/distribute fertilizers-based on import data; when to sign contracts for companies to buy fertilizer under the subsidy program based on international price; and where to buy fertilizer blends.
One of the major differences between the VIFAA Ghana Dashboard and other VIFAA country dashboards (Kenya and Nigeria) is the information and visualization on commercial price compared to subsidized price. This chart was included to compare the difference in prices between commercial fertilizers and subsidized fertilizer products, ultimately showing the margin of support farmers are getting. Additionally, the Annual Government Contribution to Subsidy Price by Product chart makes it clear how much the government is contributing to the subsidy prices.
This information is more critical than ever as 80% of fertilizer supply is provided through government targeted subsidies. The VIFAA Ghana dashboard enables MOFA to easily access the data needed to make decisions on subsidizing blends to ensure farmers do not face supply shortages or unaffordable fertilizer.
New Crop-Specific Blends
Ghana is leading the way in tailored, crop-specific blends. Not only is Ghana importing more diverse fertilizer types, but in blending plants around the country, Ghana is also blending unique blends. Soil scientists have specified some fertilizers to be used in the country, and while these are generally closer to blanket blends, they are also more specialized for particular crops. In addition, the VIFAA Ghana Dashboard includes information on organic fertilizers, which isn’t consistently available in a number of other countries, as part of apparent fertilizer consumption and denotes which fertilizer plants include organic fertilizers.
Subsidies in Ghana have played a role in new fertilizer blends as well. Historically, the government was primarily subsidizing any kind of NPKs, even types that were not good for the soil. A 2018 change in regulations implemented in 2019 has encouraged more site-specific fertilizers based on soil testing performed by the Soil Research Institute. The new formulations include micronutrients that enrich the soil. While the formulation was originally site-specific, the push is now for more crop-specific blends. As the government puts out new tenders, we have seen the shift to soy or maize-specific blends, for example.
Market Trends in the North & the South
Northern and Southern Ghana have some distinct differences in the agricultural environment which impact the fertilizer sector in each part of the country. Northern Ghana has harsher climate conditions, with one annual rainfall season and generally erratic rainfall patterns. Southern Ghana has two rainfall seasons with relatively more stable climate conditions.3,4 From a data perspective, there are clear regional differences in price between Northern and Southern Ghana. One of the biggest surprises, as seen on the dashboard, is that the cost of fertilizer is lower in the North, where the price was expected to be higher. The data was validated with the Fertilizer Technical Working Group, which means the fertilizer sector has a common understanding of this data point. Looking at the overall cost build up, specifically transportation costs, will be a useful dataset moving forward to further explain the difference in prices in the two regions
A second notable difference is that fertilizer blending plants are primarily located in the South. During a meeting this past August with Ghana’s Parliament Select Committee on Agriculture, committee members were surprised by the plant directory, noticing that there is a lack of blending plants in the North. They then suggested the need to plan for future plants in the region in order to reduce costs and to develop additional region-specific fertilizer blends.
Overall, having a platform that speaks to the private sector, public sector, and farmers with one unified voice is a starting point for decision-making that is evidence-based, and can continue Ghana on its path to evolving its fertilizer sector to meet the country’s food security needs.
—
References:
1. USAID & IFDC, 2019 Guide for Subsidy Programs, Improving the Design and Implementation of Fertilizer Subsidy Programs in West Africa, Proposed Guidelines for Smart Subsidy Programs.
2. USAID & IFDC, 2019, Ghana Fertilizer Value Chain Optimization Study.
3. Ghana National Drought Plan
4. Asante and Amuakwa-Mensah (2015) Climate Change and Variability in Ghana: Stocktaking, Climate 3(1):78-99.
VIFAA Going Forward
In November 2022, AfricaFertilizer (AFO), our partner on the Visualizing Insights on Fertilizer for African Agriculture (VIFAA) program, rebranded and launched a new website. This website includes the integration of country-specific VIFAA dashboards, which were previously housed in separate websites. By integrating the country-specific dashboards as well as fertilizer data on trade, production, consumption, and retail prices for 18 countries in sub-Saharan Africa, the new AFO data allows easier comparative analysis across countries and contributes its quota to the advancement of food security throughout Africa.
We have updated the previous country-specific dashboards links to now redirect you to AFO’s new website in order to ensure you are accessing the most up-to-date resources.
Share
Related Posts
From Data Gaps to Impact: Key Insights from the VIFAA Program
Over the last six years, DG, together with its partners AfricaFertilizer (AFO) and Wallace & Associates, collaborated to implement the Visualizing Insights on Fertilizer for African Agriculture (VIFAA) Program. In the program’s final year (2024), the team undertook a “program learning process” to reflect on outcomes, challenges, and successes through internal interviews. This blog captures five key learnings, which we hope will guide similar programs aiming to bridge data gaps in agricultural development.
Case Study: Fostering Sustainable Agriculture through Data-Driven Collaboration and Partnership: Ethiopia, Mozambique, and Nigeria
Through DG’s Visualizing Insights on Fertilizer for African Agriculture (VIFAA) program, we recently published a case study titled “Fostering Sustainable Agriculture through Data-Driven Collaboration and Partnership: Ethiopia, Mozambique, and Nigeria.” It dives deep into how the VIFAA program has impacted the fertilizer data and markets in Ethiopia, Mozambique, and Nigeria. In this blog, we explore the overall impact that the VIFAA program is making, why the program was needed, and offer some key highlights from the case study.
Fertilizer Technical Working Groups Provide Key Insights into Africa’s Fertilizer Sector
From June 2021 to September 2022, Development Gateway: An IREX Venture’s (DG’s) Visualizing Insights on Fertilizer for African Agriculture (VIFAA) program convened 12 Fertilizer Technical Working Groups in 14 countries which have yielded essential information on Africa’s fertilizer sector, including insights on how geopolitical events have impacted the fertilizer sector and what is needed to mitigate resulting threats to food security throughout Africa.