Why Does Ghana Need a Fertilizer Dashboard?
Through the Visualizing Insights on Fertilizer for African Agriculture (VIFAA) Program, Development Gateway – and partners International Fertilizer Development Center (IFDC) and AfricaFertlizer.org – aim to fill key fertilizer information gaps, increase data-driven policy and investment decisions in the fertilizer sector, and develop comprehensive, user-centered fertilizer data dashboards. The goal is to support development partners and the private sector to respond efficiently and effectively to changes in the fertilizer market, ensuring that sufficient quantities and appropriate fertilizers reach farmers at the right time for planting.
What Does the Dashboard Visualize?
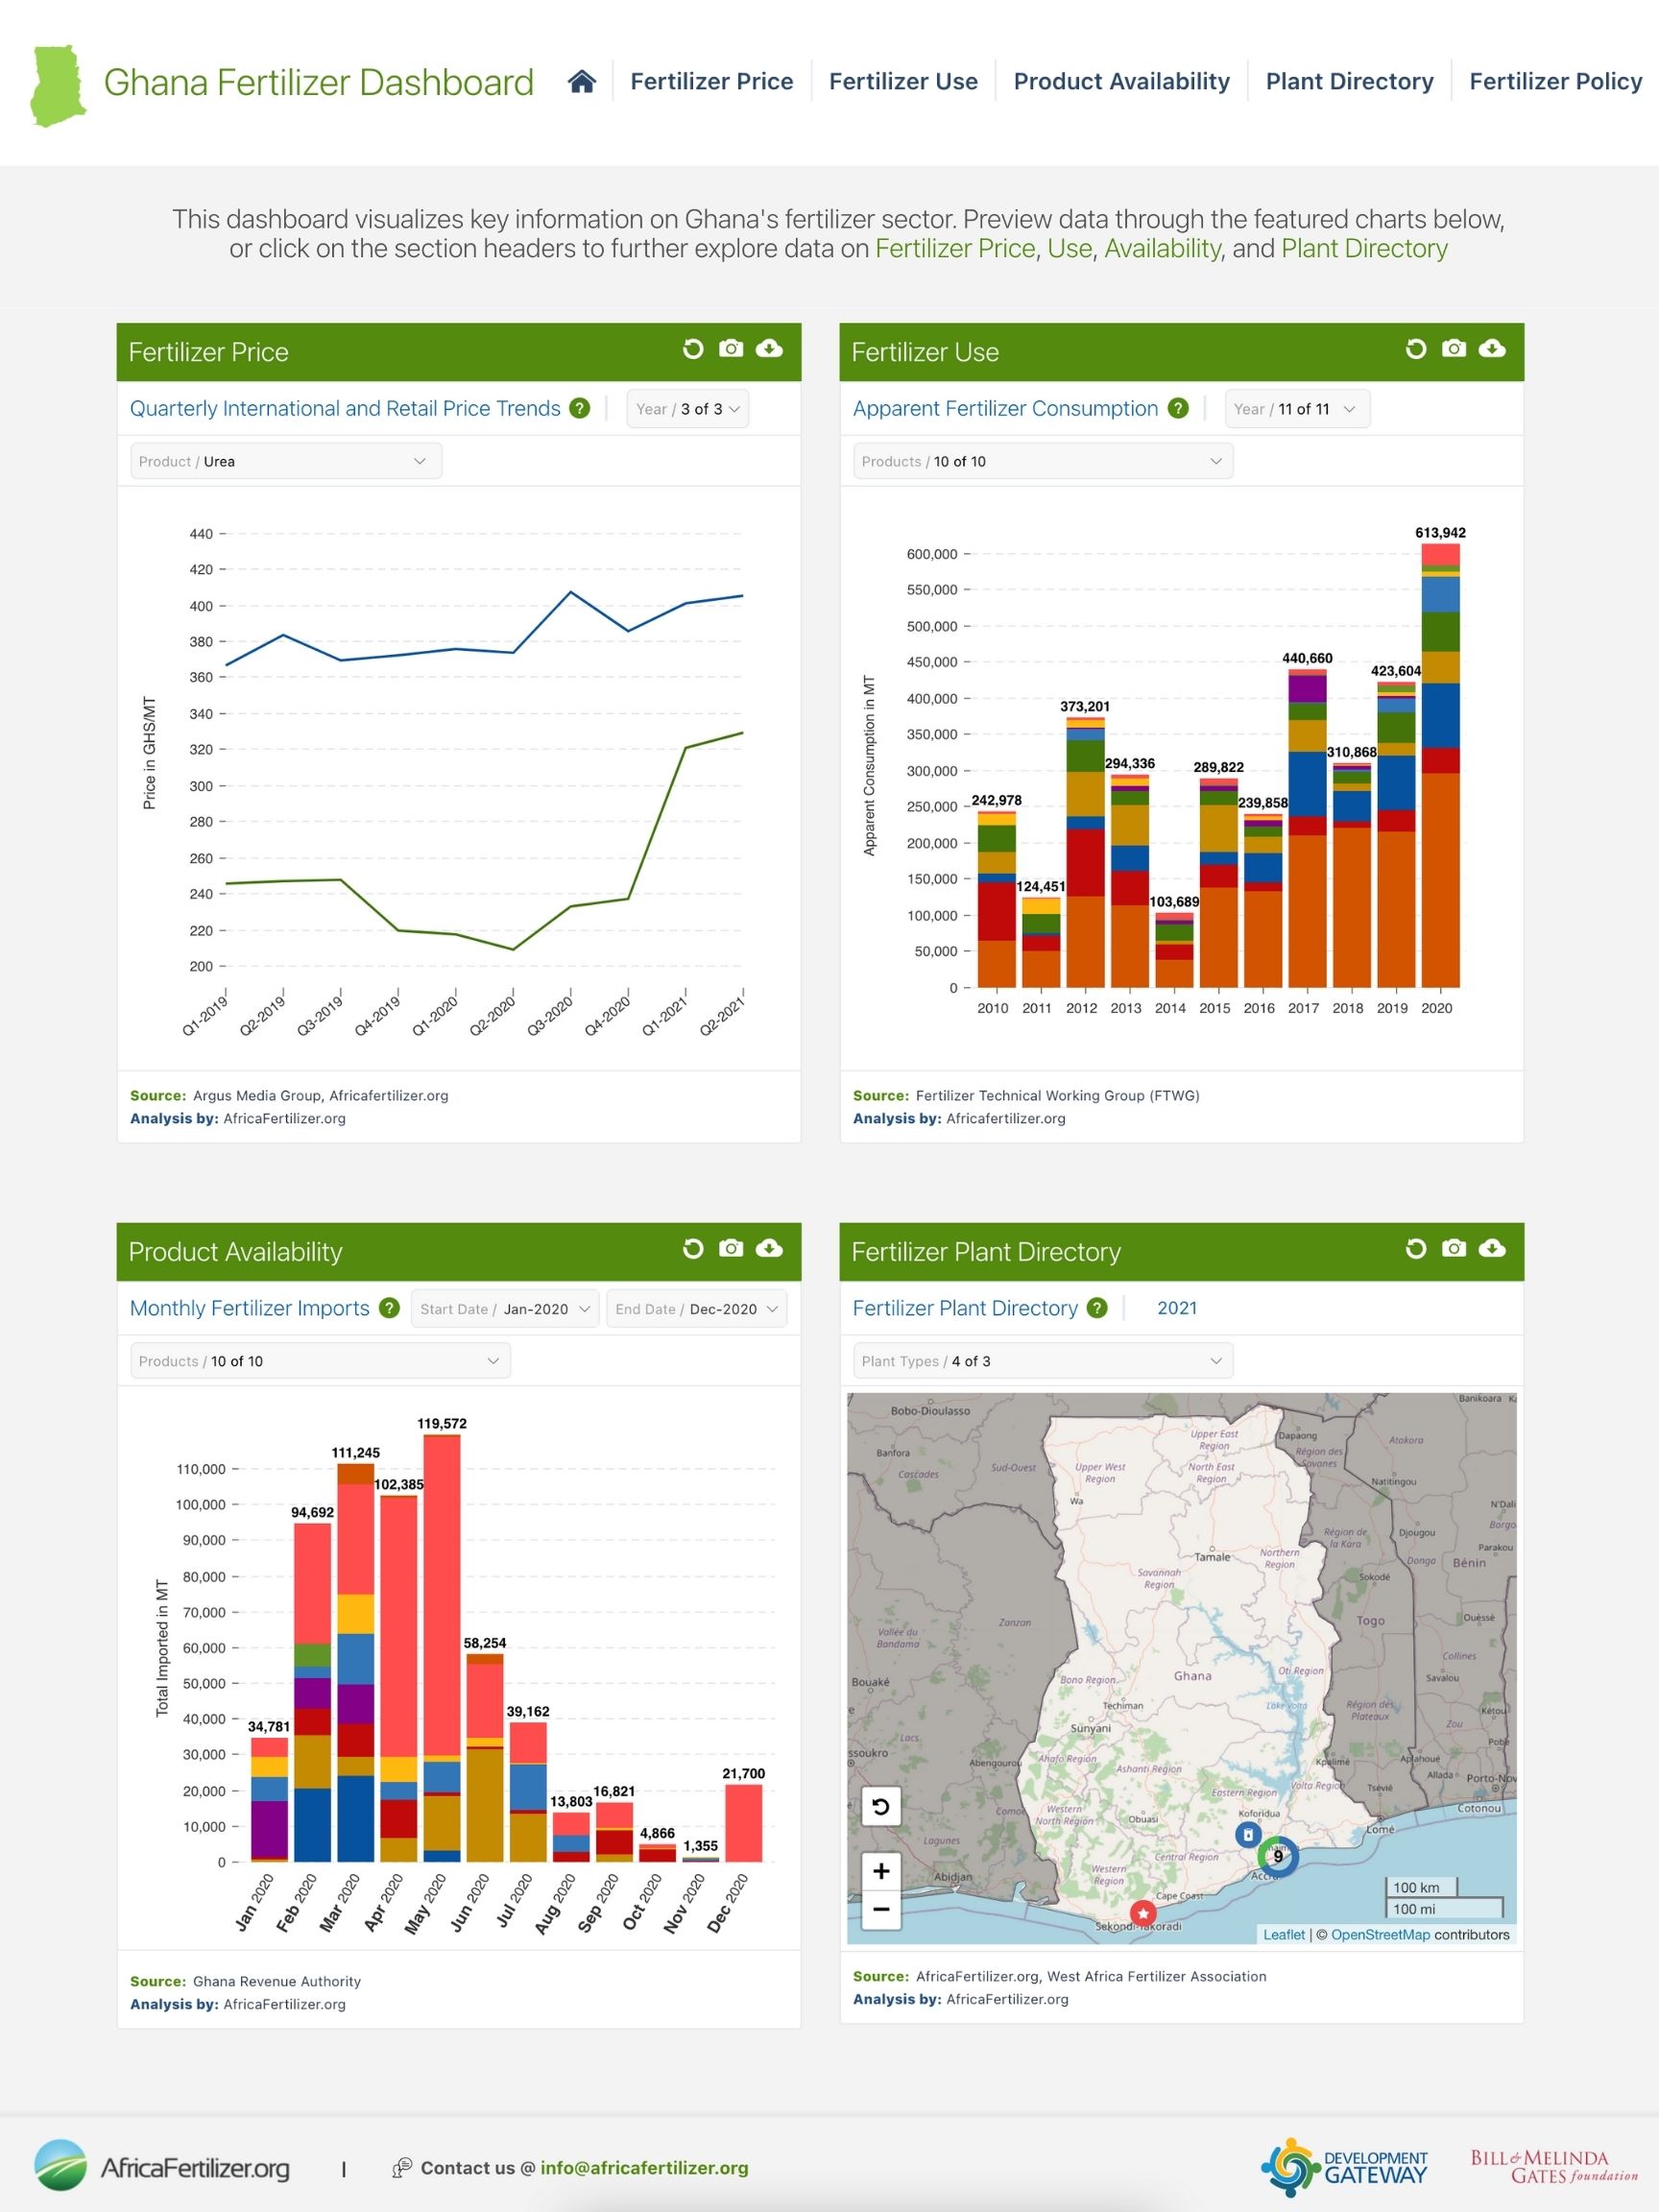
Fertilizer Usage – Sub-Saharan Africa (SSA) has the lowest fertilizer usage in the world – insufficient to replace soil nutrients lost every year to crop production. In 2006, the Abuja Declaration on Fertilizer for an African Green Revolution set 50 kg/ha as the primary target to reach. In Ghana, the current level of fertilizer use is 35.75 kg/ha. For nine years, AFO has been working with the Fertilizer Technical Working Group in Ghana to gather and validate the necessary data to calculate apparent fertilizer consumption. The dashboard then uses the apparent consumption data and FAO national cropland data to calculate national average apparent fertilizer consumption at the nutrient level, compared to the 50kg/ha Abuja target. This data is key to understanding where Ghana stands in its efforts to reach its fertilizer targets.
Level of Subsidies – The Ministry of Food and Agriculture (MoFA) sees increasing fertilizer use as a priority for the country and uses subsidies to help achieve these goals. The dashboard uses Crop Services Directorate of the Ministry of Food and Agriculture historical data for the past eleven years to show the annual government contribution to subsidy price by product. This data was requested by the farmers and makes it clear which products are being subsidized by the government and to what degree.
Fertilizer Imports – As Ghana is reliant on imports of raw materials for fertilizer and pre-blended fertilizers. Government subsidies 80% of fertilizers, which impacts imports as well. The dashboard shows how import quantity and price changes over time and can be used to help decision-makers understand and take action when needed to ensure sufficient volumes are in-country for the key planting seasons
Fertilizer Price – “High fertilizer prices is a key factor to reduced fertilizer use and it’s good to know what costs contribute to high fertilizer prices. This makes the cost more transparent.” The Dashboard shows the evolution of retail price over time, Evolution of Commercial Price Vs Subsidized Price Over Time, the price by region, and the international price.
Plant Directory – As Ghana leads the way in new fertilizer blends, knowing the location of fertilizer plants, the types of fertilizer produced, and plants coming online is crucial. The plant directory is used by the government, fertilizer distributors, and farmers to know what types of fertilizer blends are produced and available for specific crops. The directory is also used to determine distance and calculate the open market price, and to help determine the type of blends to produce.
What Stands Out?
Having a dashboard does not automatically resolve issues of Ghana’s fertilizer sector, but it can help in planning and in understanding trends in the country and in the sector. From the data on the dashboard, several key components in the sector are coming into focus:
- Ghana’s Ministry of Food and Agriculture (MoFA) is leading the way in subsidizing new fertilizer blends. MoFA has been tendering for crop-specific blends and has expressed a need for information showing the change in product use over time. However, they lack the capacity to collate, synthesize, and maintain the information, specifically across agencies.
- Subsidies have a wide-ranging impact on the market. With more than 80% of fertilizer supply provided through government targeted subsidies, the VIFAA Ghana dashboard will enable MOFA to easily access the data needed to make decisions on subsidizing blends, provide information to farmers and extension agents, and show the historical impacts of subsidies.
- Market variations between markets in the North and the South. One of the biggest surprises in the data was that the price of fertilizer is lower in the Southern part of Ghana than in the North. This was unexpected as fertilizer imports come through the southern region and transport costs should be expected to increase retail price. While there are a few explanations for this, what is more important is the visualizations that show cost chain build-up and using this information in planning.
In upcoming blogs, we will dig into the data in the Ghanaian context to build a better understanding of the sector and decisions made within it. Stay tuned!
VIFAA Going Forward
In November 2022, AfricaFertilizer (AFO), our partner on the Visualizing Insights on Fertilizer for African Agriculture (VIFAA) program, rebranded and launched a new website. This website includes the integration of country-specific VIFAA dashboards, which were previously housed in separate websites. By integrating the country-specific dashboards as well as fertilizer data on trade, production, consumption, and retail prices for 18 countries in sub-Saharan Africa, the new AFO data allows easier comparative analysis across countries and contributes its quota to the advancement of food security throughout Africa.
We have updated the previous country-specific dashboards links to now redirect you to AFO’s new website in order to ensure you are accessing the most up-to-date resources.
Share
Related Posts
From Data Gaps to Impact: Key Insights from the VIFAA Program
Over the last six years, DG, together with its partners AfricaFertilizer (AFO) and Wallace & Associates, collaborated to implement the Visualizing Insights on Fertilizer for African Agriculture (VIFAA) Program. In the program’s final year (2024), the team undertook a “program learning process” to reflect on outcomes, challenges, and successes through internal interviews. This blog captures five key learnings, which we hope will guide similar programs aiming to bridge data gaps in agricultural development.
Case Study: Fostering Sustainable Agriculture through Data-Driven Collaboration and Partnership: Ethiopia, Mozambique, and Nigeria
Through DG’s Visualizing Insights on Fertilizer for African Agriculture (VIFAA) program, we recently published a case study titled “Fostering Sustainable Agriculture through Data-Driven Collaboration and Partnership: Ethiopia, Mozambique, and Nigeria.” It dives deep into how the VIFAA program has impacted the fertilizer data and markets in Ethiopia, Mozambique, and Nigeria. In this blog, we explore the overall impact that the VIFAA program is making, why the program was needed, and offer some key highlights from the case study.
Fertilizer Technical Working Groups Provide Key Insights into Africa’s Fertilizer Sector
From June 2021 to September 2022, Development Gateway: An IREX Venture’s (DG’s) Visualizing Insights on Fertilizer for African Agriculture (VIFAA) program convened 12 Fertilizer Technical Working Groups in 14 countries which have yielded essential information on Africa’s fertilizer sector, including insights on how geopolitical events have impacted the fertilizer sector and what is needed to mitigate resulting threats to food security throughout Africa.