What’s Your Story and How Can Data Help Tell It?
For as long as Development Gateway has specialized in data, we have also specialized in data visualizations. In that time, we have discovered the pitfalls and learned ways that data visualizations can increase data use. In this post, we look specifically at selecting the right type of visualization for the story you want to tell.
Types of Stories
Your data can tell many different stories. For each visualization consider which story is most important. This will help you understand how best to visualize the information. Are you:
- Comparing quantities – Showing at least two variables at once
- Comparing trends – looking at changes over time
- Showing Relationships – display a connection or correlation between at least two variables
- Exploring composition – reviewing parts of a whole
- Showing distribution – looking at how your data are spread out
Story 1: Comparing Quantities
Using an Informational Table is great for when absolute values of your data are important, although you may have to do some manual calculations in order to understand the story the data are telling. Adding color scales (e.g., green for increases, red for decreases) or symbols (up/down arrows) to your table can make your story more intuitive.

Pros:
- Allows you to view all the details of your data
- Allows you to look at qualitative variables in addition to quantitative
Cons:
- The data story is not as immediately intuitive. It is not as easy to see patterns, relationships, and trends. For example, how quickly can you decipher whether the total cases of diseases of children under five have declined from 2015 to 2016?
- If there are too many data points, the core of the story is hard to get to
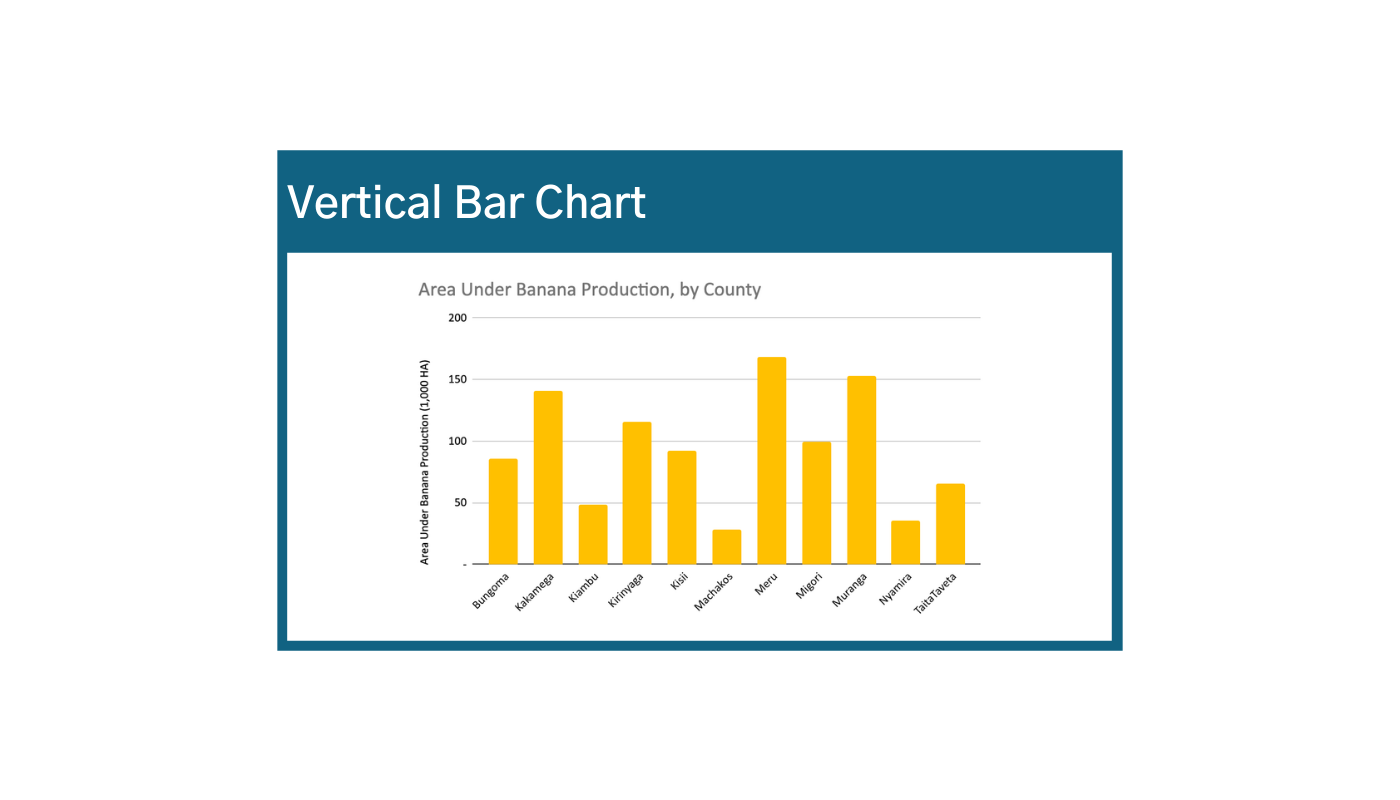
Bar Chart: Categories (Vertical & Horizontal)
Bars charts are one of the most intuitive ways to visualize quantities across multiple categories. Rectangles or “bars” can be plotted vertically or horizontally, with the heights/lengths of each bar proportional to the values that they represent. Because proportionality is so important for understanding bar graphs, the y-axis for bar charts should always start at zero. Plotting your bar chart horizontally can keep your axes clean and tidy if your data labels are very long.

Pros:
- One of the most intuitive and easily understood data visualizations to display differences in relative quantities. Ask yourself, “why not a bar chart?”
- Can be easily adapted to include multiple variables or groupings
Cons:
- When you have multiple variables or categories (i.e., grouped bar charts), meaning can get lost
- When you have a wide range of data values or a large scale, differences in quantities are harder to see
- Bar charts are usually interpreted as a “snapshot” of a singular moment in time. Be careful not to display change over time with bar graphs – use a line instead to show trends!
Waterfall Chart: Cumulative Net Value vs. Compounding Values
The waterfall chart is used to portray how an initial value is affected by a series of intermediate positive or negative values. A Cumulative Net Value Waterfall Chart is great when you know that your data has both positive and negative values, and you are interested in displaying the cumulative effect. Waterfall Charts can also display values that compound over time. Meaning when consecutive values start at previous values instead of at zero. Values in waterfall charts can either be time-based (see the first image below),1 or category-based (see the second image below).2


Examples of data that are good for waterfall charts:
- Budget tracking
- Inventories
- Profits
- Cash flows
- Consumption
Finally, you can also use waterfall charts to show deviation from a set value over time by displaying the bars as above or below that set value. This is sometimes also referred to as a diverging bar chart. With this chart, the emphasis is on the relative change rather than absolute values.

Pros:
- Allows you to demonstrate the cumulative effect and or positive and negative values at the same time
- You can accurately visualize when your starting values are not zero, which allows you to demonstrate progress against a certain starting point.
Cons:
- Sometimes not as intuitive, which makes them less usable for wide audiences.
- Not very precise. This type of visualization works best when relative increases and decreases are enough to tell your story.
Bubble Charts: Three Variables
Bubble charts are useful when relative size or quantity is an important factor in one of your variables. For example, the larger the country’s population, the more people are employed in agriculture. Thus, the relative size of the bubbles is an important piece of this story. In this example, on an interactive map, hovering over a circle displays the three variables for South Africa: employment, agri-land, and population. The visualization shows the relationship or testing correlation among three variables.3

Story 2: Comparing Trends
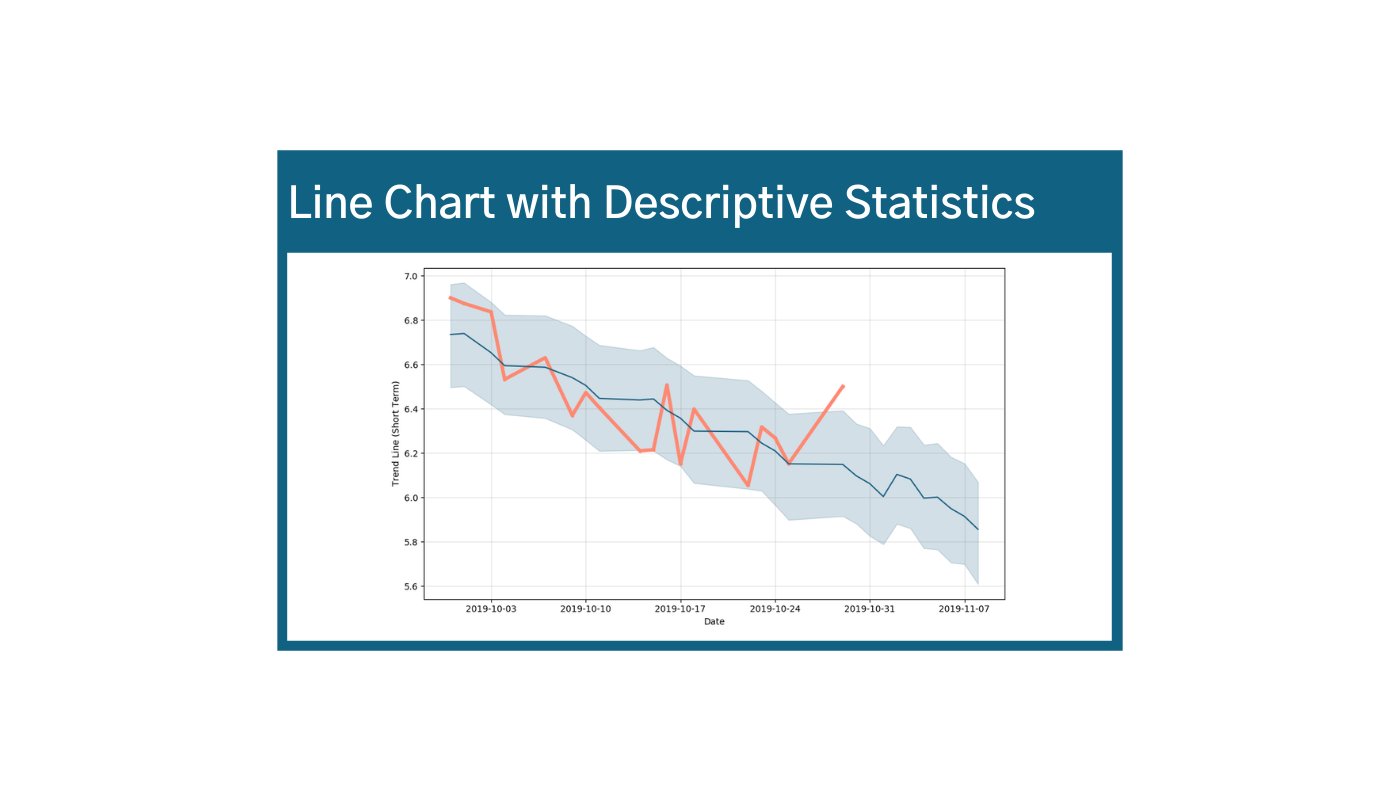
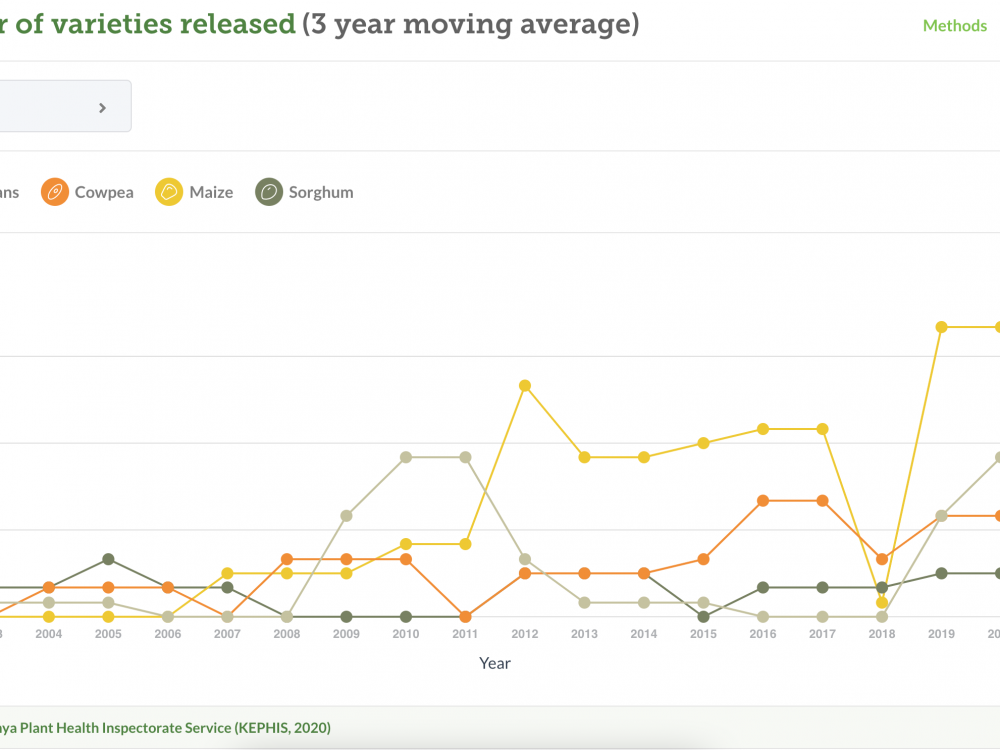
Line Chart: Time Series, Multiple Variables, Descriptive Statistics
Using Time Series Line Charts you can connect discrete but continuous data points with line segments to show general change over time. This works well because lines are visually intuitive. In line charts that display change over time, units of time should always be represented on the x-axis.

Line charts are also great because you can plot values for multiple variables at once, but be careful, your story will be lost if:
- You have too many lines
- The user needs to refer to the key too often
- The scale is too big or small
- There is no real trend over time
Include descriptive statistics to communicate your story in more detail. For example, the second chart above displays actual values in orange, forecasted or predicted values in blue, and the standard deviation in the gray shaded area.4 If your line chart isn’t conveying a story clearly, consider adding the following details to your visualization:
- Averages
- Regression lines
- Estimated values
- Min/max values
- Upper/ lower quartiles
- Baselines/ targets
- Totals
Circular Area Chart: Cycles
If your story involves cycles, circular area charts are a great way to visualize processes over time and/or as part of a cycle, for example, when you anticipate seasonal changes. These charts are also commonly called radar charts or spider charts for the spiderweb or radar shapes that they produce.

With this type of visualization, you can clearly see how often the data values are zero. In the example, you can clearly see that imports of specific types of fertilizer (DAP) vary drastically at different times in the year. However, this type of chart is only useful when only relative differences in values are important because it is harder for the reader to interpret absolute values.
Story 3: Showing Relationships
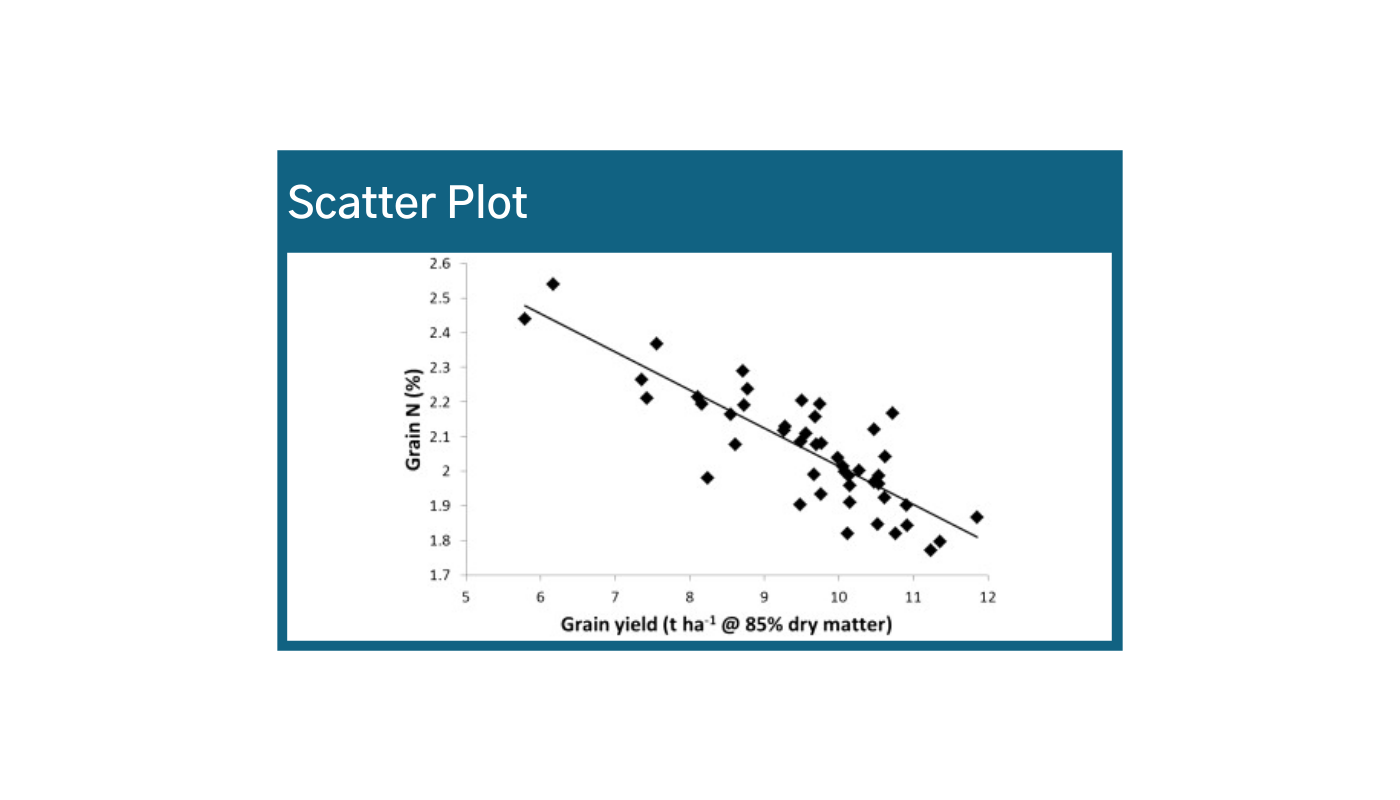
Scatter Plot: Two Variables
A simple plotting of individual values along the X and Y axes can be useful when you want to view the relationship between two variables, but you are not sure what that relationship looks like. In this example, we are looking at the relationship between the percentage of Nitrogen in the grain and the yield.5 The line represents a regression – a kind of “linear average” that is calculated using the minimum shortest distance between the and the line real data (ordinary least squares method). This can be calculated using statistical software.


Scatter plots can also show you when there is no relationship or correlation between your variables at all. In this example, there is no clear relationship between variable x and variable y. An example of this is the second chart above.6
If precision or absolute values are less important, and you would rather generalize or summarize your data, you can calculate some transformations to review trends more generally. An example of this is shown in the third chart above.7 This is also a great strategy for removing unnecessary clutter!
Types of transformative calculations:
- Normalization
- Regression lines
- Combining multiple variables at once (ex: averaging consumption across multiple districts)
Story 4: Exploring Composition
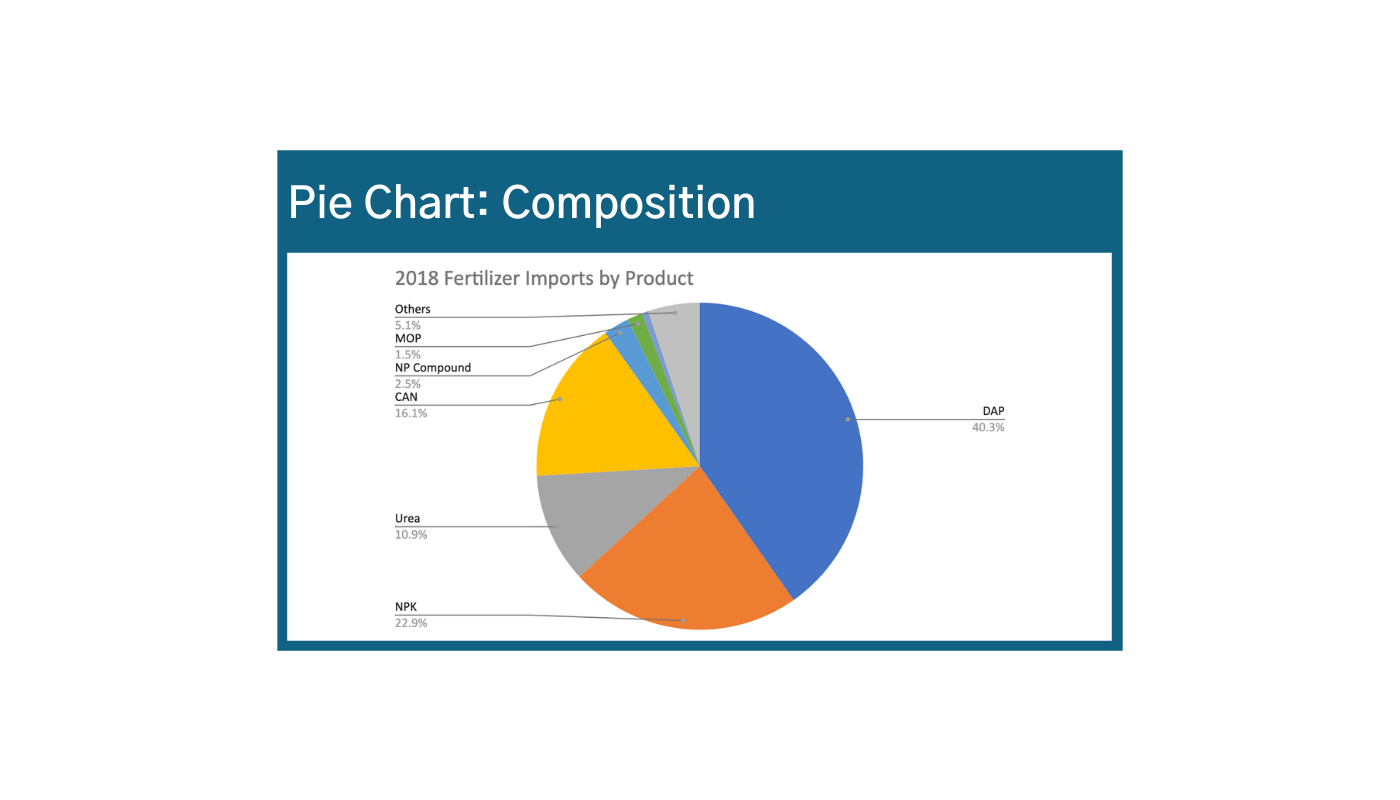
Pie Chart: Composition
A Pie Chart is a type of graph in which a circle is divided into sectors that each represent a part of a whole. It is great for when your story is focused more on relative proportions than precise quantities, or when approximate values are acceptable. If you need precise quantities, a bar or line chart might be a better option. This type of visualization is most useful when you’re just looking for one or two major players (for example, a pie chart that shows browsers: Chrome, Internet Explorer, and Firefox) in relation to one another. Be careful that there are not too many components and that there is some variance in proportions. Otherwise, comparisons and labels are harder to make and interpret. For example, without looking at the numbers or percentages, can you immediately tell whether there was more NP or MOP imported?
Pros:
- Allows you to quickly visualize components with respect to a given total
- Shows relative proportions of those components
Cons:
- Not as precise for comparing absolute values
- Humans have a hard time interpreting differences in sizes of circles or arcs (see: Jastrow illusion)
- It is a snapshot in time
- Circles can take up a lot of space!
Semi-Circles: Progress
Half circle charts are a good way to visualize progress towards a target or goal, like key performance indicators. One note, the graph below could be improved by adding quantity labels. For example – if mango production is at 90%, roughly how many more mangos need to be produced in order to meet the target?8

Story 5: Showing Distribution
Showing distribution is about explaining how variables are spread out. For example in maps we see distribution across locations; histograms show the distribution of frequencies or counts, continuous data, and ranges; box plots show distribution and variance together.
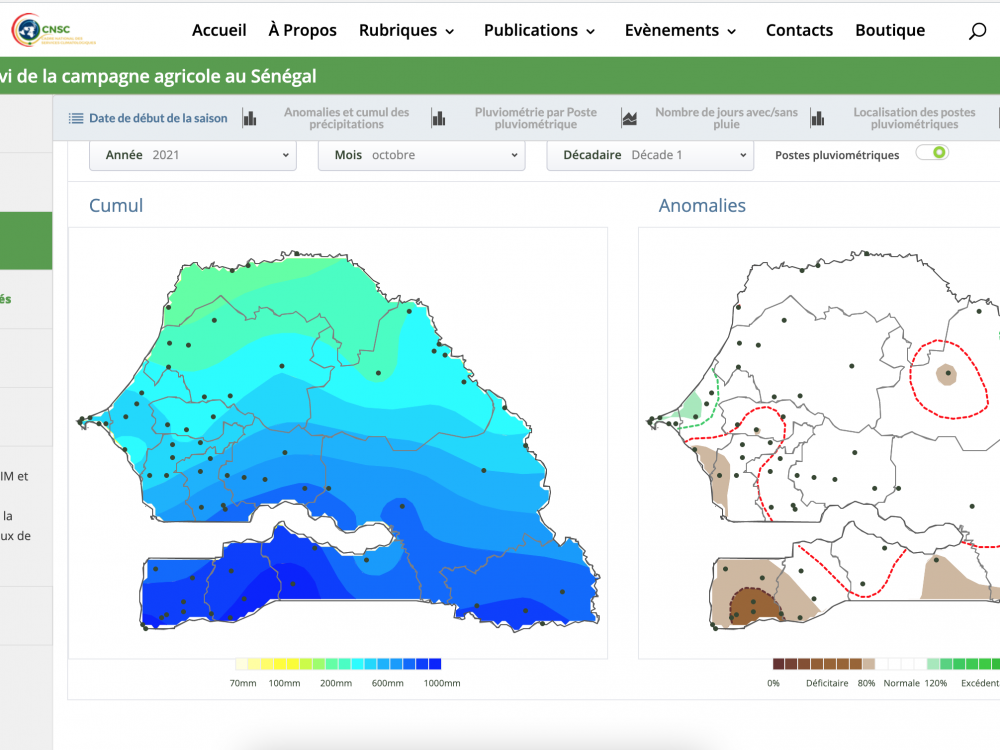
Choropleth Maps: Distribution
Choropleth Maps provide an easy way to visualize data variances across geographic units for example by country, state, region, divisions, or counties.9 In choropleth maps, the colors displayed are proportional with values. These types of visualizations are good when geography is central to your story, such as informing decisions on:
- Resource allocation
- Targeting
- Needs-based programming

Pros:
- Allows visualization on information trends by location, usually by geographic unit
- Color scales allow you to categorize, organize, and visualize your data into ranges
- Great for when your data is not precisely geolocated – i.e., you only have states, regions, counties, etc.
Cons:
- Location disaggregation limited by the geographic admin unit selected (i.e., you cannot visualize variances within the administrative unit)
- You can only show one variable at a time, unless you add symbols
- Requires a geolocation (admin unit) for each unit of data
- If your audience is not as familiar with the geography of this particular place, the meaning can get lost
- Consider pitfalls like whether your map is emphasizing raw values when per capita would be more appropriate; be aware when your data is really just showing population density and not concentrations of trends
Maps can be created with software like ArcGIS, Google Maps. Analytical software can also help calculate things like minimum distance between two points of interest.
Heat Maps: Concentrations
A heat map, also known as an isopleth map, is a graphical representation of data where data are mapped to their precise location and represented as a range of colors. Heat maps allow you to visualize frequencies and concentrations across administrative units. It is useful when you anticipate differences across geographic areas (e.g., urban vs. rural settings) usually related to population concentrations.10

Pros:
- Allows you to view frequencies/concentrations and distributions of data where it actually occurs
- Not limited to administrative unit
Cons:
- Can only show one variable at a time
- Requires precise geolocation (coordinates)
- Some other geographic details may get lost – e.g., bodies of water, cities, borders
- If your audience is not as familiar with the geography of this particular place, the meaning can get lost
- Consider pitfalls like whether your map is emphasizing raw values when per capita would be more appropriate; be aware when your data is really just showing population density and not concentrations of trends
Key difference between heat maps and choropleth maps is that the visualization of your data is not limited to the administrative unit. But choropleth maps are only useful if distribution or concentration is important – you need some significant variances in your data (such as population concentration) across locations in order for the story to emerge (otherwise it is all strange colors).
Histograms: Frequencies
Histograms allow you to view frequencies, or the distribution of your data, by grouping data into ranges or intervals. Histograms are good for when you’re observing frequencies across a known or continuous distribution of intervals, like age, test scores, or probability. They are also great for displaying data that usually follow a “bell curve” distribution by showing the precise value within the range indicated by the x-axis.


Usually with histograms, the values along the x-axis are usually the intervals/ranges across a known distribution, and the y-axis is the frequency (or the number of times data values occur within the given range). For example, it’s clear that the majority of farmers reported a 100-300% increase in yield after the intervention. As with bar graphs, the y-axis should always start at zero for all histograms.
At first glance, this may look like a bar graph. The key difference between histograms and bar graphs is that you cannot reorder the x or y-axis without losing meaning.
For example – how could you rearrange the ranges on the x-axis? (hint: you can’t – it wouldn’t make sense)
Pros:
- Good for visualizing whether your data are skewed in one direction or another
- Understand where values fall along a series of ranges
Cons:
- Sometimes, vertical axis as frequencies is not as intuitive
- Generalizes your data according to ranges
- Only works when frequencies or distribution are important
In the first example – it’s pretty clear that most farmers reported a positive increase in yield – which is pretty good! However, a significant number of farmers reported a decrease in yield – i.e., the results are not as positively skewed as we would hope.
Double Histograms and/or violin plots can also be useful for displaying multiple distributions at once, such as population age distribution by gender.11
Box Plots: Variance
Great for when you want to display range and variance across categories. The “box” in box plots captures where 75% of your data values fall, while the lines coming out of the box show the range of outliers in the remaining 25% of your values. For example, fertilizer type B recorded the highest instance of growth, but also has a very wide range of effects on growth overall.12 In fact, sometimes growth was less compared to the control group.


This chart also shows that you can bet on more predictable increases in yield values with fertilizer types A and C than you might with B.
Box plots are created by plotting values of descriptive Statistics (aka “central tendencies”):
- The line starts at the minimum value
- The top line of the box represents the first/upper quartile = halfway between median and minimum
- The line in the middle of the box represents the median = the “middle value” of your data (if you laid out your data across a number line)
- The bottom line of the box represents the third/lower quartile = halfway between median and maximum
- The line ends at the maximum value
Pros:
- Clearly displays descriptive statistics that summarize how your data varies across categories – median, upper quartile, lower quartile, and outliers
- “Box” clearly shows the range of values where 75% of your data fall
Cons:
- It is not the most intuitive visualization, especially for audiences that are unfamiliar with descriptive statistics
- Requires calculation of mean, Q1, and Q3
Combining Stories: Trends + Compositions
There are several ways to combine stories, such as displaying trends and compositions together. A prerequisite for this combination is data sets with values associated to different moments in time (it can be daily, monthly, quarterly, annually.)
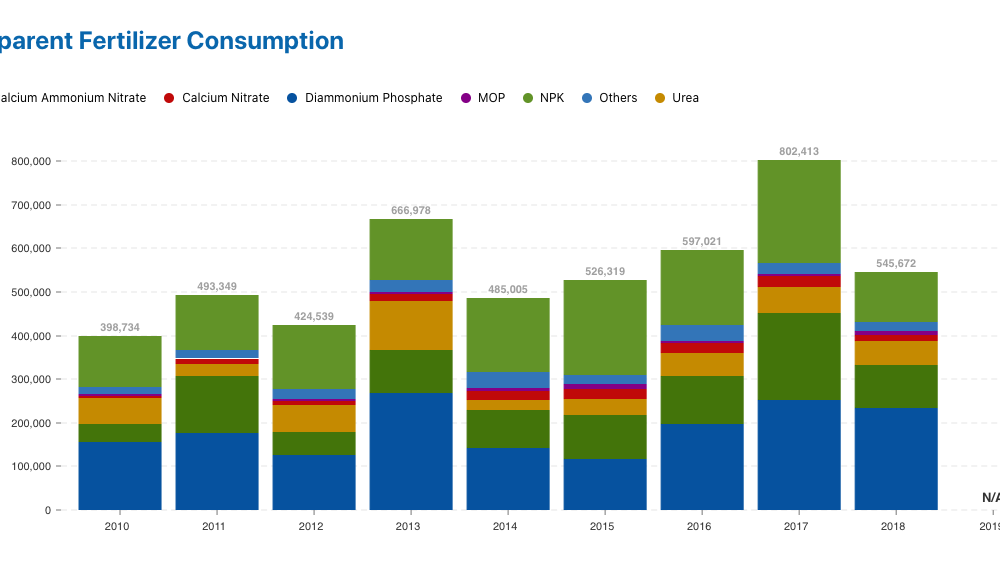
Stacked Bar Chart: Trends + Composition
A Stacked Bar Chart uses bars to show comparisons between category totals (monthly imports) and subcategories (fertilizer type) that make up those totals. The overall height of each bar represents the total for that month, reflected in their height on the y-axis. The benefit of this type of visualization is showing multiple part-to-whole relationships. A few caveats: be careful as a Stacked Bar Chart won’t work if you are not displaying parts of a whole. Additionally, consider color and consistency. The color order of the categories as they are stacked on the bar should always the same, in the example blue – orange – grey – yellow. This consistency helps viewers interpret when certain color values are zero, and so they do not have to visually search for the variable of interest. Here, it is clear that there were no diammonium phosphate imports from July to September.
Pros:
- Stacked charts are great for showing category subtotals (monthly imports) and how subcategories (fertilizer type) contribute to those totals
- Multiple part-to-whole relationships over time or across multiple categories (x-axis)
Cons:
- These visualization types can easily be misinterpreted
- Precise quantities are less clear
- Requires careful labeling and color schemes to be intuitive


Like traditional Bar Charts, Stacked Bar Charts can be flipped horizontally (see example two above). This is a great strategy when space or size is a concern – like if your data requires a long x-axis to clearly display the information. In this example, The x-axis has been scaled to display 100 MT (instead of 1MT). This allows your data to “stretch out” a bit so the comparison is easier to read.
Stacked Bar Chart: Percent + Composition
You can also stack proportions/compositions to display parts of a whole, like in the third example. This works well when relative proportions are more important than absolute values. For example, can you easily tell from this graph how many MT of NPK were imported in August? Not really, you only know that it was a vast majority of all imports for the month of August were NPK. Can you tell from this graph which month imported the most fertilizer? Not at all.
Area Charts (stacked line chart): Trends + Composition
Area Charts are similar to stacked bar charts, but using lines. This type of visualization is great for observing trends, and the components of those trends. The same rules apply for interpreting quantities. Be careful how you format your data though, you don’t want lines crossing each other!

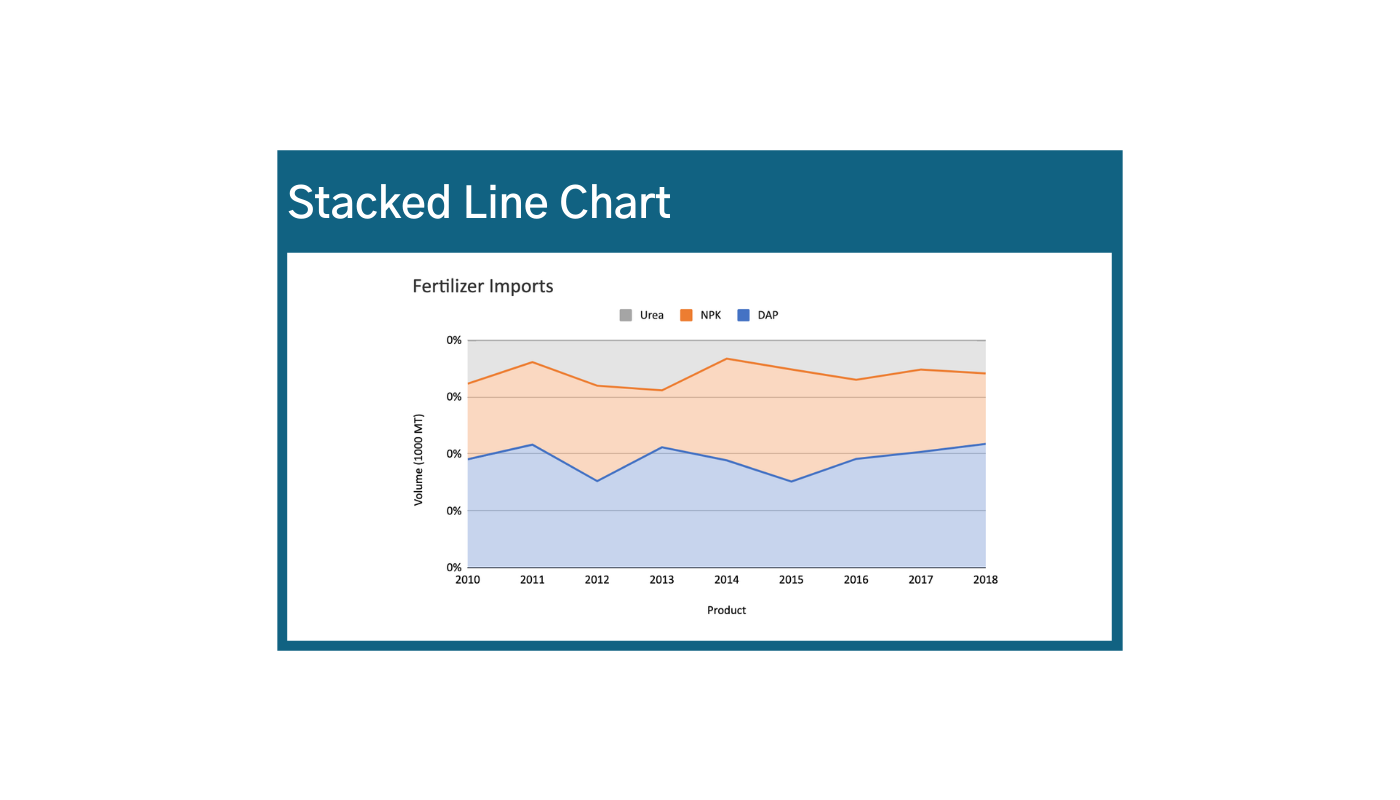
Area Charts can be used to tell a story that combines percentage, composition, and trends. This is helpful in visualizing proportions over time. Again, this works well when relative proportions are more important than relative quantities. One caveat is that this really only works if one variable is consistently greater than others (otherwise you get lines crossing themselves) and when values between variables are large enough to review the difference between them (otherwise there will not be any space between the lines.)
Pros:
- Good for showing part-to-whole relationships over time
- Can show percentages as well as quantities
- Shows groups within sub-groups
Cons:
- Be mindful that you’re actually displaying compounding values! For example, the amount of urea imported in 2013 is roughly 100,000 MT (not 500,000)
Components of Components: Sankey Diagrams
Sankey diagrams can display either component of components, or flows and the proportional size of those flows from one thing to another This type of visualization is more common in interactive maps, where hovering over a category (clearing) reveals its components and sub-categories. It is most useful when the values contributing to a stacked bar or line chart are too small to visualize in a stacked bar or line graph; or when subcategories are different within each category.

Features: Double
This type of visualization is great when you want to show two variables at the same time, and the two variables have some relationship to each other. For example, if you were to stack order amounts and sales side by side, you would not see how they are related.13

Putting it all Together: What is Your Story?
When thinking through your story, and the best way to visualize it, ask yourself a few questions.
- What kind of story am I trying to tell with this indicator? Know what your data is telling you, but also know what your audience needs to hear.
- Example 1: I need to compare values across different location to identify priority areas.
- Example 2: I need to analyze how the composition of X evolves in time.
- What type of graphic would allow me to tell this story?
- Example 1: A map
- Example 2: An area chart (or stacked area chart, if you have subcategories)
- Does my indicator have necessary data & variable(s) to create the selected graphic?
- Example 1: this visualization requires data to be geotagged
- Example 2 : the data needs to add up to a whole/100%
- Is the story displayed clearly? Is there a way I could rearrange to reduce clutter?
If it does not look right, or your story is not clear, there is probably a better way to visualize your data. Consider these options:
- Switch between bars and lines, and/or horizontal and vertical – which one tells your story better?
- Does your data have outliers? Try labeling them instead of stretching out your graph.
Once completing your visualization review the graphic by asking yourself a few questions:
- Is this a useful presentation of data?
- What did it tell you?
- What action would you take as a result of looking at it?
After you have selected the types of charts needed to visualize data, it is time to think about the actual visualization. In the next post, we will identify the ways that visualizations can be tricky, and provide methods for testing the visuals, and highlight examples of best practices.
Sources
1. SyncFusion
2. Tutorialspoint
3. CanvasJS
4. Wallet Investor
5. Science Direct
6. Mendoza B, Guananga N, Melendez JR and Lowy DA. Differences in total iron content at various altitudes of Amazonian Andes soil in Ecuador [version 1; peer review: 2 approved]. F1000Research 2020, 9:128 (https://doi.org/10.12688/f1000research.22411.1)
7. Cape Breton University
8. Slide Team
9. Stack Exchange
10. ArcGIS Developers
11. CIA Factbook (USA, Kenya)
12. Statistics by Jim
13. Data Pine
Share
Related Posts
AD3ventures in Mapping
Administrative data – data from civil registration and vital statistics systems, and sectoral (health, education, judicial, social protection) management information systems – is rich with insights on citizen needs and priorities. Though timely and disaggregated administrative data can complement official statistics, it comes with its own data quality, availability, and use challenges.
AD3 ou une aventure cartographique
Par le biais d'AD3, nous avons développé un tableau de bord qui se concentre sur le climat, les prix du marché, les maladies du bétail, le niveau des fleuves et les précipitations annuelles, entre autres thèmes. Si le tableau de bord lui-même est un référentiel d'informations utile, la méthode d’élaboration des cartes et d’itération des commentaires des utilisateurs a permis d'identifier les bonnes pratiques en matière de visualisation des données.
Designing Data Visualizations: Merging Best Practices and Design Thinking
DG has been co-designing data visualizations with partners and stakeholders for over a decade. Thinking about the ways people process information is crucial to developing easy-to-understand data visualizations. In this post, we examine best practices for incorporating user-centered design into our data visualization outputs.
The Building Blocks for Successful Data Visualization Tools
This post is co-written with Jennifer Requejo and Lauren Francis of UNICEF’s Data & Analytics team.
For the past few years, Development Gateway has been supporting UNICEF’s work on women’s, children’s, and adolescent’s health (WCAH) through producing the Countdown to 2030 Dashboard. In 2020, we sought to answer a pivotal question: what are the good practices and lessons learned from the many existing WCAH data visualization tools (DVTs)? UNICEF commissioned DG to conduct a consultation to answer this question, as well as to identify any differences for emergency-focused DVTs, using COVID-19 DVTs as a test case. DG reviewed 25 WCAH and five COVID-19 dashboards and interviewed 36 individuals who use or produce DVTs.
Our findings highlighted good practices that are applicable beyond WCAH. Many of these findings are also supported by a consultation for IAP, which partially focused on data for accountability. For full details, download the report.
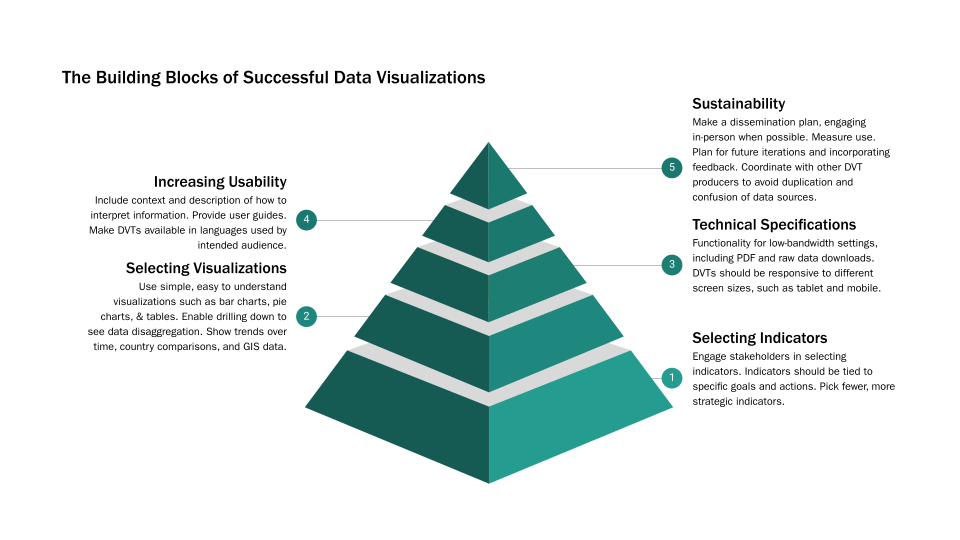
The principle recommendations from this work can be categorized into five main divisions. As seen in the graphic above, these divisions can be imagined as the building blocks that comprise DVT development. A theme that runs through each of these categories is understanding the audience. What kinds of actions and decisions are they expected to make based on the information presented in the DVT? Knowing the audience will determine the language(s) the DVT should be in, the types of data needed, how to best visualize the data, and the functionality needed for the platform overall.
1. Selecting Indicators
Careful selection of indicators was highlighted in both the UNICEF and IAP consultations. Indicators should be selected in conjunction with the communities the DVT aims to support, and developed to match the needs of the intended audience. Where possible, DVTs indicators should be developed based on existing data sources. Sometimes less is more. If the number of visualized indicators is large, users may not be able to determine the key messages and areas where action is most needed. Picking fewer, more strategic indicators is recommended.
2. Selecting Visualizations
In general, visualizations should be simple, easy to understand, and allow for different levels of granularity through data desegregations. Considering the audience is critical for knowing what visualizations to include:
-
- Policymakers – visualizations that are easily and quickly understood like simple bar charts, and visualizations that show comparisons or trends over time;
- Program Officers at the Ministry of Health or regional levels – visualizations can be more detailed, these DVT users are more experienced with traditional charts and graphs like line graphs and pie charts;
- Community Members/Advocates – visualizations like infographics or that have more narrative features work best.
3. Technical Specifications
When developing a DVT, certain technical aspects should be considered. Some of the important features highlighted in the interviews were the need to develop DVTs with low-bandwidth options. While some dashboards we reviewed took less than a second to load, others took over five seconds, which would be even slower in low-bandwidth settings. Including downloads of raw data into CSV and downloading chart images as PDFs and other print-ready formats means the data can be accessed when the internet is not available. We also found that many DVT users access the internet via mobile devices, meaning DVTs must be responsive to different screen sizes.
4. Increasing Usability
Data visualizations should be accompanied by contextual information on how to interpret the information being displayed. User guides can also help ensure that DVTs are used and understood correctly. Importantly, DVTs should be available in languages relevant for the desired audience. These considerations can help reduce the barriers for using DVTs.
5. Sustainability
Elements that secure success of DVTs long-term include planning for dissemination of the DVT, beyond just publishing it. Interviewees spoke of the importance of meeting face-to-face with expected users for dissemination. Along with dissemination, measuring use is also critical. DVT producers should consider what forms of measurement are possible. Producers could track site views, data downloads, and other measurements of engagement, as well as tracking when systems are cited in publications. Creators of DVTs should also plan for the future. It’s typical for DVTs to need to be updated based on changing contexts, changes in the evidence base, or feedback received. Expecting and planning for changes from the beginning can ensure the long-term sustainability of the visualizations and the platform on which they are housed.
DVTs in Times of Crisis
In the event of a crisis, such as COVID-19, certain factors should be considered. It is important to identify what is “good enough” since crises do not typically allow time to achieve perfection in a DVT tool. Using already available data will also speed up DVT development. However, it is important to consider what data gaps exist and how that is going to impact decision-making. For example, COVID-19 data disaggregated by age and gender has been a problematic data gap. Identification of data gaps can also raise visibility on where additional data collection should be prioritized. Ultimately every acute crisis will come to an end. Consider how the DVT can be repurposed once the crisis is over.
Creating a Checklist
A checklist of key considerations can be helpful for creators of DVTs to ensure new tools meet their audience’s needs, are easy to understand, and are likely to succeed long-term. An example of what might be included in a checklist can be found below.
| Component | Considerations |
| Audience |
|
| Indicators |
|
| Visualizations |
|
| User Needs |
|
| Sustainability |
|
| In an Emergency |
|
Over the next few weeks, we will explore other aspects of developing data visualization tools, including how we put these principles into practice.
Cover Image: Screenshot of the Countdown to 2030 Dashboard
Share
Related Posts
Reflecting on 3 Years of Digital Advisory Support for Agricultural Transformation
As the DAS program concludes, this blog reflects on its impact in advancing digital transformation in agriculture, highlighting lessons on capacity building, knowledge transfer, and sustaining resilient food systems.

The Data Crisis Following USAID’s Withdrawal: Opportunities to Reimagine Data Systems
For decades, USAID and other US government funding supported global data systems, from health surveys and early warning tools to digital infrastructure for ministries. The abrupt termination of USAID funding has triggered twin crises: a halt to data collection and the undermining of digital systems – reveal existing inefficiencies and instabilities in how data is collected, managed, and shared both within and between countries.
Launching a Partnership Matching Service for Nonprofits
While a lot of us have talked about the potential, value, and – in some cases – need for more mergers and acquisitions in the non-profit space, recent events have made it clear: now is the time. That’s why the teams at Accountability Lab, Development Gateway: An IREX Venture and Digital Public, partnered up to develop both a new toolkit, a partnership matching service, and professional support infrastructure aimed at assisting the organizations facing this challenge.

Improving the National Ministry of Education’s Information Management System
DCDJ Data Fellows addressed data use and training needs within the Ministry of National Education in Côte d’Ivoire and supported the development of requirements for an Education Management Information System (EMIS).
Background
The Des Chiffres et Des Jeunes (DCDJ) Data Fellowship is DCDJ’s flagship program, placing technically-trained Ivorian youth into organizations and government ministries where they encourage and increase the degree to which data is used for decision making. It is a unique opportunity for young people to sharpen data skills while contributing to a strengthened data ecosystem in Côte d’Ivoire. DCDJ is a program led by Development Gateway and funded by the Data Collaboratives for Local Impact (DCLI) program.
Seven DCDJ Data Fellows – Bagayan Abdramane, Bazie Yann, Cherif Aidara, Coulibaly Na’Guaissa, Dougban Monsia, Nichi Pierre Arsene, and Ouattara Drissa – were assigned to the Ministère de L’Education Nationale, de l’Enseignement Technique et de la Formation Professionnelle (MENET-FP)’s Direction des Technologies et des Systèmes d’Information (DTSI) during their internships to provide technical support in centralizing and manipulating reliable data.
Problem
MENET-FP manages huge amounts of education and training data across its 19 departments. To consolidate, track, and increase the effectiveness of education data, in line with the country’s ten-year Education Action Plan. The DTSI department within MENET-FP has been tasked with the challenge of developing an education management information system (EMIS), an activity under the Secondary Education Project funded by the ongoing MCC Compact in Côte d’Ivoire, and specifically aimed at centralizing data across all MENET-FP departments into a single, cohesive source. The EMIS is also important for other activities under the Compact such as the construction of about 80 new secondary schools where educational outcomes will need to be tracked and managed for optimum impact.
Upon beginning their internships at DTSI, the Fellows immediately identified a need to improve data sharing data across the Ministry’s departments. With the current system, DTSI requests data – on schools’ performance, specific teaching staff, and ongoing education reforms, etc. – from the other departments over email or in-person. These requests could take anywhere from a week to a month to be received and processed. Fellows also suspected that this issue was affecting progress of the above-referenced EMIS.
The Fellows also found that most field surveys conducted by DTSI officers were done using physical questionnaires, resulting in slow data processing, complicated management, and data entry errors.
Solution
To further investigate MENET-FP’s data centralization and data sharing issues, the Fellows visited neighborhood schools and regional education offices, called DRENs (Regional Directorate of National Education), in Abidjan wards 1, 3, 4. They assessed regional data collection processes, and showcased and discussed potential digital solutions. In visiting neighborhood schools, Fellows understood data at the school level and how – and in what format – it flows towards the DRENs, then to its ultimate destination with DTSI.
Understanding the data flow from school-level to national-level helped Fellows see where data bottlenecks lie, and provide information that is critical to the development of a viable EMIS based on existing types of local (school level) data sources, data collection formats – as wells that the specific needs and capabilities of DREN officials.
Processes
After assessments of the neighborhood schools and regional education offices, the Fellows leveraged open source applications to come up with digital solutions. The Data Fellows proposed new methods of data collection based on DREN data collection officers’ needs. They introduced Tableau as a new way of visualizing data and creating dashboards, and conducted in-person introductory training sessions to the tools, working with partners to ensure they understand the benefits of the tool and can use them independently.
By addressing data flow bottlenecks and developing tools to address them, the Fellows helped local data reach DTSI more quickly – and helped DTSI speed up the EMIS development process. Data Fellows also prepared an external Recommendations Report for DTSI on the data collection challenges impeding the progress of the EMIS project.
Outcomes and Impacts
One DTSI official said: “This project has helped with gaining time and efficiency – having better data flow and more timely exchange from the schools to the DRENs on the one hand, and from the DRENs to the Ministry on the other hand, reduces data errors and speeds up work.” The recommendations from the report will contribute to a better EMIS as DTSI will use the report’s findings to ensure the system meets data collection needs, but is grounded on the local data sources and capabilities.
As another result of this project, the Fellows were invited to support the Oracle Academy project – which works with global institutions, educators, and partners to help students become technology leaders. They used their data visualization skills to map information on 450 secondary schools and analyzed the Oracle Academy’s 2017-2018 student database for Côte d’Ivoire. This provided reliable visualization of urban and rural trends in the rate of HIV/AIDS by region, using QGIS and Tableau software. Moving forward, the Fellows’ impact will continue to be felt as projects like SIGE and Oracle Academy are completed – because they contributed to the understanding of the barriers to data collection, and helped find the right tools, and propose process solutions to overcome those challenges.
Conclusion
To meet the Education Action Plan’s goals, MENET-FP must significantly improve its data collection and management processes. Development of the EMIS would not only allow all players in the education system to access streamlined data in one central location, but, for select anonymized educational data sets that can subsequently be made public, also support the government’s open data agenda. Moreover, access to education data and appropriate analysis tools will improve understanding of how education works within the country, and where improvements to educational infrastructure and/or outcomes, or simply better data collection process and quality are needed.
Share
Related Posts
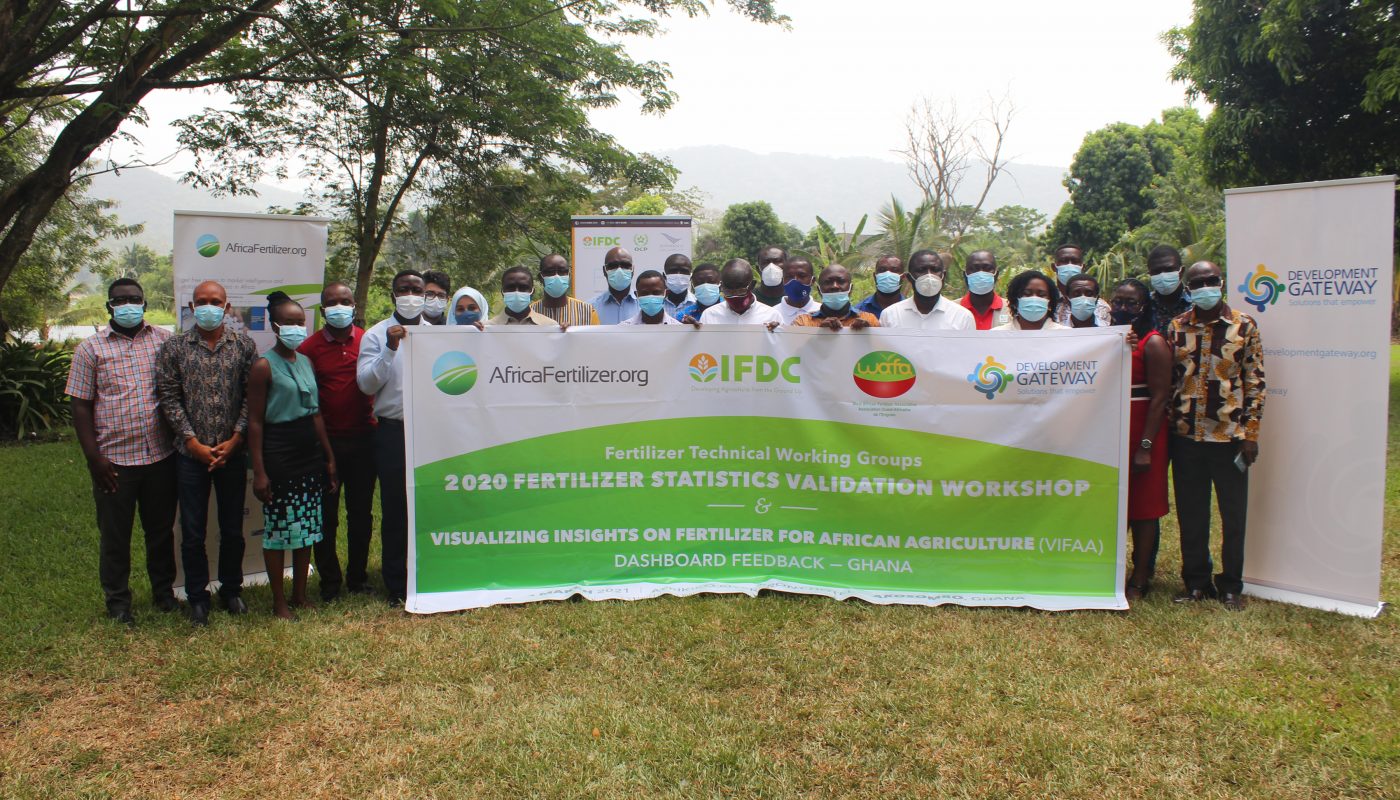
One Step Closer to the Ghana VIFAA Dashboard
Since November 2019, Development Gateway (DG) has worked closed with Africafertilizer.org (AFO), the International Fertilizer Development Center (IFDC), the Ghana Ministry of Food and Agriculture, Ghana Statistical Service (GSS), the Ghana Revenue Authority (GRA), Ghana Cocoa Board (COCOBOD), private sector companies, research institutions, and development partners to understand the nature of demand, supply, and use of Ghana’s fertilizer data through the Visualizing Insights on Fertilizer for African Agriculture (VIFAA) program. VIFAA is a four-year partnership with the Bill & Melinda Gates Foundation being implemented in Kenya, Nigeria, and Ghana. Together with the partners, we co-designed a dashboard that has aimed to address key decision-making needs, prioritizing data including: fertilizer price, fertilizer use, fertilizer availability, and fertilizer blending as well as identified new opportunities to collaborate in closing data gaps.
Co-design workshop to meet Stakeholders’ Dashboard Needs
In February 2020, a co-design workshop was held with key fertilizer stakeholders (public sector, private sector, and research/university/civil society) in Ghana where a total of eleven key fertilizer indicators were identified as priorities and validated. Out of these, only five indicators had readily available data for the development of the dashboard – international fertilizer price, fertilizer retail price, fertilizer use, fertilizer availability, and fertilizer plant directory. The source of this data was AfricaFertilizer.org. Without data for the six remaining priority indicators, various stakeholders present were identified and agreed to support VIFAA to provide data. The stakeholders provided recommendations for visualizations for each of the indicators which the DG team synthesized the proposed designs to make sure that each stakeholder interest was met. The team then prepared a technical requirement document based on the visualizations and used them for the development of the Ghana VIFAA dashboard.


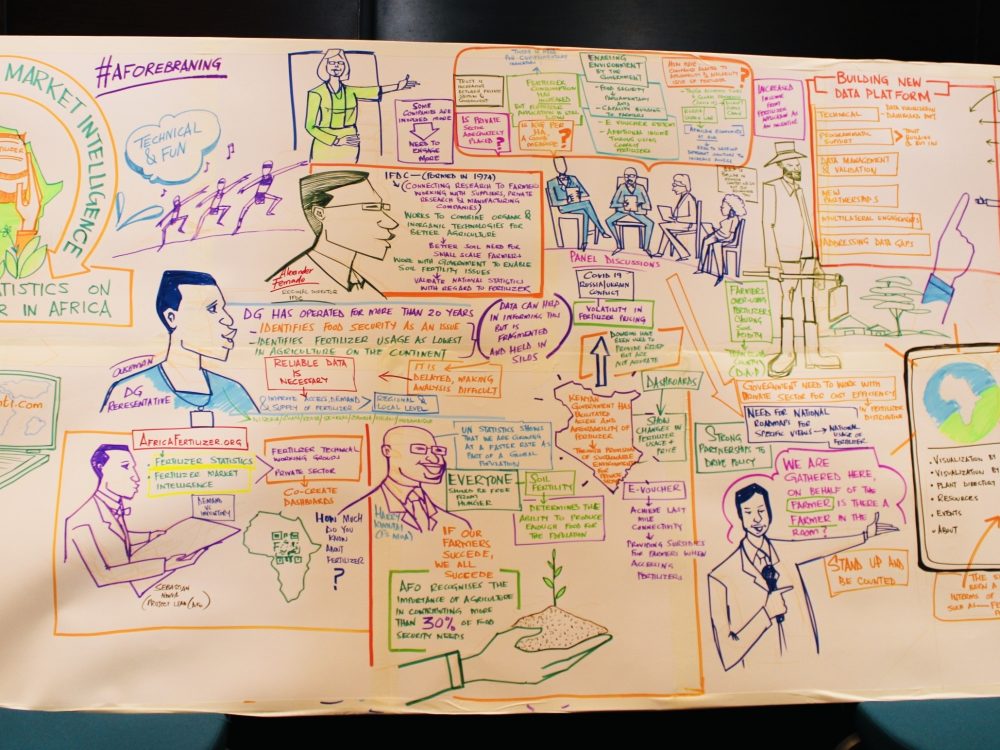
Ghana VIFAA Dashboard Soft Launch and Feedback Workshop
In the last week of February 2021, the VIFAA Technical Team completed the prototype VIFAA dashboard for Ghana. This dashboard is one of three dashboards, with Kenya already launched and Nigeria in development. This interactive, user-friendly site enables users to:
- View key data on fertilizer price, use, availability, and plant directory in one place;
- Interact with different fertilizer products across years of data; and
- Download data in a variety of formats.
The dashboard currently showcases thirteen different graphics from the five key indicators. In March 2021, the team showcased a draft dashboard to stakeholders for the first time. They collected feedback to improve the ease of use of the visualizations, ease of navigation and interpretation, and usefulness of the dashboard.
DG will apply the feedback obtained from the stakeholder workshop to iterate on the user interface. For example, we will add qualitative data to the graphs to help users better understand and analyze trends in some of the charts, and we will simplify some graphics to further align with user priorities.
Next Steps
As a public sector stakeholder noted, “the credibility of this dashboard is not in doubt. Our participation from the beginning till now signifies our ownership of the process in the realization of the dashboard has been very strong and we will make sure it is sustained.” Going forward, DG will continue to engage and incorporate feedback as stakeholders start to use the dashboard in their work, and to make improvements to ensure the dashboard can be more impactful on decision making.
Secondly, DG will continue to collaborate with stakeholders in Ghana to gain insight on other individuals or institutions we should engage and to gauge their role in the use and sustainability of the dashboard. Additionally, stakeholders have expressed the need for the inclusion of indicators such as Fertilizer Use by Crops (FUBC), Soil Nutrient Levels, and Crop Yields into the dashboard. As such DG will engage with stakeholders on strategies to address data gaps identified in these indicators. This will include working with stakeholders to identify data sources and how to access them to fill data gaps in these processes.
If you’re interested in learning more about the Ghana Fertilizer Dashboard, please contact Wekem Raymond Avatim ravatim@developmentgateway.org or Vinisha Bhatia-Murdach vbhatia@developmentgateway.org.
VIFAA Going Forward
In November 2022, AfricaFertilizer (AFO), our partner on the Visualizing Insights on Fertilizer for African Agriculture (VIFAA) program, rebranded and launched a new website. This website includes the integration of country-specific VIFAA dashboards, which were previously housed in separate websites. By integrating the country-specific dashboards as well as fertilizer data on trade, production, consumption, and retail prices for 18 countries in sub-Saharan Africa, the new AFO data allows easier comparative analysis across countries and contributes its quota to the advancement of food security throughout Africa.
We have updated the previous country-specific dashboards links to now redirect you to AFO’s new website in order to ensure you are accessing the most up-to-date resources.
Share
Related Posts
From Data Gaps to Impact: Key Insights from the VIFAA Program
Over the last six years, DG, together with its partners AfricaFertilizer (AFO) and Wallace & Associates, collaborated to implement the Visualizing Insights on Fertilizer for African Agriculture (VIFAA) Program. In the program’s final year (2024), the team undertook a “program learning process” to reflect on outcomes, challenges, and successes through internal interviews. This blog captures five key learnings, which we hope will guide similar programs aiming to bridge data gaps in agricultural development.

Case Study: Fostering Sustainable Agriculture through Data-Driven Collaboration and Partnership: Ethiopia, Mozambique, and Nigeria
Through DG’s Visualizing Insights on Fertilizer for African Agriculture (VIFAA) program, we recently published a case study titled “Fostering Sustainable Agriculture through Data-Driven Collaboration and Partnership: Ethiopia, Mozambique, and Nigeria.” It dives deep into how the VIFAA program has impacted the fertilizer data and markets in Ethiopia, Mozambique, and Nigeria. In this blog, we explore the overall impact that the VIFAA program is making, why the program was needed, and offer some key highlights from the case study.
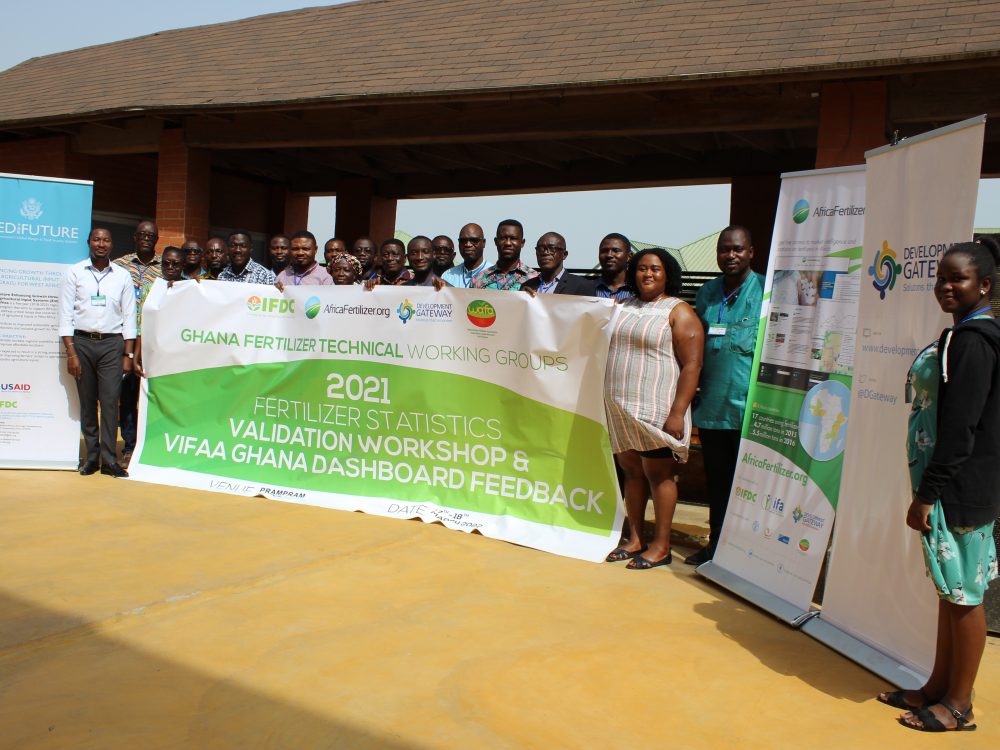
Fertilizer Technical Working Groups Provide Key Insights into Africa’s Fertilizer Sector
From June 2021 to September 2022, Development Gateway: An IREX Venture’s (DG’s) Visualizing Insights on Fertilizer for African Agriculture (VIFAA) program convened 12 Fertilizer Technical Working Groups in 14 countries which have yielded essential information on Africa’s fertilizer sector, including insights on how geopolitical events have impacted the fertilizer sector and what is needed to mitigate resulting threats to food security throughout Africa.

Empowering Counselors and Social Workers with Rapid Access to Patient Information
Linda Sanogo, a DCDJ Fellow in Côte d’Ivoire, worked with a community health facility to develop and train staff on a new database, as well as complete training on other IT systems. Because of Linda’s support, the facility has reduced the number of hours spent managing patient records, and opened up more time to ensure high-quality care.
Background
The Des Chiffres et Des Jeunes (DCDJ) Data Fellowship is a flagship DCDJ program that places technically-trained Ivorian youth into organizations where they encourage and increase the degree to which data is used for decision making. It is a unique opportunity for young people to sharpen data skills while contributing to a strengthened data ecosystem and to data-related resource availability in Côte d’Ivoire. DCDJ is led by Development Gateway and funded by the Data Collaboratives for Local Impact (DCLI) program. The DCDJ Data Fellowship builds young peoples’ skills to strategically catalyze sustainable change, DCDJ leverages local capacity to improve data access, sharing, and availability.
Prior to becoming a fellow, Linda was in an IT training program. She was particularly interested in learning more about how data science could be used in her daily and professional life.
Problem
After the intensive DCDJ Data Fellowship training, Linda’s internship placement was at a community health facility in Port-Bouet Gonzaqueville. She noticed that the health facility was generally well run, but that there were opportunities to improve maintenance of proper patient records. Two issues converged to result in poor quality data:
- The facility had 1024 active patient records, with 25 to 60 new patients – and patient records – added each month. These records were kept in paper files. Every day, the social workers, counselors, and other staff would need to ask the Data Manager to pull information from the 30 records for the patients they would be seeing. Records were not always easy to locate, and sometimes patients would be told to come back another day once their record was located. In addition, all record updates had to go through the Data Manager, which could take several extra days.
- The second issue Linda saw was that despite having a computer system at the facility, the counselors and social workers were “afraid to even turn the computers on,” and did not feel that they had enough technical knowledge to use them.
Solution
Linda understood that the social workers and counselors were undertaking a huge amount of work that truly impacts the lives of people in the community. At the same time, the way the health facility was maintaining records was creating additional work. The solution Linda developed was two-fold, first to create an electronic database of patient records that would be easy for staff to use – and that connected to the larger SIGDEP2 system which manages the country’s patient-level HIV data; and second to train the staff to use both the new database and SIGDEP2.


Process
In training staff that had such little experience using computers, Linda started with the basics – how to turn the computer on, what types of programs were available, and how to search for information on the internet. She trained four female staff members (counselors and social workers) in these basic skills. Then, working with the Data Manager at the facility, she developed an Excel database that interfaced with the SIGDEP2 system. Linda continued to expand training for the women to include both the new database and SIGDEP2. There was hesitancy at first as the women did not see how computer skills or the new databases would be useful in their work. However, after some time and guided training strategies, they became comfortable with the systems and saw how easy it was to pull up information on the patients they would be seeing on a given day; for example, they could easily find out if a patient was up to date on his medication or needed a new prescription. With these skills, the women healthcare administrators at the community center could become more confident in their work, boost their efficiency, and grow their careers – contributing to an important increase in women in data science.
Outcomes and Impacts
Four additional staff are now trained and using the new systems. The new systems make the counselors and social workers more autonomous. They are now comfortable searching the database and SIGDEP2 directly for needed information rather than going through the data manager. The time saved by staff goes to ensuring better quality patient care and making sure that patients are supported and do not lose track of their appointments or become marked as “Interruption in Treatment (IIT).”
Additionally, Linda’s work had an even larger impact on the overall data ecosystem. Now instead of waiting days for physical records, or having to go through the Data Manager, staff can use the available databases to find the information they need. The Data Manager now spends less time pulling records for other staff and can put more time into ensuring quality records and managing the system. With SIGDEP2 and Linda’s database in place, the facility can now see which tasks are most challenging and time-consuming, and can adapt their internal processes to be more efficient.
Conclusion
Linda’s passion for data science has stayed with her after the DCDJ Fellowship. Now she works in a private IT company, where she is using data science to track incident reports. Her new company is realizing that tracking and using the data from incident reports has created a more efficient allocation of technicians – and also has started investing in data science as a result. Of the DCDJ experience, she said, “If it were up to me, all young people would be trained in data science!”
Share
Related Posts
Using Data to Build Health Resilience From the Ground Up in Côte d’Ivoire
Through a dashboard providing information on priority health centers in Abidjan, users better understand how patients are moving through the system and where additional training is most needed.
Background
Across Abidjan, PEPFAR priority health facilities have varying levels of technical capacity, data infrastructure, and management practices to access patient health data.
Des Chiffres et Des Jeunes (DCDJ), led by Development Gateway and funded by the MCC-PEPFAR Data Collaboratives for Local Impact (DCLI) Program, has developed an initiative to address these disparate data needs and collect all priority health center data in one central location. Called the “23/23 Initiative,” this work addresses specific data gaps in each priority site and determines what types of training, targeted placement of Data Fellows, and improvement of data systems would lead to better performance and outcomes of each site. It has connected 23 fellows with 23 priority health sites to improve awareness about the value of data, systems and decision-making, and to make each center more efficient to better serve communities.
Overall, DCLI is designed and managed by MCC and funded by PEPFAR, and aims to empower individuals, communities, and organizations, including stakeholders in subnational areas, to use data to improve lives, contribute to ending HIV/AIDS, and help address local development needs and priorities. The 23/23 Initiative is hyper-local, focused on the data needs of priority sites and healthcare workers to work more effectively.
Problem
When DCDJ Data Fellows were placed at each of the 23 priority health facilities in Abidjan, they immediately observed opportunities to strengthen data collection, management, and use at the sites. It was clear that a one-size-fits-all solution to improving data use in each priority healthcare site would not be sufficient to address unique issues like inconsistent patient management techniques, patients that have faced an Interruption In Treatment (IIT), and a time-consuming emphasis on data entry and reporting “up” – instead of time and effort to derive insights for local use.
The Data Fellows confirmed that basic data skills are lacking at health centers in Abidjan, and that health workers do not have the resources to solve their day-to-day challenges. They found that a centralized data source would be a useful tool for deriving locally-relevant insights.
Solution
Twenty-three Data Fellows surveyed key constraints of data use in each facility. Based on survey results, the DCDJ team worked to co-create tools and solutions to address gaps around data in the priority sites and to determine whether training (of clinic staff and related stakeholders), placement of Data Fellows, and improvement of data systems at the local level can lead to better performance of these health centers.
Building on survey results, the Fellows determined that a national health site performance dashboard would bring critical information together to better manage appointments, IIT treatment plans, and patient information. When scaled up across all priority health sites in Côte d’Ivoire, it would present KPIs and trends, visualize local pharmacy inventory, and enable pharmacy records reconciliation.


Process
The process to build the dashboard started in early 2020. The DCDJ team and the Fellows worked closely with health facility personnel to understand their needs and priorities related to patient information, create “test” data to understand the tools, and gather detailed feedback. To build the tool, the team also worked in partnership with the Côte d’Ivoire Directorate of Informatics and Sanitary Information (DIIS), which collects and manages health data at the national level.
The team built a dashboard that shows breakdowns of patients that have faced an IIT and have recovered, or have begun to seek treatment elsewhere. For PEPFAR, tracking IIT patients is essential to increasing the overarching quality of care for HIV/AIDS patients. The system also compares healthcare facilities side-by-side, to best track patients’ treatment plans. Building the tool also required close coordination with the DIIS, because much of the data required for this dashboard is owned by DIIS – and Dashboard would also provide its personnel with added insight on which health facilities are meeting their targets and which need assistance. The tool was built using PowerBI, a standard data analytics software that enables an API to interface with the DIIS’s own systems, as well as with OpenMRS, which is a facility-level patient information portal including medical registration, patient addendums, and administrative information.
Outcomes & Impacts
The dashboard enables health facilities to track patients’ treatment progress, and is used to help bring people who had abandoned treatment back to their treatment plans – a key priority for both DIIS and PEPFAR.
Despite potential slowdowns due to COVID-19, DCDJ Data Fellows have continued to build out the dashboard, provide remote training, and analyze data using the tool. Doing so has had huge impacts on the health system in Côte d’Ivoire – the more individuals enrolled in active treatment, the healthier the country becomes as a whole.
The dashboard also enables PEPFAR to target interventions more specifically towards groups that are most often being marked as IIT, and monitoring & evaluation is underway to compare effectiveness across facilities that do and do not receive its support.
Finally, working directly with data in OpenMRS, users of the health facility dashboard can derive more useful key insights on data use, not only nationally but all the way down to facility level. Paired with the opportunity to scale the dashboard beyond the current 23 implementation sites to all health facilities in Côte d’Ivoire, this initiative has the potential to improve the availability and usefulness of health data across the country.
Share
Related Posts
Episode 3, Season 1 | Geography: Expanding & Deepening DG’s Regional Footprint
In Episode 3 of "Data… for What?!", Development Gateway’s new podcast, we explore how we are prioritizing our geographical focus in the coming years. Conversations with Vanessa Baudin Sanchez, Carmen Cañas, and Charlene Migwe-Kagume highlighted the opportunities and challenges of expanding our portfolio in Central America and deepening our work and partnerships in West, East, and Southern Africa.
Lancement du prototype de la plateforme Cashew-IN
Des données exhaustives et fiables peuvent contribuer à accroître les profits, à réduire les pertes ainsi qu’à améliorer la compétitivité des agriculteurs, des producteurs, des transformateurs et des autres acteurs du secteur de la noix de cajou. Development Gateway (DG) s’est associé à Cultivating New Frontiers in Agriculture (CNFA) dans le cadre du projet PRO-Cashew de l’USDA pour l’Afrique de l’Ouest pour développer Cashew-IN, une plateforme de collecte et d’analyse de données.
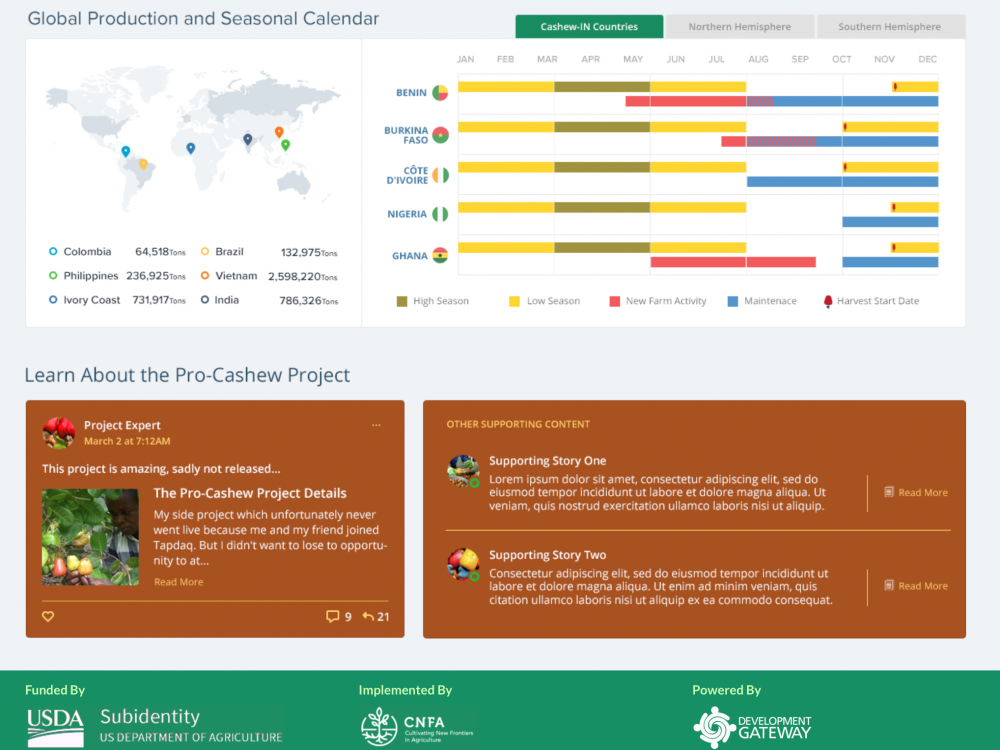
Launching the First of It’s Kind Cashew-IN Platform Prototype
For cashew farmers, producers, processors, and others in the West African cashew sector to increase profits, reduce loss, and improve global competitiveness, comprehensive and reliable data is required. Development Gateway has partnered with Cultivating New Frontiers in Agriculture (CNFA) under the USDA West Africa PRO-Cashew project to develop the Cashew-IN data collection and analysis platform.
One Year of TASAI-VISTA
In November of 2019, The African Seed Access Index (TASAI) and Development Gateway (DG) launched a partnership: Visualizing Information on Seeds Using Technology in Africa (VISTA.) This program aims to help decision-makers, public sector, development partners, private sector businesses, and farmers visualize and use data to support a fully functional formal seed system. DG and TASAI are working to digitize the data collection and validation process through digital survey tools, which will transform the data collected into easy-to-understand data visualizations and a publicly accessible dashboard. The dashboard will assess seed quality, availability, and accessibility in 11 countries in Africa with additional countries to follow. The program’s goal is to build a more coordinated, multi-stakeholder effort that tracks a country’s progress toward a healthy, sustainable, inclusive seed system.
Highlights from Our First Year
In February of last year, TASAI finalized a full indicator and methodology review to address feedback from stakeholders. Following the review, TASAI launched full country studies in Malawi, Uganda, Ghana, Nigeria, Kenya, Burkina Faso, and an update study in Mali. These studies were conducted using paper-based surveys, allowing DG to understand and document the first step in TASAI’s data lifecycle process.
We built TASAI’s survey tools using Open Data Kit, and have recently transitioned to Kobo Toolbox, which allows for data to enter directly into the database – rather than importing data from Excel after. DG also worked with TASAI to document and digitize the data validation and analysis processes, starting with setting data “rules” at the time of survey data collection. This function will save time for the researcher collecting data and act as a quality control check.
Data collected through the survey tool then moves into the data validation and analysis tool where TASAI can manage and correct data, import secondary data, generate report tables, and develop the core variables and indicators previously calculated manually in Excel.
From the onset of our program, we knew that user engagement would play a significant role. As a result of the COVID-19 pandemic, we had to change our initial approach. We started a pilot engagement plan in six countries to map users versus relying on research inception and dissemination meetings to meet directly with users. Through the pilot plan, the team was able to identify a comprehensive list of TASAI users, and then to map user types to information needs. As part of the user mapping, we interviewed 18 stakeholders in the fall of 2020. From the mapping and stakeholder interviews, we learned more about which indicators and information we will prioritize for the dashboard. While we had intended for this to be done in-person during the in-country meetings, conducting these consultations remotely allowed us to keep making progress through the pandemic.
Where We’re Going
Ensuring that the TASAI’s methodology and indicators are gender-sensitive will continue to be a focus, as we hope to partner with gender-focused organizations and programs working in the agriculture and seed sectors. As for stakeholder engagement, we are in the process of identifying the best path moving forward that allows us to understand how TASAI data are used, while not over-complicating and over-monitoring the engagement that is already taking place. 2020 was the first year of a three-year partnership. In the next year, we will be increasingly focused on visualizing TASAI’s data to meet the needs of their stakeholders. We’re also working on fine-tuning the processes and technology that we collectively put in place last year. TASAI will also be conducting country studies in Rwanda, Ethiopia, Tanzania, Mali, and Mozambique starting this spring.
Share
Related Posts
Sourcing Fertilizer Data in Sub-Saharan Africa
In advance of the first VIFAA country dashboard launch next week, we will explore the importance and source of accurate and reliable data for each of the indicators. This is a crucial step in making data available in a way that stakeholders can use to inform their decisions.
Our Partnerships Make Us DG
Out of DG’s twelve core values, five are centered on partners and partnerships. Our ability to achieve sustainability and impact is greatly dependent on our strong partnerships, which expand beyond our expertise alone. From our early days co-designing the Aid Management Platform with the Government of Ethiopia and other partners, to today, partnerships are what make DG, DG.

Launch of The African Seed Access Index (TASAI) Visualizing Information on Seeds using Technology in Africa (VISTA)
The timely availability of high-quality, affordable seeds is critical to improving food security, resilience, and livelihoods for smallholder farmers in Africa. In partnership with TASAI, Inc., DG is proud to announce the launch of the TASAI VISTA program.
Digitizing Patient Records for Improved Patient Care
Blanchard Kablam, a DCDJ Fellow in Côte d’Ivoire, developed MyTrack – an app that digitizes the filing system of Houphouët-Boigny General Hospital. Through the app, the hospital reduced the number of hours spent tracking down patient records by 75% – and can see more patients per day, provide better service, and reduce patients categorized as IIT (interruption in treatment). This story was originally posted by Data Collaboratives for Local Impact here.
Background

The Des Chiffres et Des Jeunes (DCDJ) Data Fellowship is a flagship DCDJ program that places technically-trained Ivorian youth into organizations where they encourage and increase the degree to which data is used for decision making. It is a unique opportunity for young people to sharpen data skills while contributing to a strengthened data ecosystem and to data-related resource availability in Côte d’Ivoire. DCDJ is a program led by Development Gateway and funded by the Data Collaboratives for Local Impact (DCLI) program. The DCDJ Data Fellowship builds young peoples’ skills to strategically catalyze sustainable change, DCDJ leverages local capacity to improve data access, sharing, and availability.
Before the DCDJ Fellowship, Blanchard was an IT technician and graduate student in mathematics. He described himself as “obsessed with data science,” and was excited for an opportunity to gain new skills and practical experience. After the Fellows training, Blanchard was placed with an HIV/AIDS care unit at Houphouet Boigny General Hospital.
Problem
When Blanchard arrived at the hospital for his placement, patient records were still managed in physical, paper formats. All appointments scheduled for a given day would have their files pulled by staff the day before. The care unit had more than 1,700 active patient files, four staff alone were dedicated to managing the filing system, and a task as simple as finding current patient contact information could take much longer than five minutes. On average, only 20 patients and files could be processed per day. This system was ineffective for both staff and patients. Patients missing appointments could easily go unnoticed, and appointments would run long trying to recapture missing or unrecorded information. Depending on how the patient came into the system or what other hospital services the patient had used, the file may have originated in the emergency department and could change hands several times, making tracking down files a huge undertaking. When files got lost, the information was nearly impossible to recreate.
Solution
The old filing system was not just a headache, it was also repetitive work – and a waste of precious time. Blanchard knew that any repetitive task could become automated. The hospital had computer systems and was using Excel to track some patient information, but they did not have a true system for patient records. The solution was to digitize patient records into a secure app called MyTrack. This app now houses all patient records in a searchable and database. Staff use the app to track medication, viral load, appointments, contact information, and more. Patients can also log into MyTrack to manage their own healthcare needs.

Processes
MyTrack was built using Python and is available on PC, Android, and iOS. Blanchard worked to develop this app with several other DCDJ Fellows and with support from the DCDJ trainers and mentors. Each component was reviewed by the hospital’s data manager to ensure a seamless fit with existing systems. In addition to the patient care functionalities, Blanchard and the development team are proud of the steps they took to ensure the system is secure – specifically considering the sensitive data held in MyTrack. To access specific patient information in the application, the user will need a password which is issued exclusively by the HIV/AIDS manager. Additionally, the history and activity for MyTrack are kept in a separate application, and can only be accessed internally. Finally, the app has defined user types (by staff levels, patient, and group types) which allows permissions to be adjusted based on specific user requirements.
Outcomes and Impacts
The MyTrack app has now been in place since May of 2020, and the hospital has seen positive impacts. Now that patient files are digitized, the hospital has one instead of four staff members dedicated to managing the filing system, and the HIV/AIDS care unit is now processing an average of thirty more patients and files per day than before MyTrack. Additionally, MyTrack has reduced the number of hours spent tracking down patients and updating their records by 75%.
Not only has the patient tracking process has become more efficient, but data quality has improved as well. The care unit now has a better understanding of the total number of patients in their care and can distribute the patients more evenly across care providers. Patients get notified in advance of appointments and MyTrack automatically tracks patients missing appointments or lost to follow up. The app also ensures that patient appointments are scheduled to align with prescription refill needs, so patients are not without medication.
Conclusion
Blanchard is hopeful that MyTrack will eventually connect with systems like SIGDEP2 or other health databases at the regional or country level. For now, it is supporting decision-making at the hospital level. The management team is using MyTrack to understand patient flows, healthcare gaps, and staffing needs. Recently, for example, adjusting the number of community counselors available to provide care.
DCDJ has changed the way Blanchard thinks about data. Before the Fellowship, he had a blurry vision of what data science looked like in practice, and how it could benefit daily life. Now he sees it as his calling and is pursuing a career in the data science field.
Share
Related Posts
Streamlining Doctor-Patient Communication to Personalize Care
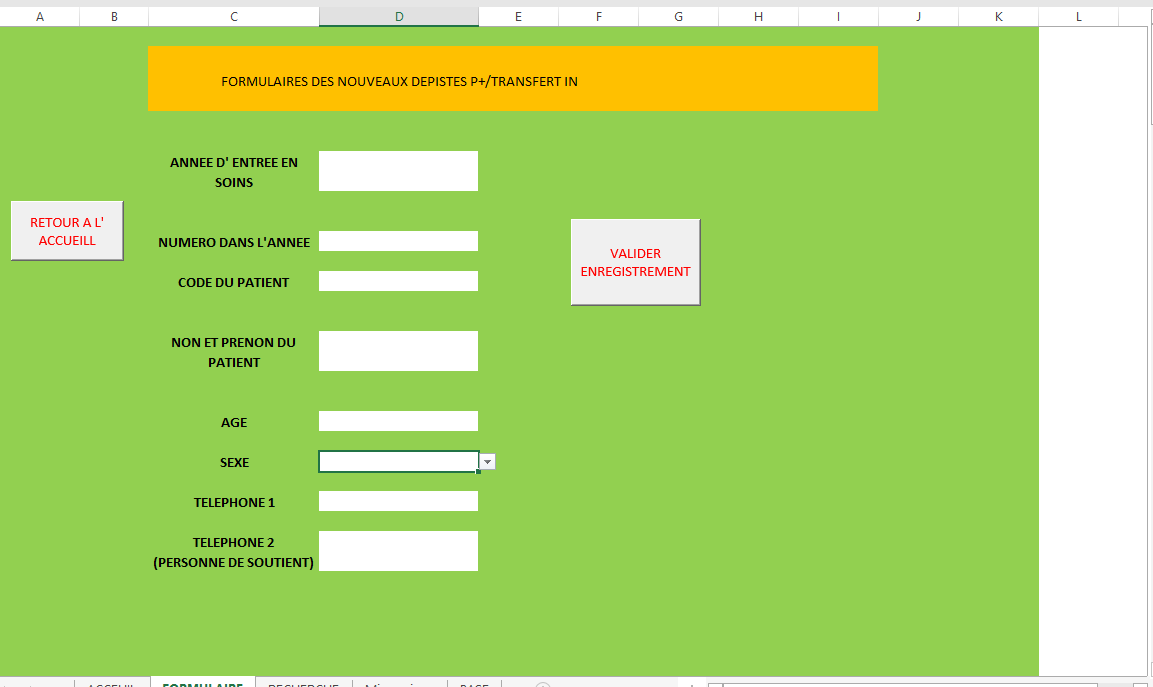
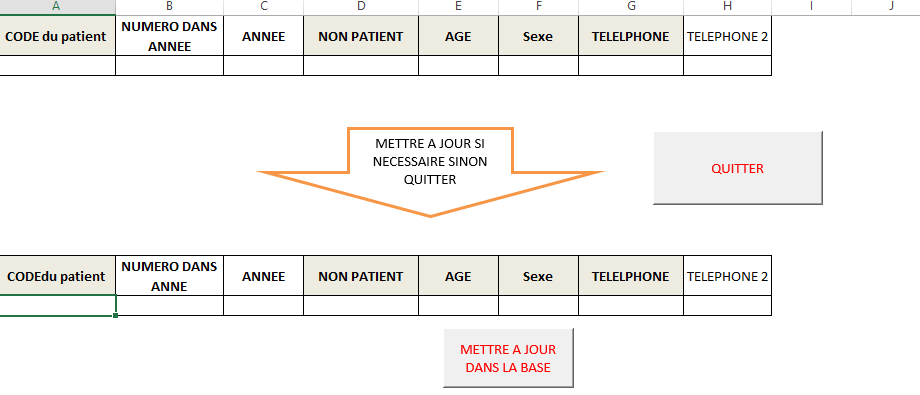
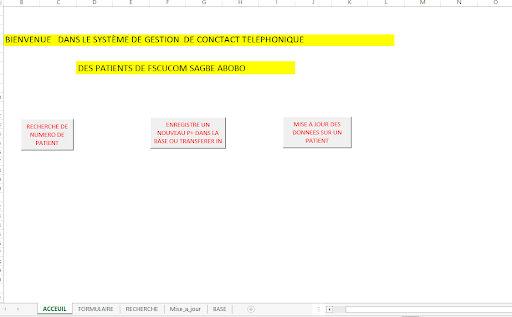
Abdoulaye Bagaya, a DCDJ Fellow in Côte d’Ivoire, developed an app for FSU COM Abobo Sagbe Hospital during his 7-month internship placement. The app helps community counselors, healthcare assistants, and clinic counselors manage patient contact and treatment information.
Background
The Des Chiffres et Des Jeunes (DCDJ) Data Fellowship is a flagship DCDJ program that places technically-trained Ivorian youth into organizations where they encourage and increase the degree to which data is used for decision making. DCDJ is a program led by Development Gateway and funded by the Data Collaboratives for Local Impact (DCLI) program. The DCDJ Data Fellowship builds young peoples’ skills to strategically catalyze sustainable change, and DCDJ as a whole leverages local capacity to improve data access, sharing, and availability.
Abdoulaye Bayaga, a DCDJ Fellow, used his 7-month internship at a hospital in Abobo, Côte d’Ivoire to build a tool that helps doctors and healthcare facilities more easily contact patients and track their medical history. This helps the hospital save time, stay in closer touch with patients, and ultimately reduce Interruption in Treatment (IIT) cases.
Problem
Before Abdoulaye arrived at the hospital in Abobo, healthcare workers would manually look up phone numbers to call about 60 patients per day before their appointments. This process involved searching through hard copies of patient files, paperwork, and other information to find patients’ records and contact information – sometimes unsuccessfully. The hospital’s community counselors were the ones burdened with managing nearly 800 total patients, tracking down contact information, and calling patients.Without contact from the hospital, patients are left largely to themselves, expected to be engaged in their care sufficiently to own and manage their medical conditions in a timely manner.
Underscoring this challenge, community counselors were not the only ones working with the patient records – doctors and other administrative staff would all regularly handle the same physical records. It was difficult for multiple people to reference the same information at the same time when only one physical copy of the record was available.
Solution
Abdoulaye assessed this situation at the site, identifying the main challenge was that community counselors were having a hard time finding patient contact information to confirm appointments. This was often because another person would be holding the physical file, or because the file was simply misplaced or lost.
Abdoulaye came up with a tool that would digitize the name and phone number of the patients – enabling counselors to more easily contact patients whenever they would miss appointments.
Processes
Abdoulaye used Excel and Microsoft Visual Basic to develop the tool. He focused on two easy-to-use methods that community counselors – less familiar with complex technical solutions – would be able to integrate into their daily work. He also completed in-depth training and a webinar tutorial for community counselors to use the tool independently. Because of Covid-19, additional in-person training could not be completed; however, the webinar tutorial was an easy, remote alternative that empowered counselors to be trained on their own time, on their own schedules.
Outcomes and Impacts
First and foremost, the tool optimizes community counselors’ time at the hospital. Before the tool, it would take 1-2 days for counselors to gather all the contact information to call patients. Now, thanks to the app, needed information is ready in 25-30 minutes. Instead of spending days collecting information, they have been dedicating their saved time to home visits with patients, delivering medications, and providing personalized care. With increased home visits, community counselors can better ensure patients are taking their medications daily. Additionally, they can focus on health promotion, reducing HIV/AIDS stigma, and providing advice to people who have been recently diagnosed with the disease. These patient home visits, supporting mental wellbeing, and as Abdoulaye put it, “letting [newly diagnosed patients] know it isn’t the end of the world, and that their lives will continue on.”
Conclusion
Instead of having to continuously search for patient records to track down their contact information, community counselors can now pay special attention to personalized healthcare – essential for HIV/AIDS positive patients – to ensure they continue to seek the care they need. According to NIH research publications, home visits decrease costs, improve health outcomes, and reduce hospital stays. Not only has Abdoulaye’s tool drastically changed the way this Abobo hospital is able to provide care, Abdoulaye himself learned a lot during the process. As a statistician by trade, he can now use a wider range of technical tools and machine learning algorithms to analyze data, build dashboards, and support decision-making. Moving forward, in addition to continuing his endeavors in healthcare data use, he also plans to take his knowledge gained as a DCDJ Fellow to the fiscal and tax industry as well.
Share
Related Posts

Using Data on Traditional Medicine to Help Trace HIV/AIDS Outcomes
Des Chiffres et Des Jeunes (DCDJ) aims to bolster the subnational supply and usage of data for citizens of Côte d’Ivoire, engage youth as champions of these services. Through the DCDJ Fellowship Program, Ivorians 18 to 34 spend two months in intensive data science and analytics training. Following the training, Fellows are placed in internships to support their hosting organizations in making data-informed decisions. DCDJ is a project of the Data Collaboratives for Local Impact (DCLI) program, a partnership between PEPFAR and the Millennium Challenge Corporation (MCC.)
This story was originally posted on the DCLI website.
Background
In Côte d’Ivoire, it is estimated that 80% of the population uses traditional medicine, especially in rural areas. A 2014 study by the University Research Co, LLC (UR) on the factors influencing the USAID Health Care Improvement (HCI) showed that a higher percentage of patients using traditional medicine were experienced “Interruption in Treatment (IIT)” 12 months after treatment, meaning that their prognoses are more difficult to track and monitor.
The National Program for the Promotion of Traditional Medicine (PNPMT) is a program of the Ministry of Health and Public Hygiene (MSHP) of Côte d’Ivoire, similar to the National Program for the fight against AIDS (PNLS). Managed by doctors, pharmacists, anthropologists and other government officials, the PNPMT is responsible for ensuring the proper functioning of traditional medicine activities. It also ensures that practitioners are aware of compliance with Law No. 2015-536 of July 20 2015, on allowances regarding the practice of traditional medicine and pharmacology in Côte d’Ivoire.
Problem
Côte d’Ivoire’s traditional medicine centers (Centres de Médecine Traditionnelle, CMT) have a similar function to the First Contact Health Establishments (Etablissement Sanitaires de Premier Contact, ESPC) and are required to deliver monthly reports on the services they provide (such as the number of visits, number of patients by illness, and drugs prescribed). However, a 2014-2018 PNPMT activity report shows that of the 390 CMTs authorized by the government, only 2% on average actually submitted their required monthly reports.
Because so little data is reported, the poor quality of the limited data available complicates analysis for decision-making and more specifically limits the traceability of patients who request services. This may explain the lack of data on traditional medicine in the National Health Information System (Système National de l’Information Sanitaire, SNIS). According to Dr. Kroa Ehoulé, Director of PNPMT, “a major challenge for conventional medicine practitioners remains that ‘IIT’ patients are mostly traced back in their communities at CMTs and prayer camps. However, there is no effective data management system that enables data on traditional medicine to be included in the SNIS. If a method of collecting traditional medicine data did exist, it would confirm this state of affairs and enable the necessary adjustments to align modern and traditional medicine data.”
Solution
Through the DCDJ Data Fellowship, Dongo was placed at PNPMT to help the organization identify and address its data management issues. Dongo proposed a solution that aimed to integrate traditional medicine data into SNIS, by developing and implementing a tool for collecting, compiling, and analyzing reliable traditional medicine data, and automating report production. Moreover, to ensure the success of the proposed solution, Dongo also prioritized supporting the CMTs in owning the tool themselves – by welcoming it into their work, integrating it into their processes, and educating and training traditional medicine practitioners to use it.

Process
Dongo conducted an initial needs analysis to inform his implementation plan. Based on this, he developed a tool called OCAR.CMT (Data Collection, Analysis, and Reporting Tool for CMTs) in the Visual Basic programming language, which was installed in CMTs that had the equipment, computers, and staff to collect data electronically. Practitioners now have their own management system for traditional medicine data, the same way that the Ministry of Health and Public Hygiene (MSHP) has the District Health Information Software (DHIS2) health system software.
During the tool’s pilot phase, PNPMT and DCDJ organized workshops in which 64 participants, including PNPMT staff, SNIS users, and traditional medicine practitioners built awareness of data culture and the use of OCAR.CMT. In addition, during a meeting of the West African Health Organization (WAHO), Dongo trained 42 practitioners and experts in traditional medicine from 15 ECOWAS member countries on the use of the OCAR.CMT tool.
Results and Impact
Since Dongo established OCAR.CMT, 7 pilot sites have regularly been using the tool for both patient management and monthly production of reports. OCAR.CMT has enabled the registration of 665 new patients (51% women and 49% men) that had previously been untraceable, including 17 HIV-positive individuals (76% women and 24% men). Additionally, one of PEPFAR’s main challenges in the fight against HIV/AIDS has long been the difficulty of reaching men – and initial data reported in the system shows that a large portion of men visit CMTs rather than modern medicine treatment facilities. OCAR.CMT has the potential to help PEPFAR better target its interventions to meet men’s needs.
The adoption of OCAR.CMT by 8,500 CMT practitioners provides a clinical database of traditional medicine patients, including people living with HIV. There will also be additional validation workshops with the DIIS, integration of validation findings, and continued technical and capacity building support for the CMTs required in the future. Moving forward, the tool will also help meet PEPFAR’s objective of improving traceability of positive patients, to carry out awareness-raising, and encourage ‘IIT’ patients to return to the treatment circuit.
Following Dongo’s efforts, and thanks to the leadership of PMPNT’s Director Dr. Ehoulé, PNPMT is committed to mobilizing financial resources to extend the project across the country. In February 2020, notice of the tool was sent to all members of WAHO, which pioneered the first application used by the CMT to collect data. WAHO countries already acknowledge the limitations of their existing software to collect the “full picture” of health data, and expressed the need to expand the OCAR.CMT tool.