DG’s Open Contracting Portal Designated as a Digital Public Good
Development Gateway: an IREX Venture’s (DG’s) Open Contracting Portal (OC Portal) was designated as a digital public good (DPG) and added to Digital Public Goods Alliance’s (DPGA’s) Registry on September 8, 2022. The goal of the DPGA and its Registry is to promote DPGs in order to create a more equitable world, which is in alignment with the vision behind the OC Portal: to organize and archive procurement documents, improve data transparency and feedback by the public, and to help publish procurement information in the Open Contracting Data Standard (OCDS).
What are Digital Public Goods and Why Do They Matter?
The individual and societal need for clean water, electricity, and other commodities gave rise to the notion of the public good (i.e., a good or service provided freely to all members of a society by a governmental actor or civil organization). Similarly, the notion of the DPG arose from the need to address complex problems throughout the world, especially in low- and middle-income countries, coupled with the aim of attaining the Sustainable Development Goals (SDGs) by 2030.
Like public goods, DPGs are digital solutions that are meant to address specific societal needs (e.g., improving literacy rates and creating safe, reliable systems for electronic medical records). In addressing these needs, DPGs advance the equity, sustainability, and well-being of that society. Furthermore, DPGs advance a society’s development by creating a more robust digital infrastructure and by reducing the digital and data divides in that society while contributing to global efforts to reduce these divides.
Generally, DPGs are software, AI models, standards, or content that are open-source, meaning their source code, design and/or data sets are publicly available and can be replicated, modified, and shared freely. DPGs listed on the DPGA’s Registry offer solutions on everything from detecting malnutrition in children under five to combating misinformation and hate speech.
The OC Portal: Helping Governments Spend Better
Through our work, DG has consistently advocated for open source and open data solutions as a means of making technology more accessible and sustainable, prioritizing reuse and engagement from open communities. The OC Portal shows this advocacy in action, with its mission to provide procurement analytics that can be used to improve procurement efficiency and, in turn, reduce corruption and increase impact.
“Delivering digital transformation that works for governments requires reliable, scalable, and well-documented digital tools that are fit for purpose,” said Josh. “Our OC Portal has been successfully designed, developed, and deployed directly with multiple government partners.“
Launched in September 2018, the Government of Makueni County’s OC Portal (Makueni OC Portal) was created to implement open contracting in Makueni County, Kenya; it was the first iteration of the OC Portal that provides both data input and analytics capabilities. Developed by DG in collaboration the Government of Makueni County (GMC) and Hivos, Makueni OC Portal helped Makueni County benefit from procurement analytics that are designed to improve procurement efficiency, increase value for money, and reduce corruption. The Makueni OC Portal allows for the collection of procurement data and maps that data to the OCDS, which makes it usable at a global level.
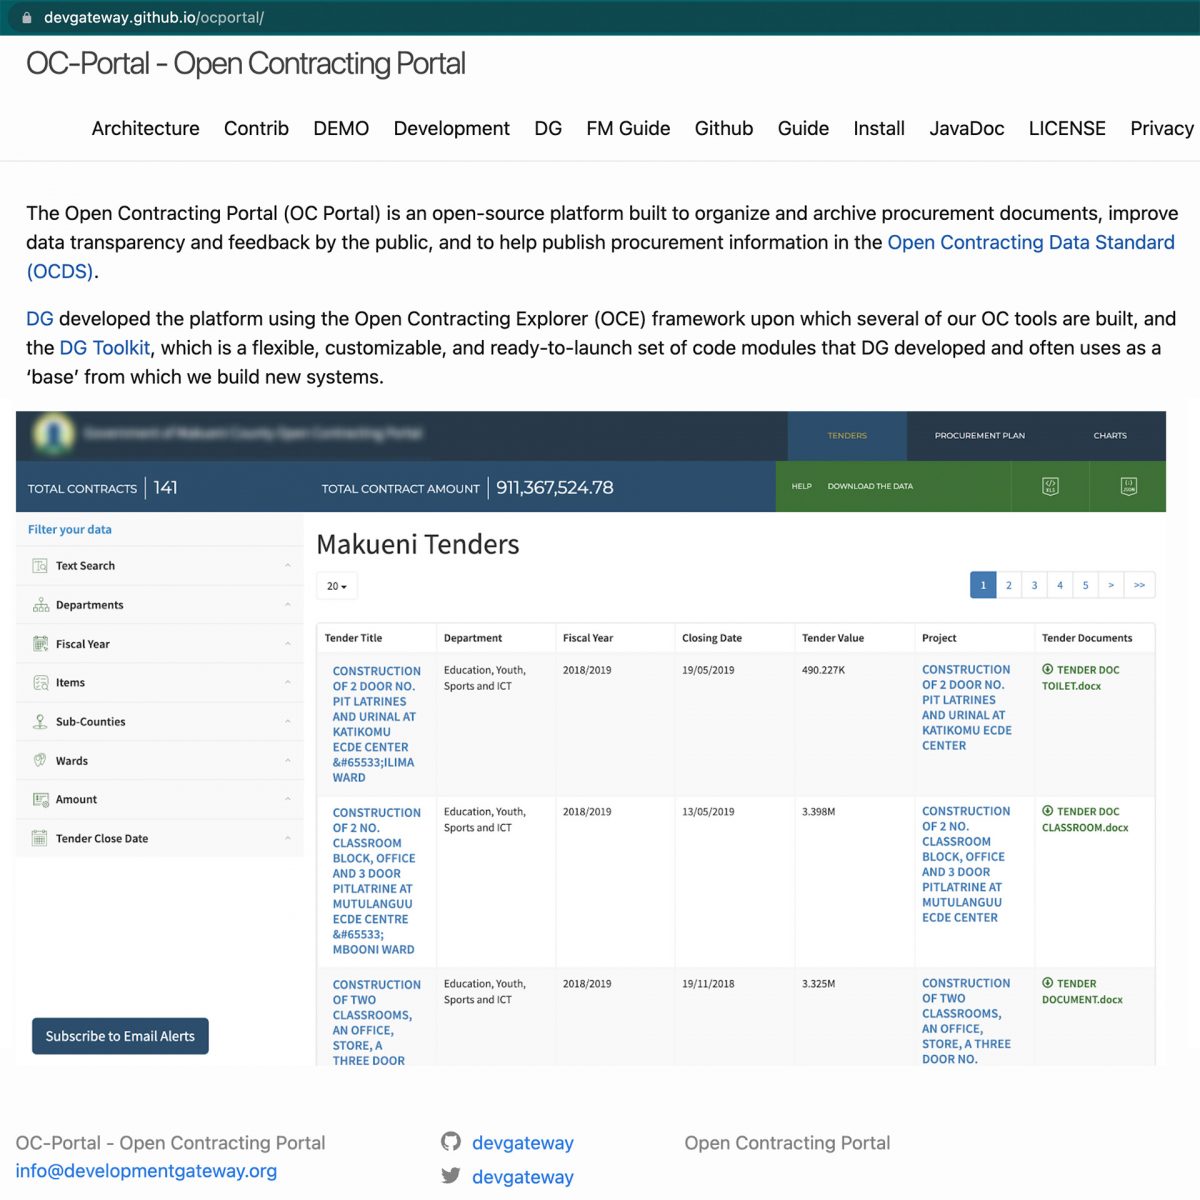
DG developed the platform using (1) the Open Contracting Explorer (OCE) framework upon which several of DG’s open contracting tools are built and (2) the DG Toolkit, which is a flexible, customizable, and ready-to-launch set of code modules (based on the Spring Framework) that DG developed and often uses as a base from which we build new systems.
Since DG launched the Makueni OC Portal, we have continued to work closely with Makueni government officials and the Open Contracting Partnership to ensure that the final tool responds to the government’s needs. After three years of evaluating the effectiveness of the Portal, DG leadership saw the potential for the OC Portal to become a DPG, with the aim of allowing others to more easily learn about the OC Portal as well as implement or improve open contracting systems elsewhere.
“DG was excited at the opportunity to contribute its work to the Digital Public Goods Registry, since we feel that the OC Portal is a tool from which many users worldwide can benefit.” said Vanessa Goas, DG’s Chief Operating Officer. “We were also grateful to the Digital Public Goods Alliance team for providing us feedback and support for making our tools more usable.”
Becoming an DPG: Expanding the OC Portal
Digital solutions, like the OC Portal, can be given DPG status after (1) being nominated and (2) undergoing a three-stage technical review process.

The first few steps in passing the technical review is ensuring the OC Portal meets the DPG Standard, which is the baseline requirement to ensure that digital solutions with DPG status encapsulate DGPA principles.
“The DPG Standard helped us focus on not only making open source tools,” said Fernando Ferreyra, DG’s Director of Software Development, “but also guided us on how to distribute them more effectively, while taking into account all the privacy and data protection policies which ensure that our digital solutions are what we build is used properly, requires a low level of support, and encourages the community to improve upon the digital solution.”
To satisfy the DPG Standard, the OC Portal had to align with nine DPGA-defined indicators, which include ensuring that the digital solution:
- Advances the United Nations’s SDGs;
- Has an open license;
- Has documentation outlining source code, use cases, and/or functional requirements; and
- Shows that it was designed to anticipate, prevent, and do no harm.
With these requirements in mind, the DG team adjusted the Makueni OC Portal, which included: updating privacy policy documents, checking assumptions about how user data is managed, and developing a dedicated website for the portal.
Best Practices for Developing DPGs
Throughout the process of creating the OC Portal, DG identified several best practices for organizations looking to create DPGs and seeking to meet the DPG Standard, which acted as a guide in the process.
- Build with intention: It’s better to think of any potential open source tool as DPGs from the beginning stages of their design, since retrofitting can take a bit of time. Considerations about privacy, password storing, and personal identifiable information (PII) need to be taken into account from the beginning, especially for digital solutions that collect and distribute data (personal or otherwise). These considerations are difficult to incorporate into an existing digital solution; therefore, best practice is to address them during the design phase.
- Adjust internal design principles: As additional digital solutions are designed, advocate that all digital solutions created meet DPG principles, even if they are not going to be submitted as DPGs. These principles are sound and protect the (PII) data.
- Obtain approval from clients and partners (if needed): Determine if the client or partner who is supporting the development of the digital solution is open to having the work be open source and submitted as a DPG.
- Maintain the appropriate licenses: Ensure that the licenses for any frameworks or libraries associated with the digital solution are consistent with the same licensing for the solution itself.
- Keep documentation updated: Ensuring all documentation related to the digital solution is up to date allows for a simplified DPG application process.
- Plan ahead: Allocate resources throughout the project to be ready for DPG submission at previously identified major milestones.
Going forward, we plan to review all of DG’s portfolio of open source applications to develop a strategy on retrofitting our digital solutions to submit others as DPGs (such as our Aid Management Platform).
Share
Recent Posts
Building Lasting DPI Through Local Ownership: Lessons from Ethiopia’s Livestock Information System
Sustainable DPI depends on more than technology – it requires local capacity and government ownership. Drawing on lessons from Ethiopia’s aLIVE program, this blog explores how investing in both can build more resilient and lasting DPI.
Three Fundamentals for Climate and the Future of Health
Climate change is no longer a distant environmental concern; it is a growing public health challenge. Reflecting on discussions during London Climate Action Week, this blog explores why stronger investment, cross-sector collaboration, and better data are essential to building climate-resilient health systems.

(inter)National Models for Women’s Safety Online
Development Gateway and IREX spent the last year analyzing how different nations approach the "how-to" of online safety regulations. This blog discusses our research, which suggests that the most effective models go beyond reactionary and punitive measures to facilitate a functional ecosystem of trust and accountability.
Announcing Development Gateway’s aLIVE Program: Advancing Livestock Data in Ethiopia
Development Gateway: an IREX Venture (DG)—with funding from The Bill & Melinda Gates Foundation (BMGF) and in partnership with Ethiopia’s Ministry of Agriculture (MoA)—is pleased to announce a new program, a Livestock Information Vision for Ethiopia (aLIVE). This four-year, $5 million program will empower Ethiopia’s stakeholders in the livestock sector to make data-informed decisions by providing relevant, accurate, timely, and digital livestock data and analytics. Ultimately, the aLIVE program will support Ethiopia in meeting national food demands as well as achieving food security while building a robust, more independent economy.
Counting Cattle: Why an Improved Livestock Information System is Needed
Ethiopia’s agriculture sector accounts for 40% of the country’s gross domestic product (GDP) and employs 75% of the country’s workforce.1 Livestock is a key component in this sector—in fact, Ethiopia has the largest livestock population in Africa, with 70 million cattle, 42 million sheep, 52 million goats, 8 million camels, and 56 million chickens.2
Therefore, Ethiopia’s livestock is vital to the country’s economic well-being and is a key component in the government’s aim to create food security and decrease reliance on agricultural imports, as outlined in Ethiopia’s Ten-Year Strategic Development Plan of the Ministry of Agriculture. To meet these goals, Ethiopia needs a more robust tool for managing livestock data, known as a livestock information system (LIS). DG’s goal is to create an LIS that:
- Aggregates standardized livestock data that comes from multiple sources;
- Includes visualizations which will make it easy to understand and engage with key data indicators on livestock; and
- Has backend architecture that meets MoA’s functional and technical needs for appropriate data management and quality assurance features critical to keeping the data up to date.
The current state of Ethiopia’s livestock information is impacted by input data of varied quality and a limited capacity for data analysis, including comparison, which slows down the flow of information to stakeholders and limits their ability to use data to shape production decisions. Exacerbating these concerns are the inability to exchange information between existing digital systems and tools (i.e., a lack of interoperability), gaps in the available data, and limited guidelines and regulations on data governance. With all of these limitations combined, stakeholders have access to only segments of Ethiopia’s livestock sector and therefore, are limited in data-driven decision-making.
Ethiopia’s MoA recognized the challenges facing the agriculture sector and, in 2017, partnered with BMGF to transform the country’s livestock data ecosystem. This was the first phase of the aLIVE program. During this phase, the MoA worked closely with the Livestock Investment Corporation (LIC) and International Center for Tropical Agriculture (CIAT) to conduct a landscape analysis of the livestock data ecosystem which outlined stakeholder needs and the state of the livestock data ecosystem.
From this landscape analysis, the partners developed the Livestock Information System Roadmap, which provides an overarching vision for the development of a comprehensive LIS and includes discrete steps on how to achieve this vision. For the second phase of the aLIVE program, DG will take the lead on the technology implementation stage.
aLIVE Tomorrow: Next Steps in Advancing Ethiopia’s Agriculture
In this next stage of the aLIVE program, the overall goal is to increase the MoA’s ability to analyze and use livestock data in its planning, policy making, programming, and resource allocation by creating an improved LIS, strengthening data governance, and conducting related capacity building activities.
DG will know that this goal has been met when:
- MoA has access to timely, relevant, and interoperable data on livestock through the LIS;
- MoA has improved skills, processes, data governance systems, and incentives to use data to inform policy making and resource allocation decisions; and,
- MoA has the resources, skills, and infrastructure necessary to sustain and grow the use of the LIS over time.
Throughout the first year of the aLIVE program, DG and MoA will lay the foundation for the program’s success by:
- Determining the LIS data standard to support interoperability across databases;
- Finalizing the system architecture defined in the Roadmap for the LIS;
- Strengthening the existing livestock MoA databases; and
- Updating the data management process (i.e., the way data is collected, shared, and uploaded) in order to support future data use and long-term sustainability of the strengthened data ecosystem.
Stay tuned for more!
- “Agriculture and Food Security.” USAID. Last modified January 8, 2021. https://www.usaid.gov/ethiopia/agriculture-and-food-security.
- Central Statistical Agency of Ethiopia. May 7, 2021. Original data from https://www.statsethiopia.gov.et/our-survey-reports/. Accessed via https://public.knoema.com/pbwfnlf/livestock-statistics-of-ethiopia.
Share
Recent Posts
Building Lasting DPI Through Local Ownership: Lessons from Ethiopia’s Livestock Information System
Sustainable DPI depends on more than technology – it requires local capacity and government ownership. Drawing on lessons from Ethiopia’s aLIVE program, this blog explores how investing in both can build more resilient and lasting DPI.
Three Fundamentals for Climate and the Future of Health
Climate change is no longer a distant environmental concern; it is a growing public health challenge. Reflecting on discussions during London Climate Action Week, this blog explores why stronger investment, cross-sector collaboration, and better data are essential to building climate-resilient health systems.
(inter)National Models for Women’s Safety Online
Development Gateway and IREX spent the last year analyzing how different nations approach the "how-to" of online safety regulations. This blog discusses our research, which suggests that the most effective models go beyond reactionary and punitive measures to facilitate a functional ecosystem of trust and accountability.
Advancing Food Security in 18 African Countries: Launching the New AfricaFertilizer.org Website
Tuesday, November 29, Nairobi, Kenya — The new AfricaFertilizer.org website is launching today. The website advances food security throughout Africa by providing in-depth data on fertilizer supply chains and availability in 18 sub-Saharan African (SSA) countries. The AfricaFertilizer.org website was developed by AfricaFertilizer.org (AFO) in partnership with Development Gateway: an IREX Venture (DG) and Wallace & Associates. The launch event will bring together the private sector, national governments, the African Union (AU), the United Nations Food and Agriculture Organization, and development partners to promote the collaborative use of AFO’s data in order to make informed decisions that address and respond to key issues of availability, policy, price, and use in the fertilizer sector in SSA.
Why Fertilizer and Food Security?
Sub-Saharan Africa (SSA) has the lowest fertilizer usage in the world – insufficient to replace soil nutrients lost every year to crop production. Simultaneously, SSA’s population is growing steadily with a population size of over 2 billion people by 2050. This demographic shift has resulted in an increased need for policy-makers to make decisions that lead to strong agricultural supply chains, including the tools and data needed to ensure sufficient quantities and appropriate fertilizers reach farmers on time for planting.
To help meet this need, AFO, DG, and Wallace & Associates, working with industry sector players at national levels, have co-created and launched three country-specific dashboards in Kenya, Nigeria, and Ghana, which aggregate country-specific fertilizer data and act as trustworthy sources.
The New Africa Fertilizer Website
The new AfricaFertilizer.org website builds upon previous work by displaying fertilizer data on trade, production, consumption, and retail prices for 18 SSA countries in addition to integrating the current data dashboards for Nigeria, Ghana, Kenya, and Senegal.
Users of the new AfricaFertilizer.org website will have the ability to customize data visualizations for cross-country comparison and access timely information on fertilizer markets. One primary goal behind the website is to allow stakeholders to track progress in meeting the targets identified in the 2006 Abuja Declaration, using the data provided on the website.
The revamped AFO website, which will position AFO as the primary data source for fertilizer data on the African continent, will also serve as a trustworthy source to inform analysis and planning in advance of the 2023 African Union Fertilizer and Soil Health Summit and the design and monitoring of the 10-year action plan on fertilizer in Africa. The partnership will prioritize engagement with the African Union Commission to build a bridge to AU member countries, with the aim of having AFO recognized as an official data partner.
Finally, the new AfricaFertilizer.org website will also display the recently launched Africa Fertilizer Watch, a monitoring and early warning systems tool on the impact the Russian invasion of Ukraine has had on the fertilizer markets of 10 countries in Eastern and Southern Africa as well as other indicators tracking overall market risk, affordability, availability, and distribution of fertilizer.
As a result of the new website, policymakers and investors in SSA countries will have the data they need and the in-country networks and processes to jointly analyze and use that data to drive decision-making and inform the design of the Summit’s 10-year Fertilizer and Soil Health Action Plan.
The Development of the Website
Development of the website began with a scoping mission to identify needs and gaps in data in the fertilizer sector. This was followed by a co-design workshop to validate findings. Throughout the design of the website, DG utilized the Agile software development methodology, specifically iterating based on feedback. The backend of the AfricaFertilizer.Org website is built using Java, PostgresSql, Hibernate, and the DGToolkit; while the frontend uses React.js, WordPress, Leaflet, and Nivo.
AfricaFertilizer.org (AFO) – the premier source for fertilizer statistics and information in Africa. It is hosted by IFDC and supported by several partners, key among them being the International Fertilizer Association (IFA), Argus Media, USAID BFS and the Bill & Melinda Gates foundation through Development Gateway under the Visualizing Insights on Fertilizer for African Agriculture, VIFAA program. Since 2009, AFO has been collecting, processing, and publishing fertilizer production, trade, and consumption statistics for the main fertilizer markets in sub-Saharan Africa. AFO has an extensive network of fertilizer industry players in the main fertilizer trade corridors and maintains key information on the major producers, their production facilities and capacities, importers/suppliers, and various distribution channels. More at https://africafertilizer.org
Development Gateway: an IREX Venture (DG) – Development Gateway provides data and digital solutions for international development. DG creates tools that help institutions collect and analyze information; strengthen the institutional capacity to use data; and explore what processes are needed to enable evidence-based decisions. A mission-driven nonprofit since 2000 with staff based in five global hubs and around the world, DG supports the use of data, technology, and evidence to create more effective, open, and engaging institutions. More at www.developmentgateway.org
International Fertilizer Development Center (IFDC) – As an independent non-profit organization, IFDC works throughout Africa and Asia to increase soil fertility and develop inclusive market systems. Combining science-backed innovations, an enabling policy environment, holistic market systems development, and strategic partnerships, the organization bridges the gap between identifying and scaling sustainable agricultural solutions, resulting in improved household food security and enriched family livelihoods around the world. Using an inclusive approach, IFDC employs locally driven solutions that are environmentally sound and impact oriented that bring change at local, regional, and national levels. More at https://ifdc.org
Wallace & Associates (W&A) – Since 2014, W&A has been involved in the strategic design of agriculture development projects with a strong focus on sub-Saharan Africa. W&A works closely with donor institutions, government officials, and the private-sector to identify investments that unlock market constraints. Together, we identify opportunities that lead to transformative investments and/or development initiatives.
Share
Recent Posts
Building Lasting DPI Through Local Ownership: Lessons from Ethiopia’s Livestock Information System
Sustainable DPI depends on more than technology – it requires local capacity and government ownership. Drawing on lessons from Ethiopia’s aLIVE program, this blog explores how investing in both can build more resilient and lasting DPI.
Three Fundamentals for Climate and the Future of Health
Climate change is no longer a distant environmental concern; it is a growing public health challenge. Reflecting on discussions during London Climate Action Week, this blog explores why stronger investment, cross-sector collaboration, and better data are essential to building climate-resilient health systems.
(inter)National Models for Women’s Safety Online
Development Gateway and IREX spent the last year analyzing how different nations approach the "how-to" of online safety regulations. This blog discusses our research, which suggests that the most effective models go beyond reactionary and punitive measures to facilitate a functional ecosystem of trust and accountability.
Launching: Digital Advisory Support Services for Accelerated Rural Transformation (DAS)
The Digital Advisory Support Services for Accelerated Rural Transformation (DAS) Program launched in March 2022 and will go through March 2025. Development Gateway: an IREX Venture (DG) will implement the grant in partnership with Jengalab and TechChange to advance Information and Communication Technology for Development (ICT4D) in the agricultural sector across Africa, the Middle East, and Central Asia.
Enhancing food security and increasing crop production is a daunting challenge. Change requires all elements of the food system – production, monitoring, distribution, and quality assurance – to work together synergistically, supporting and underpinning each other. It also requires a direct focus on the needs of farmers.
Small farms account for 84 percent of farms worldwide and produce 35 percent of the world’s food supply.1 Despite the huge role of smallholder farmers, they face significant challenges to scaling their production (i.e., producing a higher crop yield and/or increasing quality products ready for market). From weak institutional support, poor infrastructure, lack of access to capital, and beyond – these challenges can affect agricultural productivity.
Meeting the Digital Needs of Farmers
Digital and Information and Communication Technology (ICT) tools are one path forward. For example, a smallholder farmer in Malawi, who can access a line of credit through a mobile application, could use this funding to purchase seeds and fertilizer before the growing season begins. The same farmer can also use a mobile device to access information on weather forecasts, market research, planting techniques, financial tools, and other agricultural information. This type of information is crucial for a farmer making decisions in order to improve productivity and provide a buffer from unforeseen challenges during the growing cycle.
Increasing smallholder farmers’ access to digital tools is an opportunity to support smallholder farmers while creating more resilient food systems. In the process, partner organizations, government agencies, and civil society organizations (CSOs) can identify successes and good practices for connecting farmers to critical information. Doing so, can help build better targeted programs that improve the ability of program implementers to target, monitor, and measure the impact of digital solutions that support farmers – and create useful feedback loops for continual learning and growth.
Program Background and Goals
In March 2022, DG launched the Digital Advisory Support Services for Accelerated Rural Transformation (DAS) Program, through funding from the International Fund for Agricultural Development (IFAD),to address the gap in digital tools and information access for smallholder farmers. Through rapid advisory deployments, the DAS Program will focus on two main objectives:
- Increase access to information and inclusive financial services for smallholder farmers and partners they work with, including extension workers, and
- Increase the use of ICT4D solutions to achieve better targeting, monitoring, and impact measurement for agricultural development.
DG is partnering with digital development experts, Jengalab, and digital training creator, TechChange, to provide a holistic approach to advisory support. Jengalab will lead and contribute to ecosystem and M&E assessments, while TechChange will create customized training for implementing partners. DG will also work closely with the two program partners to develop and disseminate good practices that can support capacity building around the use of ICT in agriculture programs for IFAD-financed implementers across the geographic regions.
Advisory Support: Our Approach
The DAS Program is a demand-driven facility, meaning IFAD-financed implementing partners can approach the program for tailored support on integrating digital technology solutions into existing programs, new program designs, and institutions.
The program offers a menu of options for requesters to choose from including, but not limited to:
- Ecosystem assessment and mapping for country strategies, development plans, supply chains, or specific sectors;
- Digital tool appraisal to map user journeys, user experience, scalability, and sustainability;
- Establishment and documentation of data governance procedures to support digital tool management;
- Integration of ICT technology indicators into the project, program, or strategy M&E results frameworks;
- Capacity and awareness building of target institutions, government, and implementing partners via customized training;
- Support in the development of a Request for Proposal/Terms of Reference/Scope of Work to engage an ICT service provider; and
- Research brief on specific ICT topics (e.g., the use of algorithms, machine learning, data protection factors, etc.).
Recognizing the need for a customizable, flexible approach to providing support, DG, Jengalab, and TechChange developed the menu of options to address the variety of challenges, as well as opportunities, that programs face in embedding digital tools within existing agricultural ecosystems. The goal overall is to tailor the options to each team’s particular needs, integrating the expertise of the partners into a package of advisory support that both builds team capacity and creates opportunities to document learnings that other teams can benefit from in the future.
Building digital tools is not just an opportunity to improve agricultural processes, it’s also a chance to share lessons learned with the wider ICT4D community. The DAS Program aims to inform future ICT4D best practices and implementation strategies by creating toolkits, guides, case studies, and cross-learning events to share what works and what does not for ICT4D innovations. DG will develop a digital knowledge hub to allow the public to access the collection of resources and guidance developed under the program.
Next Steps
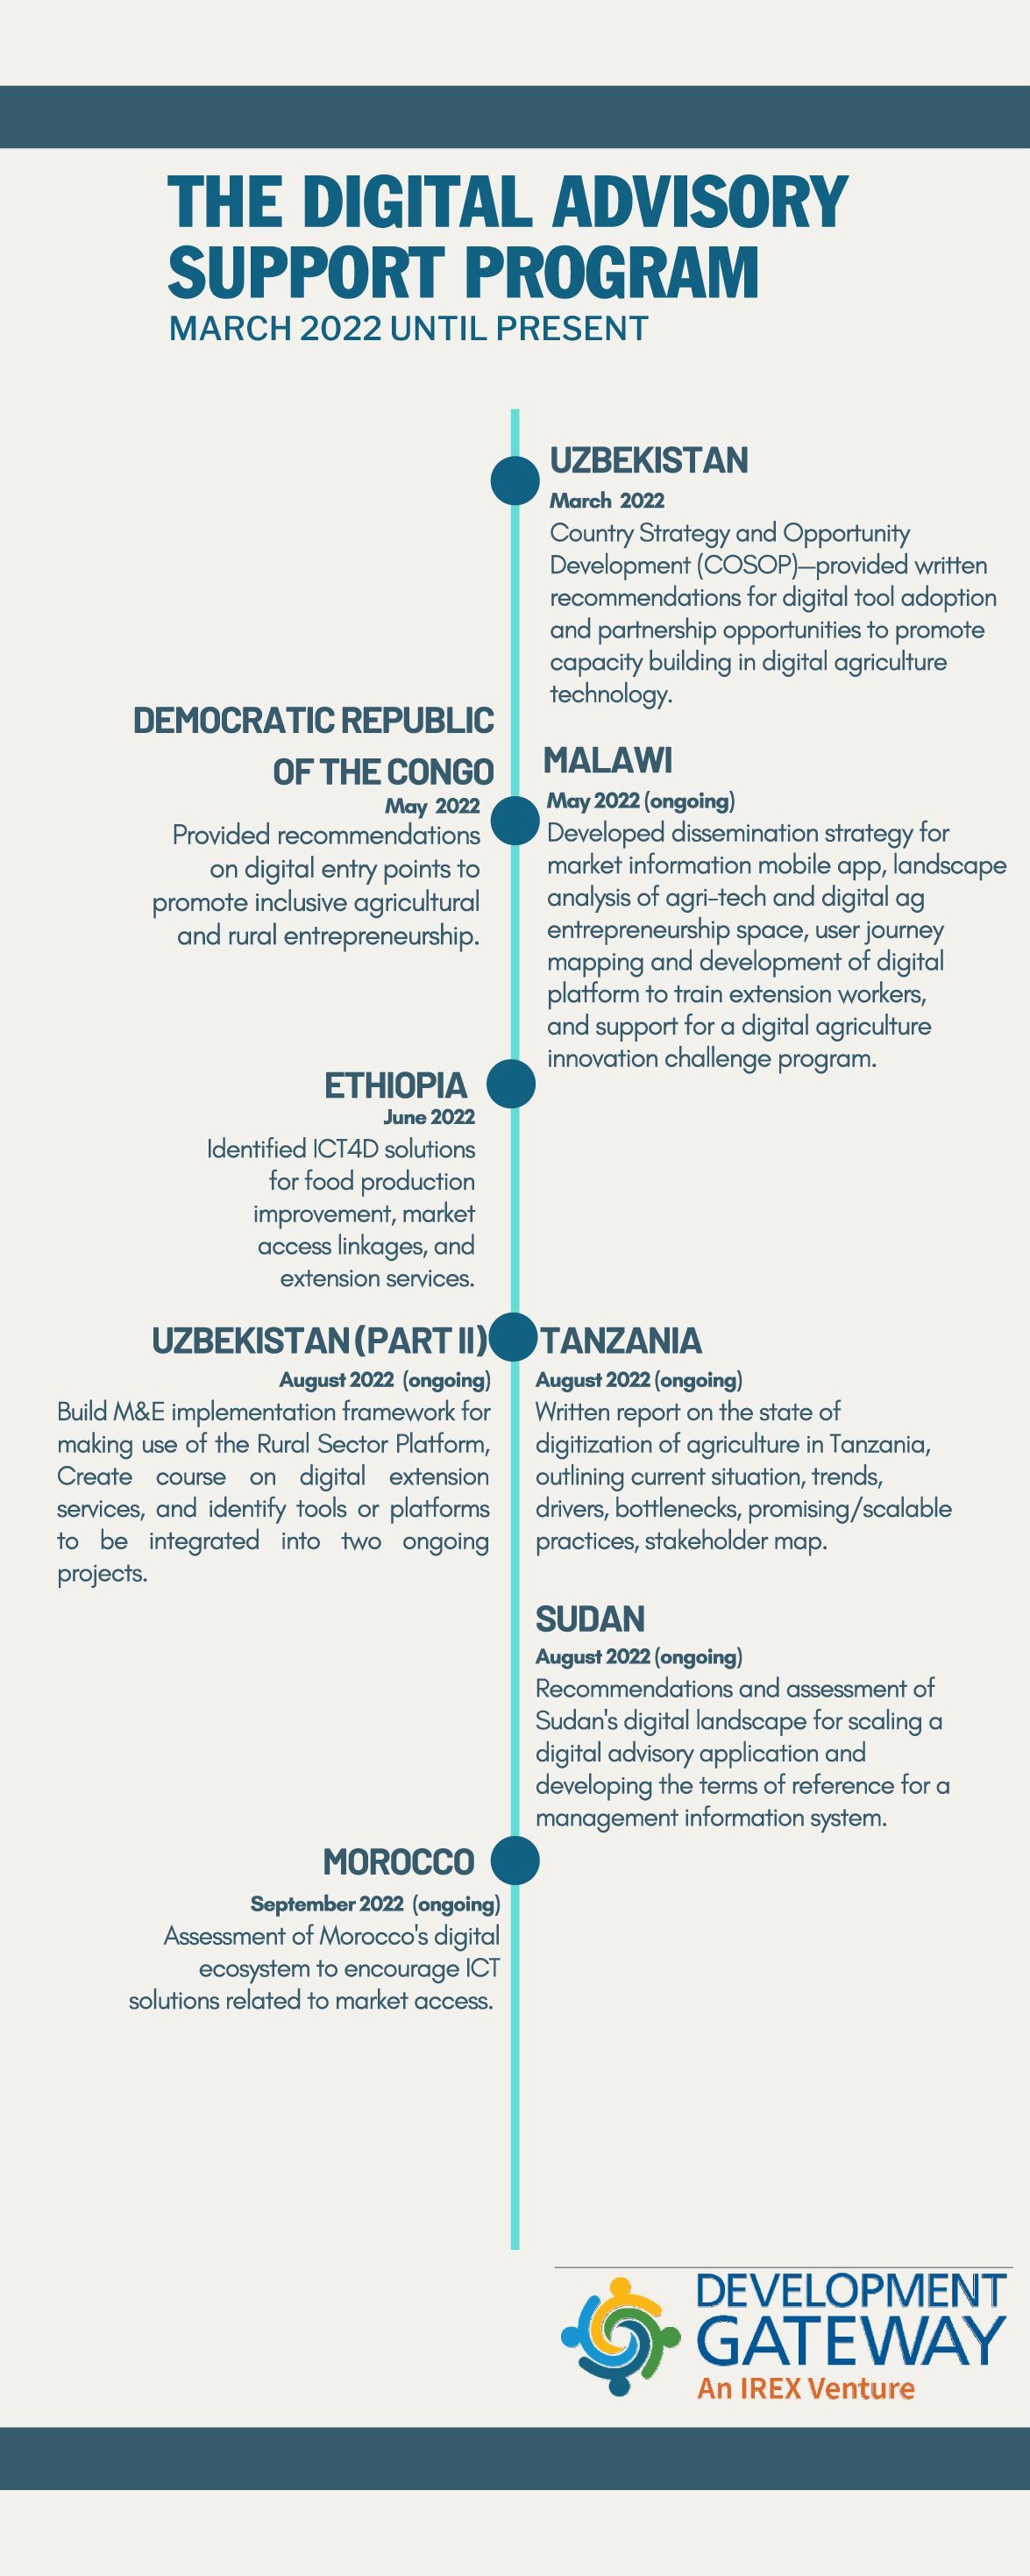
The DAS Program has engaged with partners in Uzbekistan, Ethiopia, Democratic Republic of the Congo, and Malawi since its inception in March 2022. In the upcoming months, the Program will provide advisory support in Sudan, Uzbekistan (as a follow-on request), Morocco, Nigeria, and Burundi, with additional countries to be determined.
We look forward to sharing what we learn in the process as the DAS Program gains speed. Stay tuned!
1. Lowder SK, Sanchez, MV & Bertini, R. Which farms feed the world and has farmland become more concentrated? World Dev 2021; 142. https://doi.org/10.1016/j.worlddev.2021.105455.
Share
Recent Posts
Building Lasting DPI Through Local Ownership: Lessons from Ethiopia’s Livestock Information System
Sustainable DPI depends on more than technology – it requires local capacity and government ownership. Drawing on lessons from Ethiopia’s aLIVE program, this blog explores how investing in both can build more resilient and lasting DPI.
Three Fundamentals for Climate and the Future of Health
Climate change is no longer a distant environmental concern; it is a growing public health challenge. Reflecting on discussions during London Climate Action Week, this blog explores why stronger investment, cross-sector collaboration, and better data are essential to building climate-resilient health systems.
(inter)National Models for Women’s Safety Online
Development Gateway and IREX spent the last year analyzing how different nations approach the "how-to" of online safety regulations. This blog discusses our research, which suggests that the most effective models go beyond reactionary and punitive measures to facilitate a functional ecosystem of trust and accountability.
Nigeria’s Changing NPK Market (Part 2)
As highlighted in Part 1, the nitrogen story in Nigeria is quite impressive. However, crops cannot grow on nitrogen alone. Seventeen nutrients are required for plant growth, with nitrogen (N), phosphorus (P), and potassium (K) serving as the essential trio (NPK). Private sector urea investments have encouraged entrepreneurs to invest in domestic NPK blending plants. Typically, companies that operate fertilizer blending plants produce specific blends made from all three of these essential nutrients, and often blends are created with other micronutrients that address specific needs for a plant’s nutrient uptake.
Moving Away from the “One Size Fits All” Model
Prior to this recent upsurge in investments in the fertilizer sector, Nigeria imported NPK products, and these imports would compete with domestic blending plant operators. The majority of these domestic plants were either owned by state governments or relied on government contracts to operate. Product quality was a concern by the farming community because many of these operators considered the government as their customer rather than the farmer. This remains an area of concern during this transition from imported to domestic NPK production, as local blending plants do not clear their final product through customs or the port before selling it to the farmer.
For more than 20 years, Nigeria’s primary NPK products consisted of common N, P, and K blends – usually 15 15 15 (equal parts N, P, and K) or 20 10 10 (double the amount of N to the amount P and K). These fertilizer types were generic enough to be applied to all crops but most closely aligned with nutrient requirements for maize. This “one size fits all” approach was primarily due to economies of scale, as importers and government tenders supported a “one-size-fits-all” approach.
Changes in the nitrogen production have increased the use of nitrogen-based fertilizers. And the use of fertilizer has nearly doubled since 2015 (most of it led by the increased use of nitrogen-based fertilizers, such as urea).
Becoming a Nitrogen-Fertilizer Market Leader
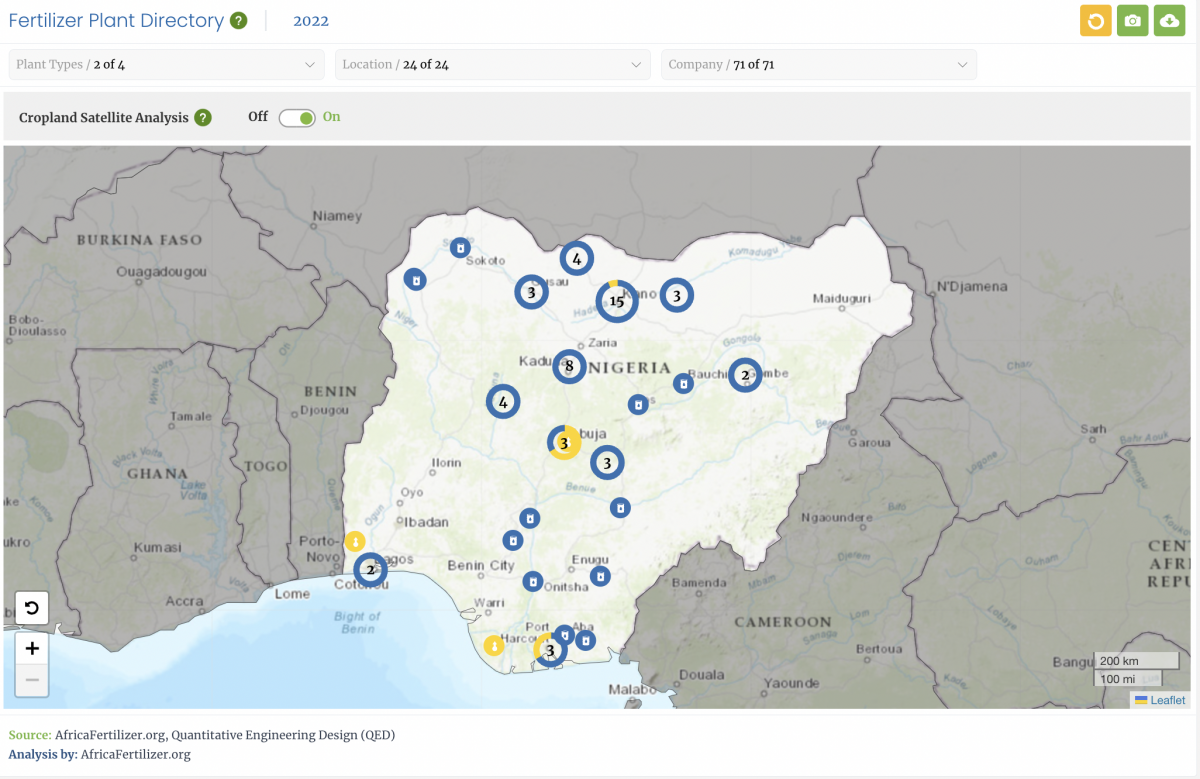
However, the change in the nitrogen market has given rise to a new market for private sector actors. Once Nigeria became a global supplier of nitrogen-based fertilizer, it no longer made economic sense for NPK products to be imported when domestic nitrogen could be used in-country. Currently, more than 75 blending plants exist in Nigeria, 18 of which have come online since 2015.
In 2016, the Presidential Fertilizer Initiative (PFI) was created between President Muhammadu Buhari and the King of Morocco to supply discounted phosphate for NPK blends within Nigeria which further encouraged the growth of blending plants. In November 2018, the Central Bank of Nigeria banned the use of foreign exchange for imports of NPK fertilizers in an effort to bolster domestic production.1 2 This explains the explosive growth of blending plants within Nigeria over the past few years.

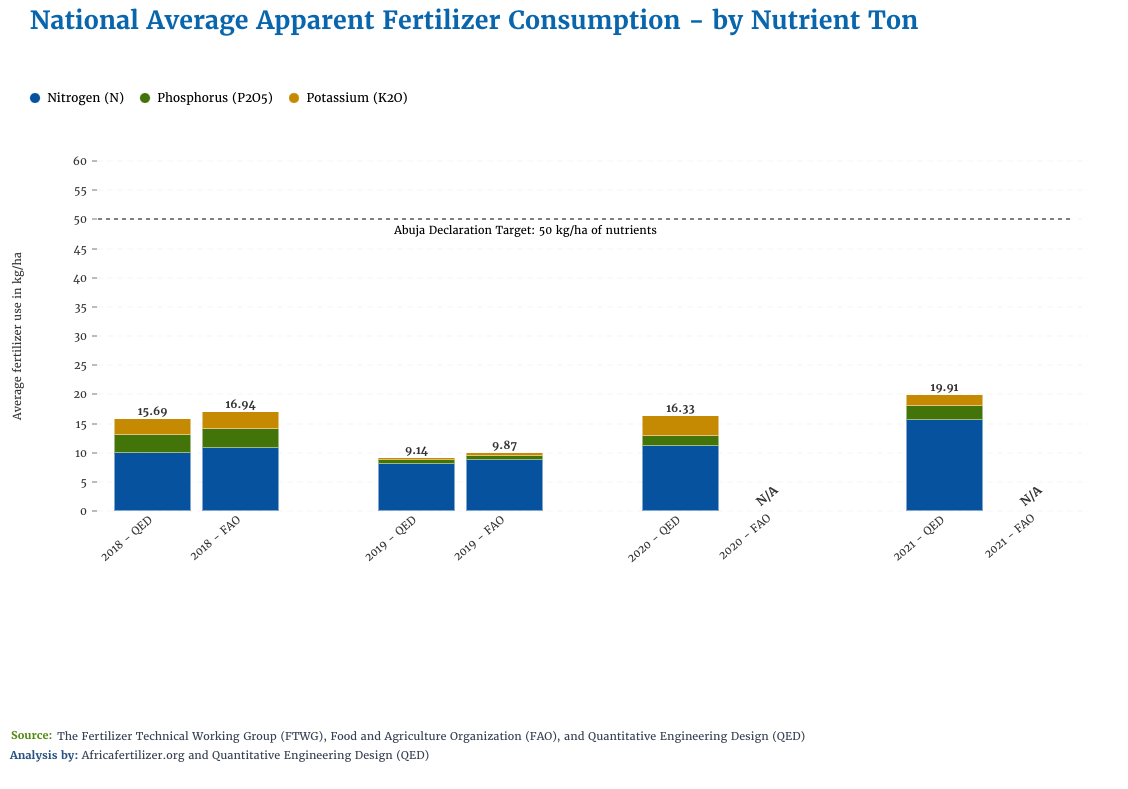
As phosphorus and potassium are not domestically available, these blending plants use domestic urea (46% nitrogen) combined with other imported raw materials such as diammonium phosphate or DAP (18% nitrogen and 46% phosphorous) alongside muriate of potassium or MOP (60% potassium) to create NPK blends.
As evidenced by the apparent consumption chart below, P and K consumption has not kept pace with the domestically produced nitrogen (urea) consumption.
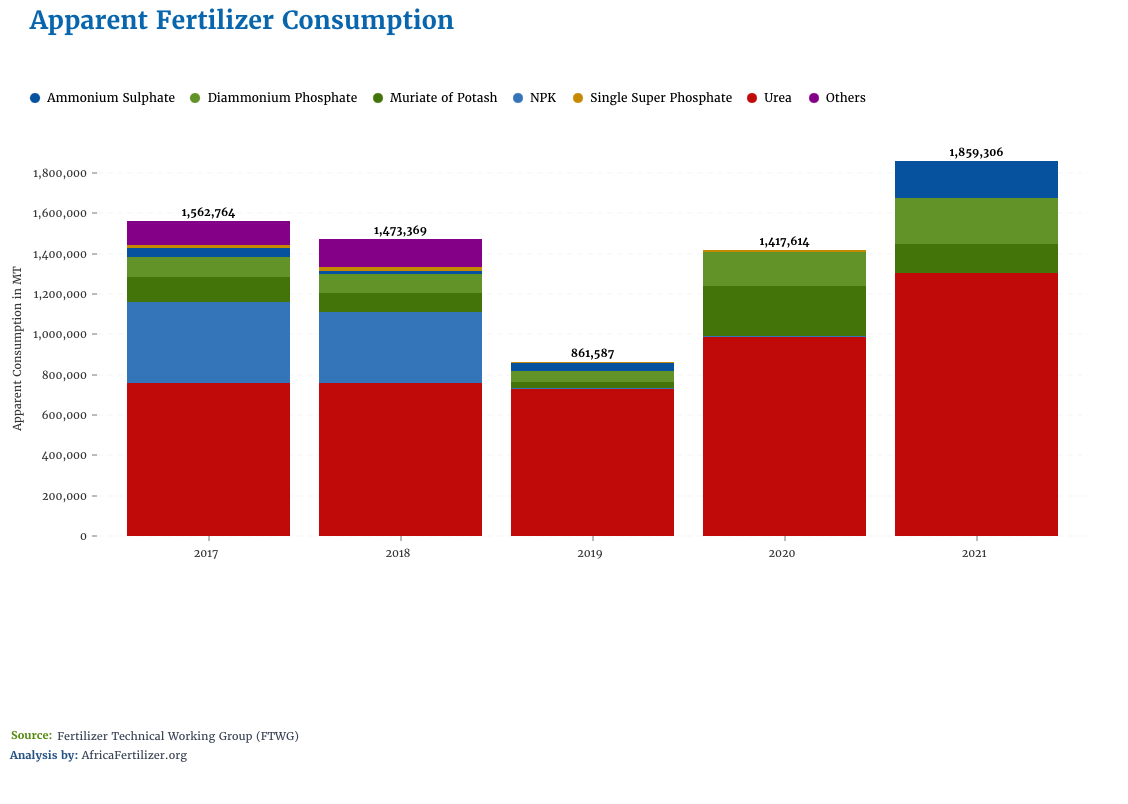
The rapid growth of blending plants now creates an opportunity that can have a transformative impact on the country’s agriculture sector. A key benefit of domestic blending plants is the flexibility to supply the specific nutrient needs for the crops grown in the locality. For example, a tomato fertilizer blend in Plateau State could equate to 8-32-16 whereas a cassava blend in Nasarawa State could be 6-14-32 and a 20-5-5 blend for rice farmers in Sokoto. Even though the NPK formulas presented above are meant for illustrative purposes, one can distinguish the variation in nutrient needs by crop. Historically, this attention to crop and soil nutrient needs was not possible when NPK was imported in 10 to 15,000 MT increments.
Why Use a Dashboard to Improve Crop Yields?
The nutrients available within the soil can vary between geographic areas. Every time a farmer harvests a crop and takes the product out of the field, they are taking nutrients from the soil. Crop yields improve when farmers can access and use fertilizers with specific ratios of N, P, and K to supplement the soil’s existing nutritional profile. The Visualizing Insights on Fertilizer for African Agriculture (VIFAA) program provides an opportunity for blending plants to access critical data needed to make crop-specific or site-specific NPK blends a reality.
The government’s role is also starting to change, going from ensuring fertilizer products are available to ensuring product quality and supporting new blends. The government can enable products that maximize farmer yield by providing education on blends, supporting programs to encourage new NPK products from the private sector, and supporting soil mapping technology. As blending plant growth has exploded in Nigeria, the government needs to monitor this growth to ensure that soil health is protected and crop yield is sustained. Policy changes to support the market are vital to ensuring its sustainability.
The VIFAA Dashboards are an important part of ensuring all stakeholders in the supply chain have access to the information they need, which ultimately ensures that farmers have the best fertilizer available in time for planting.
VIFAA Going Forward
In November 2022, AfricaFertilizer (AFO), our partner on the Visualizing Insights on Fertilizer for African Agriculture (VIFAA) program, rebranded and launched a new website. This website includes the integration of country-specific VIFAA dashboards, which were previously housed in separate websites. By integrating the country-specific dashboards as well as fertilizer data on trade, production, consumption, and retail prices for 18 countries in sub-Saharan Africa, the new AFO data allows easier comparative analysis across countries and contributes its quota to the advancement of food security throughout Africa.
We have updated the previous country-specific dashboards links to now redirect you to AFO’s new website in order to ensure you are accessing the most up-to-date resources.
Share
Recent Posts
Building Lasting DPI Through Local Ownership: Lessons from Ethiopia’s Livestock Information System
Sustainable DPI depends on more than technology – it requires local capacity and government ownership. Drawing on lessons from Ethiopia’s aLIVE program, this blog explores how investing in both can build more resilient and lasting DPI.
Three Fundamentals for Climate and the Future of Health
Climate change is no longer a distant environmental concern; it is a growing public health challenge. Reflecting on discussions during London Climate Action Week, this blog explores why stronger investment, cross-sector collaboration, and better data are essential to building climate-resilient health systems.
(inter)National Models for Women’s Safety Online
Development Gateway and IREX spent the last year analyzing how different nations approach the "how-to" of online safety regulations. This blog discusses our research, which suggests that the most effective models go beyond reactionary and punitive measures to facilitate a functional ecosystem of trust and accountability.
Thinking of Investing in a Data Ecosystem for Sustainable Development?
Here are a Few Questions, Ideas, and Tools to Get You Started
Just like a natural ecosystem is the result of the interaction between certain organisms and the physical environment in which they live, data ecosystems are also the result of all the people (individuals), communities, and institutions interacting with each other in the way data is being produced, used, re-used, and/or shared. For international development stakeholders (everyone from national governments to international organizations, private sector, civil society as well as individuals and communities), harnessing the power of data for good has been a priority ever since the launch of the Sustainable Development Goals in 2015. From the onset of the Sustainable Development Goals agenda implementation, quality access and use of data was considered essential for decision-making, accountability, and for seeking solutions to complex and multifaceted development challenges. It was the start of the so-called “data revolution” for sustainable development.
For initiatives aiming to harness the power of data for good, it is critical to start with a well defined problem and a thorough understanding of the data ecosystem around it. It is, therefore, very important for stakeholders driving such initiatives to have the tools and resources that will help them assess data ecosystems specific to a sector where the development challenge takes place or even specific to a nation for more effective and impactful policy making or strategic planning. Investing time to assess a data ecosystem will ensure the relevance, sustainability, and potential for scale of a solution to a development challenge. At the same time, data ecosystem assessments will help to close any significant data gaps and strengthen the ecosystem, enabling quality and timely data production, facilitating collaboration between stakeholders, increasing the use of data for decision-making, improving service delivery, building responsible and ethical data practices, and/or increasing government data transparency.
For organizations thinking about conducting a data ecosystem assessment, there is an array of initiatives, tools, and approaches from which to choose. Based on our experiences deploying our own tools and supporting a variety of stakeholders, IREX and Development Gateway: An IREX Venture (DG) would like to share a few insights and questions to help you get started.
Three Questions to Get You Started
The number of tools, frameworks, and initiatives to help you understand, analyze, map, and integrate data ecosystems at various levels can seem daunting. Below, we have included a select list of tools you can use for your assessment. Each methodology has a unique set of outputs, focuses on different parts of a data ecosystem, and analyzes different types of ecosystems. Before selecting a tool, ask yourself the following questions:
Q1: What is the objective?
This is the most important question to ask at the beginning of the process. The success of an ecosystem assessment depends on having a clear understanding of the reason for conducting it. This is important for assessments led both internally and externally. We see two major motivations for leading these assessments:
- To find possible solutions to a known problem, need, or interest – In this case, the assessment should be problem-driven and will help identify specific recommendations and investments that help find a solution to the known problem. Some notable examples are assessments to help identify possible data and digital investments, operationalizing strategic plans, or designing Monitoring and Evaluation (M&E) systems. A specific example illustrating this would be IREX and local actor D-Lab’s use of the Data Compass tool (as part of Data Zetu program) to help the Ministry of Health in Tanzania evaluate and sustain investments in public health care that included building capacities of rural health care facilities for more effective and systematic use of health data.
- To evaluate where an ecosystem stands in relation to other ecosystems – Some data ecosystem assessment tools have been designed around evaluative frameworks used to conduct multi-dimensional research on the state of a data ecosystem — typically — across several countries. A reason for using these tools would be to determine where an ecosystem fits relative to other ecosystems or an ideal state. Examples of tools that help this type of assessment are scorecards, benchmarks, or indexes, like the recently released Global Data Barometer.
Q2: At what level do you want to focus?
Data ecosystems are multilayered, and there are multiple levels at which an assessment can be led:
- Country Level – These data ecosystem assessments are tools that provide a general landscape of a country. A country-level tool could be useful during investment or development planning. For example, a donor could use a tool that assesses the statistical capacities of a country to inform the design of a program or project that is data heavy.
- Sector Level – These data ecosystem tools help actors to better understand opportunities to harness data within a sector. It considers all actors involved in a sector, including the private sector, government, civil society organizations, nongovernmental organizations, and donors. For example, DG led a data and digital assessment in Guadalajara, Mexico in the open procurement sector. The objective of this sectoral assessment was to identify key areas of investments in open procurement from the perspective of multiple actors, including government contractors, civil society organizations working in the corruption sector, and government employees making purchases.
- Organizations or Institutions Level – These data ecosystem assessments allow actors to understand the data ecosystem of a single organization or institution. For example, a social impact organization may want to understand the extent to which they are utilizing their data (i.e., data maturity level) in order to identify areas for improvement to become a data-driven and data-informed organization.
- A Combination of Assessments at Multiple Levels – Sometimes multiple data ecosystem assessments are needed. For example, a country-level assessment can help a donor identify areas of investment, and a second assessment can allow us to drill down on a possible solution. This was the case of the Results Data Initiative Program led by DG in Malawi. First, an assessment was led to understand the data ecosystem of the agriculture sector in the country. During this assessment, we identified the need for a National Agriculture Data System as a key priority across all actors involved. During a second separate assessment, however, DG focused on the Ministry of Agriculture to design the National Agriculture Management Information System (NAMIS).
Q3: Which aspects of the ecosystem do you want to understand?
A data ecosystem consists of many different elements. Having clarity on which aspects of the ecosystem you want to assess will ensure that the final product responds to your needs. Below are some examples of aspects you could focus on during the assessment. This is an indicative list that can be used as a starting point, but you can add more or select multiple foci.
- Available data – A key part of a data ecosystem is understanding what data exists. Additional information can be associated with available data, including data gaps; who produced the data; how it is collected; its infrastructure; how it is shared; the format in which it is collected; frequency of collection; interoperability(i.e., the ability of data systems to exchange and make use of information); data quality analysis; or the legal framework.
- Data openness – Knowing the level of open data of a government can help governments and international organizations recognize areas for investment. The level of data openness can refer to multiple variables, including the format in which data is published; the quality and frequency of data published; and coverage or legal framework.
- Data capacities and skills – Governments, donors, and civil society organizations need to have the capacity to produce and use available data. Depending on the assessment tool you select, you can assess statistical capacities, skills, access to training, or digital and data literacy.
- Use and reuse of data – Leveraging data to make decisions to advance the implementation of the Sustainable Development Goals is one of the key premises of the data revolution. Each assessment tool will evaluate the use of data differently. Some examples include having a positive impact, using data for decision-making, or incentives or disincentives for data use. IREX recently helped the Millennium Challenge Corporation (MCC) to better understand data ecosystems within Lesotho’s healthcare sector with a focus on the use of data to understand key processes ranging from budgeting to maternal mortality rates; recommendations also helped inform investments in data ecosystems driven by MCC’s new compact plan for Lesotho.
Select List of Tools You Can Use for Your Assessment
IREX and DG has created a curated list of tools to be used for data ecosystem assessments.
Share
Recent Posts
Building Lasting DPI Through Local Ownership: Lessons from Ethiopia’s Livestock Information System
Sustainable DPI depends on more than technology – it requires local capacity and government ownership. Drawing on lessons from Ethiopia’s aLIVE program, this blog explores how investing in both can build more resilient and lasting DPI.
Three Fundamentals for Climate and the Future of Health
Climate change is no longer a distant environmental concern; it is a growing public health challenge. Reflecting on discussions during London Climate Action Week, this blog explores why stronger investment, cross-sector collaboration, and better data are essential to building climate-resilient health systems.
(inter)National Models for Women’s Safety Online
Development Gateway and IREX spent the last year analyzing how different nations approach the "how-to" of online safety regulations. This blog discusses our research, which suggests that the most effective models go beyond reactionary and punitive measures to facilitate a functional ecosystem of trust and accountability.
Announcing: Data-Driven Decision-Making Mapping in Education
Development Gateway: an IREX Venture (DG) and IREX, in partnership with the Hewlett Foundation, are pleased to announce a new research program supporting data-driven decision-making in education in East and West Africa. This two-year, $300,000 project to map education data and decision ecosystems in Kenya and Senegal will focus on the variety of administrative, census, and survey data collected to implement and monitor primary and secondary education. The goal is to holistically understand the barriers to more effective data collection, sharing, interoperability, and use. By understanding the barriers, we can better design support for more robust education data ecosystems that drive better learning outcomes.
The Need for Education Data
This past June, The World Bank released its State of Global Learning Poverty Report. The report shows that the COVID-19 Pandemic has significantly worsened learning outcomes and exacerbated an existing learning crisis. The report estimates that 70% of the world’s children are learning impoverished. At the same time, the report relies upon simulated models, which are less reliable than up-to-date official data. For example, the most recent UNESCO data from Kenya and Senegal was published in 2017.1 The Kenyan Ministry of Education, for example, directly cites data challenges in management, sharing, and interoperability.2 Inversely, in Senegal, there is limited research on the utility and availability of data for policy-making in education.3 Both countries exemplify the global challenge of effectively harnessing data for better outcomes in the education sector. Without education data, policymakers, education systems, and other stakeholders lack information to make informed decisions, monitor progress, and allocate resources efficiently or equally.4
Addressing Data Gaps
There is a need for better, more accurate, more timely, and more interoperable data on education to help policymakers combat learning poverty. DG, together with education sector experts from IREX, will map the education data and decision ecosystems in Kenya and Senegal, focusing on primary and secondary education in order to more holistically understand the barriers to data sharing, interoperability, and use. By understanding the barriers to data use, we will allow for more targeted interventions for creating robust education data ecosystems for better learning outcomes. In addition to country-specific assessments, with actionable roadmap and investment recommendations, we will develop a white paper on education country data ecosystems, highlighting lessons from Kenya and Senegal, together with existing literature from around the globe.
The new program is an opportunity to kick-start our joint work in data for education. It builds on DG and IREX’s existing strategic partnership and is bolstered by IREX’s expertise in the education sector and DG’s experience with data and digital for development.
- http://uis.unesco.org/sites/default/files/documents/the-data-revolution-in-education-2017-en.pdf
- Ministry Of Education. (n.d.). National Education Sector Strategic Plan
For The Period 2018 – 2022. Republic Of Kenya. https://assets.globalpartnership.org/s3fs-public/document/file/kenya-nessp-2018-2002.pdf?VersionId=tdCPzVW5gwJ1DODlRJsOWkwpP7BDDrKv. - Ministère de l’Éducation nationale; Ministère de la Formation professionnelle et technique, de l’Apprentissage et de l’Artisanat; Ministère de l’Enseignement supérieur, de la Recherche et de l’Innovation; and Ministre de la Bonne Gouvernance et de la Protection de l’Enfance. (2018, August).
Programme d’Amélioration de la Qualité, de l’Équité et de la Transparence-Education/Formation (PAQUET-EF) 2018-2030. Republique Du Senegal. - http://uis.unesco.org/sites/default/files/documents/the-data-revolution-in-education-2017-en.pdf
- http://uis.unesco.org/sites/default/files/documents/the-data-revolution-in-education-2017-en.pdf
Share
Recent Posts
Building Lasting DPI Through Local Ownership: Lessons from Ethiopia’s Livestock Information System
Sustainable DPI depends on more than technology – it requires local capacity and government ownership. Drawing on lessons from Ethiopia’s aLIVE program, this blog explores how investing in both can build more resilient and lasting DPI.
Three Fundamentals for Climate and the Future of Health
Climate change is no longer a distant environmental concern; it is a growing public health challenge. Reflecting on discussions during London Climate Action Week, this blog explores why stronger investment, cross-sector collaboration, and better data are essential to building climate-resilient health systems.
(inter)National Models for Women’s Safety Online
Development Gateway and IREX spent the last year analyzing how different nations approach the "how-to" of online safety regulations. This blog discusses our research, which suggests that the most effective models go beyond reactionary and punitive measures to facilitate a functional ecosystem of trust and accountability.
Episode 5, Season 1 | Exploring Digital Transformation & Emerging Technology
In our final episode of the current series, I speak with Annie Kilroy, Senior Associate, and Fernando Ferreyra, DG’s Director of Software Development, about digital transformation and emerging technologies. The conversation centered on what has changed in the technology landscape in the past decade, our approach to digital transformation, and how to continue prioritizing users.
You can also listen to Data… for What?! on Spotify, Stitcher, and Apple Podcasts.
Development Gateway: an IREX Venture (DG) has always been at the intersection between software and international development. In our new strategic plan, we highlight our evolving efforts to develop and deploy emerging technologies with an emphasis on sustainability, ethical innovation, and strong digital governance. Our experience co-creating with users, eye on ethical and sustainable technology, and our new drive to scale and innovate makes DG uniquely positioned to lead the digital development sector in the thoughtful implementation of new tools and approaches.
What has Changed?
Since the start of our last strategy cycle, digital technologies have continued to expand exponentially. As smartphones become more accessible, the number of internet users continues to increase globally. With more users accessing the internet, governments are seeking to streamline their work and make more processes digital. In parallel, the COVID-19 Pandemic has accelerated the focus on digital transformation, as the need for e-government services, e-learning, and other modern methods for interacting with stakeholders has become a necessity.
We have also seen over that time that some technologies have reached maturity. Cloud computing has become the industry standard and the price is no longer prohibitive. In the past, deploying technology would require the DG team to arrive at a government ministry with servers, cables, and everything needed to maintain a system to do work that can now be achieved through the Cloud in a matter of hours. The value proposition has been tremendous in terms of efficiency, and also presents opportunities to use tools like machine learning and analytics in a new way.
Our Approach: Centering the Users
One thing that will never change is a focus on the users, and understanding the context in which a tool will be deployed. Through our Custom Assessment Landscape Methodology our first step in any project has always been an assessment of the landscape in an effort to understand who will be using a system and what decisions it will facilitate. Then, co-designing and iterating with the stakeholders throughout the development process.
At the same time, understanding the needs of the users requires a constant focus on responsibility and sustainability. Helping stakeholders select technology is not about the cutting edge, but rather what will work in a given context and be sustainable in the long term. This includes creating open source solutions, using technologies with strong documentation and support, prioritizing data protections and regular security updates, and planning for local ownership.
Where are We Going?
- New and Emerging Technology – The digital development space is constantly changing, and there is a critical need for an experienced organization like DG to help the sector understand which tools are fit for purpose, and which are pure hype.
- Bottom-Up and Top-Down Approaches – We will continue to work with organizations to marry guidance from global organizations like the UN or the WorldBank, with the bottom up approaches for what digital transformation looks like at the local level.
- Advisors and Implementers – In our new strategy, we see a role for ourselves as practitioners/implementers and also as advisors. Often, technology projects fail before they start because the funder does not understand the context, user needs, or, ultimately, the purpose. Playing an advisory role at the beginning of the technology process will allow us to influence digital development work at a greater scale and to have a clear avenue for informing the policy community.
Thank you so much for joining us on this exploration of our Strategic Plan. You can listen to all the episodes here. We will be back soon with a new season of Data… for What?! focused on data governance.
Share
Related Posts
Episode 4, Season 3 | Expanding into Climate Action: How Every Organization has a Role to Play
In episode 4, Season 3 of “Data…for What?!,” host Vanessa Goas and special guest Roshan Paul, Former Director of Leadership Practice & Climate Talent Initiative at IREX, discuss the Climate Talent Initiative, which is IREX’s first in-house climate program.
Episode 3, Season 3 | Context and Climate Action: A Conversation between the Local Development Research Institute and DG
In episode 3, Season 3 of “Data…for What?!,” DGer Charlene Migwe-Kagume and special guest Leonida (Leo) Mutuku discusses LDRI’s early warning system, an AI tool that is being used to enable farmers to plan and manage their harvest more effectively by using local and global data on weather patterns, crop yields, etc.
Episode 2, Season 3 | The Great Green Wall: How Data Can Advance One of Africa’s Most Ambitious Efforts to Combat Climate Change
In episode 2, Season 3 of “Data…for What?!,” host Vanessa Goas and special guests former DGer Joshua Mbai and Gilles Amadou Ouédraogo, Programme Management Officer for the Great Green Wall Accelerator at the United Nations Convention to Combat Desertification, discuss the Great Green Wall Initiative, the Great Green Wall Observatory, and how the the United Nations Convention to Combat Desertification and DG are committed supporting new and ongoing efforts aimed at combating climate change.
Improving Land and Crop Use Data in Nigeria – The VIFAA Innovation Fund
Nigeria has the largest population and economy in sub-Saharan Africa (SSA). However, with more than 90% arable land and the largest agricultural output in SSA, Nigeria still relies on the import of staples such as maize and rice to meet food demand.1
Basic statistics on hectares of cropland and major crops are outdated, if they exist at all. Availability of reliable and up-to-date land and crop usage data will help inform the government and private sector on how to allocate investments to strengthen Nigeria’s agriculture sector and, in particular, will help ensure that the availability and variety of fertilizer products meet market needs.
The VIFAA Innovation Fund
Development Gateway: An IREX Venture’s (DG’s) Visualizing Insights for Fertilizer in African Agriculture (VIFAA) Program2, funded by the Bill & Melinda Gates Foundation, launched an Innovation Fund to address data shortages relating to total crop production. Building on its track record of mapping land cover, Quantitative Engineering Design (QED)3 was selected to tackle the challenge of mapping Nigeria’s croplands. Through the Innovation Fund, DG and partners is using the resulting data and maps to answer two questions:
- What is the total cropland under production in Nigeria?
- What is the cropland under production by crop type?
Background
Historically, there have been attempts to map croplands and crop types across Nigeria; however, the immense size of Nigeria has made traditional mapping efforts cost prohibitive.4 Recent advancements in technology (i.e., satellite imagery) combined with machine learning have provided rapid and scalable access to high-resolution images of the ground that covers the globe. These tools have been used to map large, industrial-scale croplands in developed countries.5 However, mapping initiatives using remote sensing imagery in tropical countries dominated by smallholder agriculture have not been as successful, largely due to dense cloud cover during the growing seasons and the size, complexity, and diversity of smallholder farm plots.
Mapping Methodology
QED’s high-level approach to land cover mapping is four-fold:
- Survey: Generate training data by labeling satellite imagery and looking at the visual patterns in the landscape between different land uses (e.g., agriculture, urban, forests, etc.).
- Model: Build and test multiple artificial intelligence (AI) models using the training data so that the computer learns from the training data to classify unknown areas across the country.
- Validate: Create predictive maps with each model and assess each one’s performance. This is followed by refinement whereby steps 1-3 are repeated in selected areas requiring further improvement.
- Statistics and visualization: Generate summary statistics based on predictive maps.
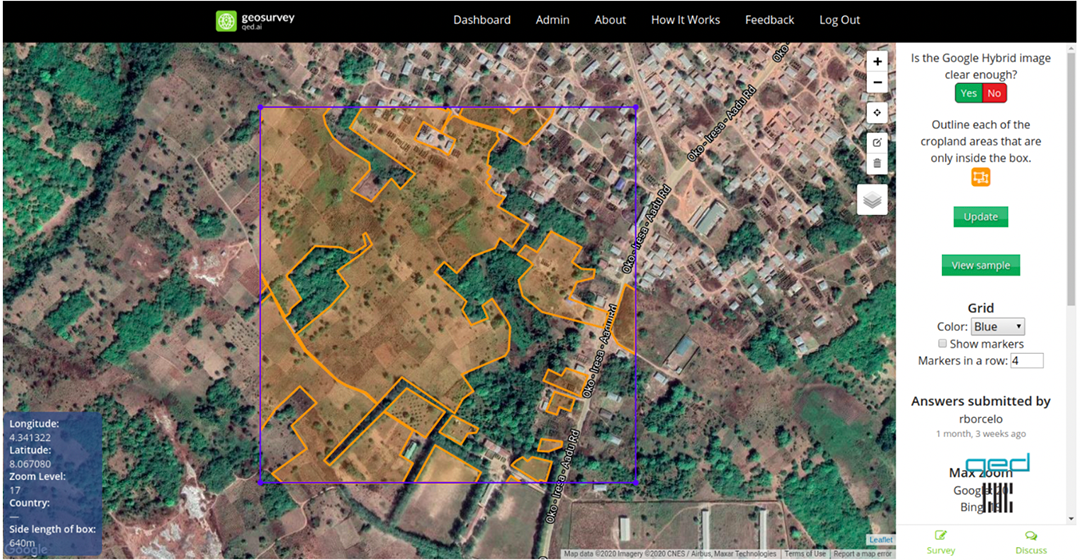
Surveying
QED developed Geosurvey, which is a software tool for efficiently collecting and labeling visual training data. This tool feeds labeled images of agricultural landscapes into a computer program, where trained surveyors assess each image and classify the features within each image (e.g., croplands or not). The process requires a team of skilled surveyors to identify visual indicators of agricultural features and learn patterns which can change depending on the cropping system and geographic region where the specific training data was developed to match the unique locations.
Due to the diversity of agricultural landscapes in Nigeria, conducting a single geosurvey for all of Nigeria would not provide the quality of training datasets required. This necessitated partitioning the country into six smaller, more homogenous, and sometimes overlapping agro-ecological zones to aid familiarity with region-specific fingerprints to the survey team. Using these dimensions, areas of interest (AOI) were identified. However, ecological subdivisions were found within these zones that affected surveyor calibrations such as in the northeast and the delta where croplands and agroforestry systems can subtly blend into the surrounding area, making differentiation difficult.
To overcome these challenges, a series of region-specific training materials were created. They consist of visual guides, videos, and interactive training sessions. To increase the quality and accuracy of the image labeling, QED developed peer review systems whereby each survey submission was reviewed by three different levels of experts. Using this system, the team was able to fully annotate over 10,000 square kilometers of Nigeria within the space of two months.
Modeling
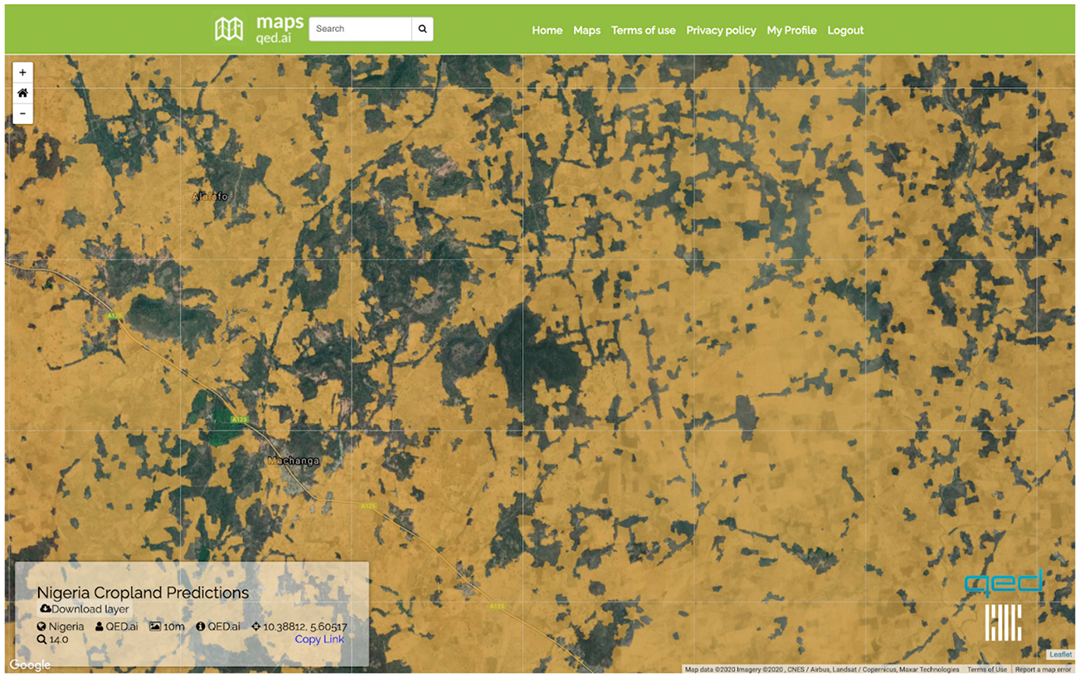
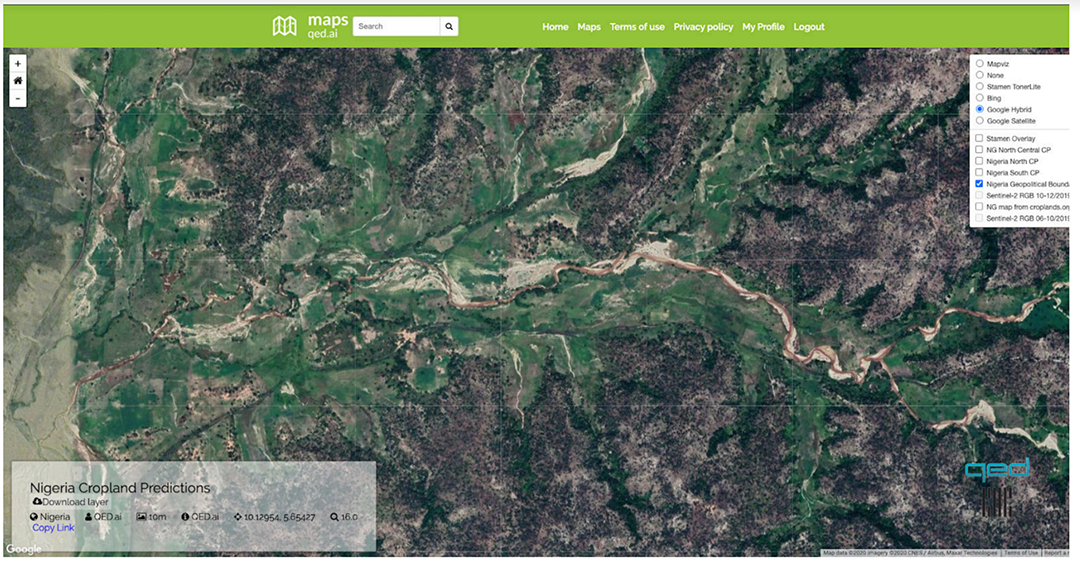
In addition to the training datasets, QED also used a combination of publicly available high-resolution satellite imagery datasets, including Sentinel-2 which is a public satellite run by the European Space Agency. The satellite data is collected every five days (since 2015) to train the models to infer patterns and correlate with crop cycles between satellite imagery and the training datasets. The results are then extrapolated across Nigeria. Using high-performance computing, QED trained and evaluated more than 50,000 different models to produce cropland maps with an accuracy and precision of 85%.
However, even with the level of detail provided by the Sentinel satellite imagery, the main rice and maize growing seasons occur during the rainy season, which is also the period when the availability of cloud-free imagery is scarce. With transfer learning, QED leveraged modeling and data gleaned from the mapping of other countries. Having the basic model built upon previously developed models allowed the team to spend more effort fine-tuning the models to suit local conditions.6
An outstanding question is the ability to differentiate land under fallow from land under active cropping. Attempting to model fallow lands is difficult, as fallow lands may be hard to differentiate from natural lands. Historically, cropland maps have rarely accounted for fallow cropland but, when factored in, the inaccuracies may be substantial. To improve crop yield estimates more broadly, it is vital to estimate the proportion of fallow cropland. QED will continue to review the literature on possible fallow land types and incorporate these types into the field validation surveys used by ground teams in Nigeria.
Validation
In addition to satellite-based verification, QED has been working with Nigerian agricultural experts for further validation of the maps, drawing on the expertise of on-the-ground experts and field staff.
From April 2020, QED began collecting ground data in North Central Nigeria. During the wet season, the region grows mostly maize and rice. QED provided field tools, including mobile phones that were pre-authenticated and pre-loaded with data collection applications; navigation software; mobile data; and communication tools. In the field, surveyors followed predefined waypoints and collected a balanced mix of locations of croplands and non-croplands (e.g., roads, natural vegetation, fallow fields, buildings, etc.).
The survey tool contained data on land use class, present and historical fertilizer use, and the number of seasons under cultivation (if classified as cropland). For data classified as croplands, surveyors were required to include a photograph of the field for verification purposes. Using digital collection tools allowed for near real-time monitoring and feedback for the team. Data from more than 1,000 locations across the North Central region of Nigeria was collected within one month.
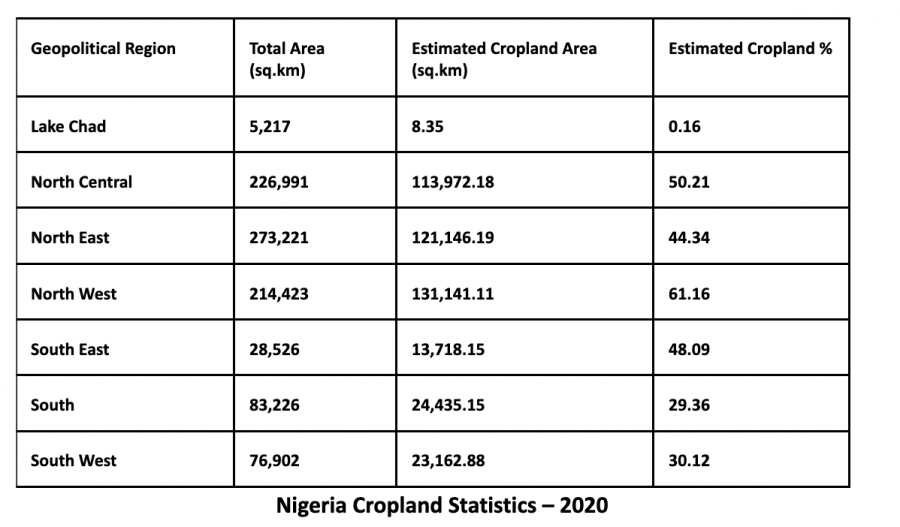
Cropland Statistics
Statistics have been generated for cropland areas under production across the various geopolitical regions and states in Nigeria (see table below). These statistics include total land area, estimated cropland area, and estimated cropland percentage, which can be compared against statistics from other sources. A further breakdown on regional and state statistics can be viewed via an interactive map.7
Cropland Area Comparison Nigeria: 2020 vs. 2021
QED has updated the previous 2020 cropland map produced for Nigeria in order to reflect cropland estimates in 2021 and review any changes between the two years. To derive multi-year cropland predictions, QED employed Transfer Learning (TL), an AI technique which is used in scenarios with a large existing dataset and trained models and a smaller but related dataset from which new models are trained. Rather than collecting enough new data to build new models, the existing data and models are leveraged to develop the new models and are augmented with smaller sets of new data to provide additional data for the model to learn. In this case, QED used the cropland model developed for 2020 and adapted it to work with the dataset for 2021. Using this technique, the updated cropland map for Nigeria from the 2021 season was produced with slightly higher accuracy than from 2020.Developing the ability to map croplands across multiple years provided additional insights into national crop production dynamics. We estimate that arable land across Nigeria between 2020 and 2021 experienced a net increase of 1.34%. While numerically small as an absolute percentage (given the size of Nigeria), 1.34% equates to 12,225.19 km, roughly half of the total land area of Rwanda.These results demonstrate promise for more cost-effective updating of national-scale maps, if there is demand to regenerate them on a yearly subscription basis across multiple African countries.
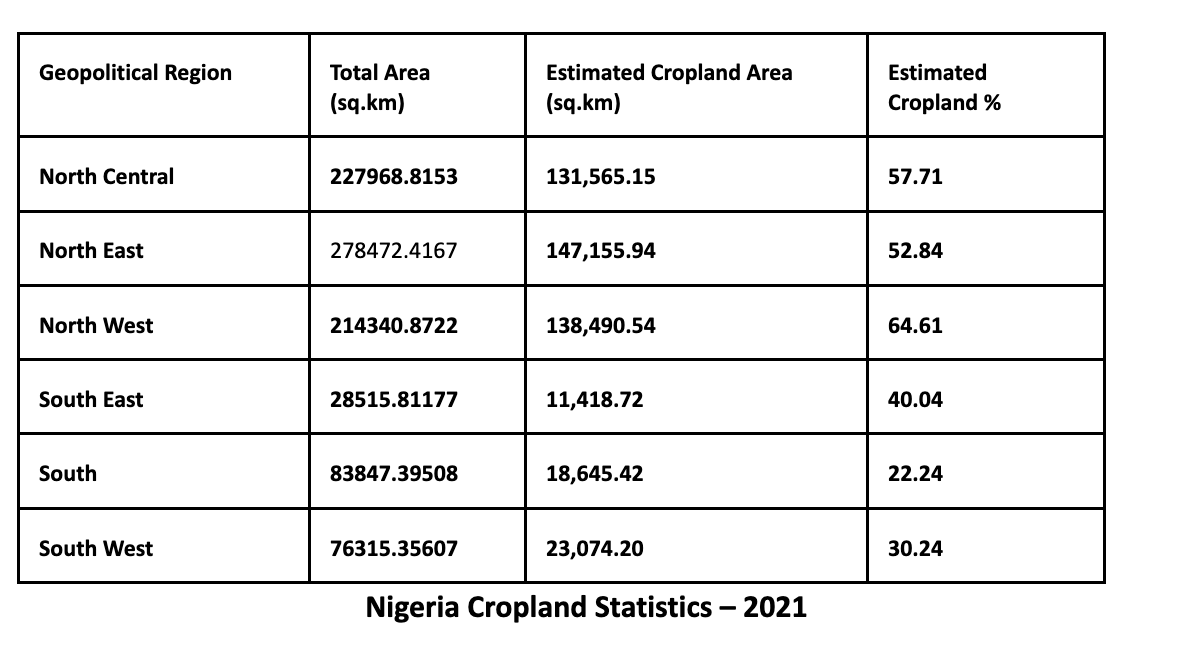
Highlight: Comparisons estimate an increase of 1.34% in Nigeria’s national cropland production equal to +12,225.19 km.
We also noticed that many inter-annual differences occurred around the borders of natural areas. Many bandits (e.g., Boko Haram) use the forested areas as home bases. There appears to be consistent correlations between the regions known to have banditry and corresponding reductions in cropland.
VIFAA Going Forward
In November 2022, AfricaFertilizer (AFO), our partner on the Visualizing Insights on Fertilizer for African Agriculture (VIFAA) program, rebranded and launched a new website. This website includes the integration of country-specific VIFAA dashboards, which were previously housed in separate websites. By integrating the country-specific dashboards as well as fertilizer data on trade, production, consumption, and retail prices for 18 countries in sub-Saharan Africa, the new AFO data allows easier comparative analysis across countries and contributes its quota to the advancement of food security throughout Africa.
We have updated the previous country-specific dashboards links to now redirect you to AFO’s new website in order to ensure you are accessing the most up-to-date resources.
- Chapin Metz, 1991.
- Learn more about the program at go.developmentgateway.org/vifaa.
- For more information about QED please visit https://qed.ai.
- I.D. Hill et al 1978.
- Kussul et al 2017. Available at https://ieeexplore.ieee.org/abstract/document/7891032.
- Engage with the map: https://maps.qed.ai/map/ng_cp_preds.
- The map is available at https://cropstats-ng.qed.ai.
Share
Related Posts
From Data Gaps to Impact: Key Insights from the VIFAA Program
Over the last six years, DG, together with its partners AfricaFertilizer (AFO) and Wallace & Associates, collaborated to implement the Visualizing Insights on Fertilizer for African Agriculture (VIFAA) Program. In the program’s final year (2024), the team undertook a “program learning process” to reflect on outcomes, challenges, and successes through internal interviews. This blog captures five key learnings, which we hope will guide similar programs aiming to bridge data gaps in agricultural development.
Case Study: Fostering Sustainable Agriculture through Data-Driven Collaboration and Partnership: Ethiopia, Mozambique, and Nigeria
Through DG’s Visualizing Insights on Fertilizer for African Agriculture (VIFAA) program, we recently published a case study titled “Fostering Sustainable Agriculture through Data-Driven Collaboration and Partnership: Ethiopia, Mozambique, and Nigeria.” It dives deep into how the VIFAA program has impacted the fertilizer data and markets in Ethiopia, Mozambique, and Nigeria. In this blog, we explore the overall impact that the VIFAA program is making, why the program was needed, and offer some key highlights from the case study.
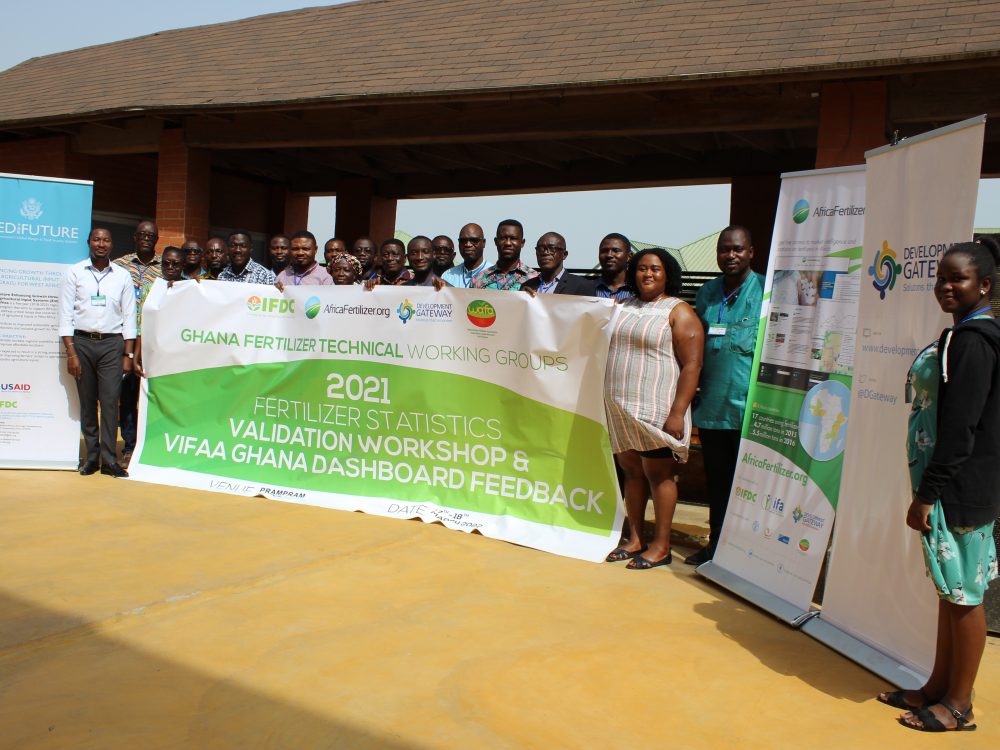
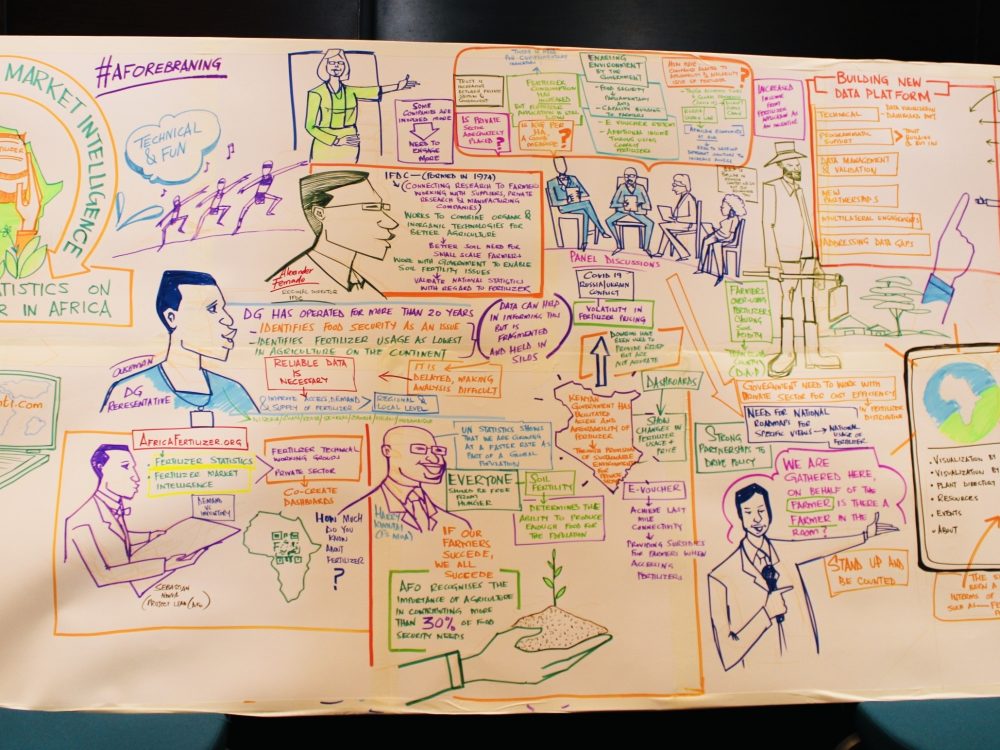
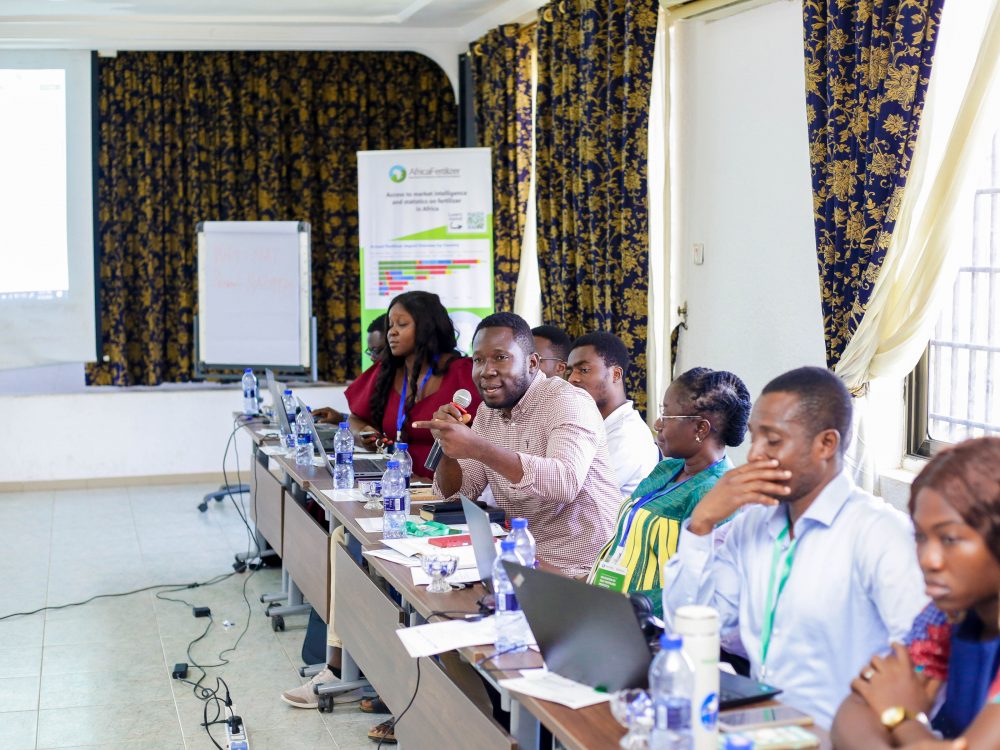
Fertilizer Technical Working Groups Provide Key Insights into Africa’s Fertilizer Sector
From June 2021 to September 2022, Development Gateway: An IREX Venture’s (DG’s) Visualizing Insights on Fertilizer for African Agriculture (VIFAA) program convened 12 Fertilizer Technical Working Groups in 14 countries which have yielded essential information on Africa’s fertilizer sector, including insights on how geopolitical events have impacted the fertilizer sector and what is needed to mitigate resulting threats to food security throughout Africa.
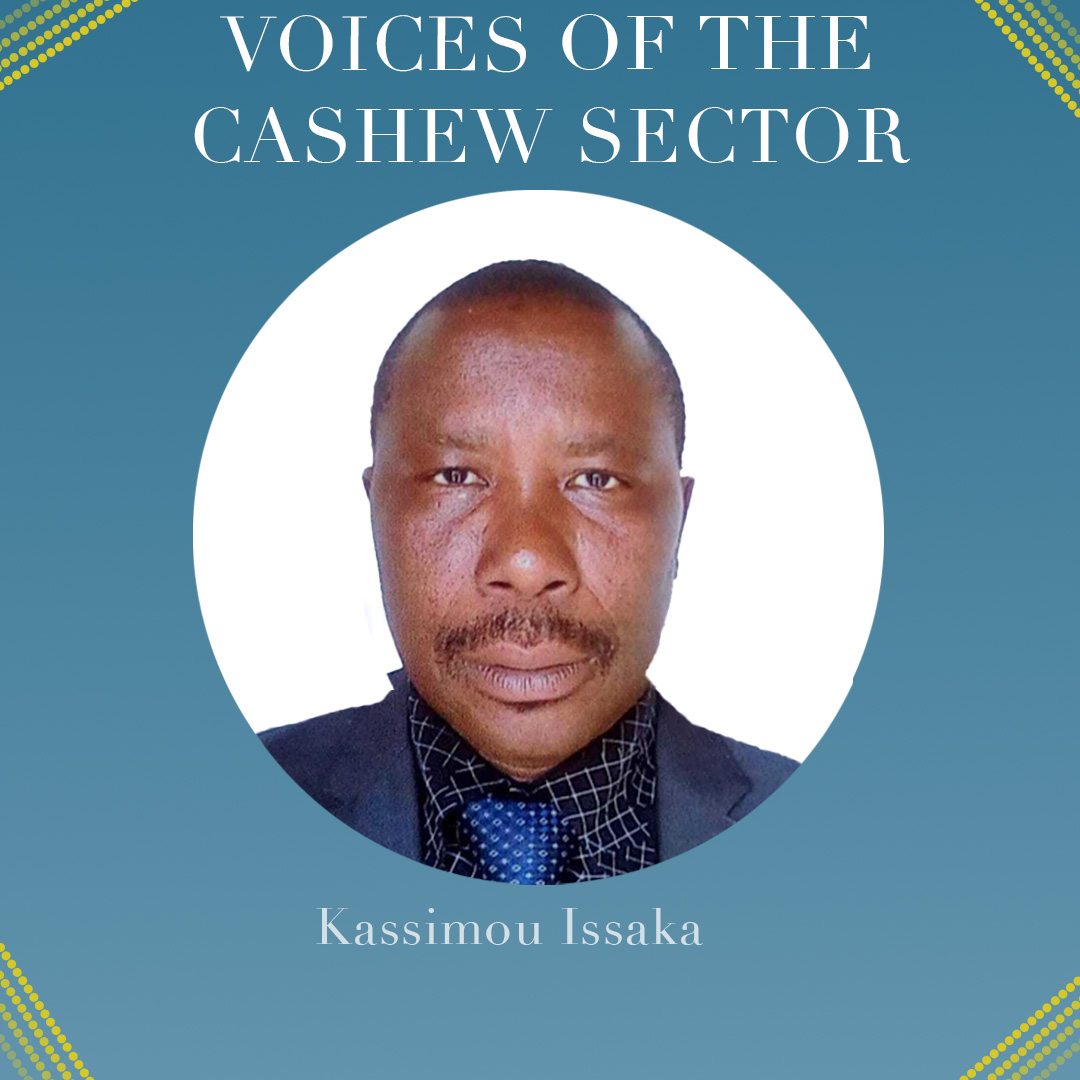
Échos du secteur de la noix de cajou – Kassimou Issaka
En 2020, Cultivating New Frontiers in Agriculture (CNFA) s’est associé à Development Gateway (DG) dans le cadre du projet USDA West Africa PRO-Cashew pour développer la plateforme de collecte et d’analyse de données Cashew-IN.
Le projet a identifié des lacunes dans la collecte, le stockage, l’utilisation et la diffusion des données relatives au secteur du cajou dans les cinq pays de mise en œuvre (Côte d’Ivoire, Bénin, Burkina Faso, Ghana et Nigeria). Le projet s’efforce maintenant de combler ces lacunes par le biais d’un système de gestion des données sur la noix de cajou dans plusieurs pays (Cashew-IN) qui facilitera l’accès aux données et leur utilisation pour améliorer la prise de décision des décideurs, des agriculteurs et du secteur privé. L’objectif ultime est de générer de meilleurs résultats sur le marché de la noix de cajou dans ces pays.
Kassimou Issaka, agroéconomiste et directeur général de l’Agence territoriale de développement agricole (ATDA Pôles), donne un aperçu du travail de l’ATDA et explique comment la plateforme Cashew-IN développée par DG et CNFA soutiendra son travail.
Parlez-nous du ATDA Pôles en quelques mots.
L’ATDA4 est une organisation sous tutelle du Ministère de l’Agriculture, de l’Elevage et de la Pêche (MAEP) du Bénin qui a pour mission de mettre en œuvre la politique du Gouvernement en matière de promotion des filières porteuses spécifiques au Borgou Sud – Donga – Collines du Bénin. Elle est dotée de la personnalité morale et de l’autonomie financière et regroupe 16 communes avec pour siège Parakou.
L’ATDA4 a entre autres pour attribution d’élaborer, faire valider et conduire avec les acteurs-clés du territoire du pôle, les plans; de faciliter l’accès des acteurs des filières aux informations et innovations, de coordonner les projets de développement des filières agricoles intervenant dans le pôle; de coordonner les interventions des acteurs publics et privés sur les filières agricoles dans le pôle de développement.
Quelle est votre ambition, ces 5 prochaines années, pour la filière anacarde?
Pour la période 2019-2021 le Bénin ambitionnait de porter la production de noix brute de cajou à 300 000 tonnes et d’en transformer 50% localement, soit 150 000 tonnes. Actuellement, l’évaluation de la réalisation de cette ambition est en cours. Mais on peut déjà retenir que la production cible n’est pas atteinte et que les unités de transformation installées ont une capacité largement inférieure aux prévisions.
En 2021, le Gouvernement du Bénin a lancé l’étude de faisabilité du Programme National de Développement des Plantations et des Grandes Cultures (PNDPGC). La filière anacarde figure en bonne place dans ce programme. En effet, le Bénin projette d’implanter 500 000 ha de nouvelles plantations d’anacardiers d’ici cinq (05) ans et de transformer localement la totalité de sa production. Pour y parvenir, des unités de transformation ont été créées et un décret pris par le Gouvernement pour interdire l’exportation de la noix de cajou brute du Bénin à partir du 1er avril 2024.
Comment l’outil Cashew-IN peut vous aider à atteindre vos objectifs?
Avec l’outil Cashew-IN les zones potentielles d’extension de la production peuvent être connues sur le territoire national. Il en est de même de la facilitation du suivi de l’évolution des indicateurs de la filière. Les informations disponibles appuieront la prise de décision.
Cette interview a été modifiée pour des raisons de clarté et de style.
Pour toutes questions ou suggestions, merci de vous rapprocher de Madame Constance Konan, ckonan@developmentgateway.org.
Partenaires
USDA
Le ministère américain de l’agriculture est un département fédéral qui assure le leadership dans les domaines de l’alimentation, de l’agriculture, des ressources naturelles, du développement rural, de la nutrition et des questions connexes, sur la base de politiques publiques, des meilleures données scientifiques disponibles et d’une gestion efficace. Grâce à son projet PRO-Cashew, l’USDA s’efforce de stimuler la compétitivité des producteurs ouest-africains en améliorant l’efficacité et la qualité de la production et du commerce, et en travaillant à l’élaboration de politiques régionales plus cohérentes en matière de commerce et d’investissement.
CNFA
Cultivating New Frontiers in Agriculture est une organisation internationale de développement agricole spécialisée dans la conception et la mise en œuvre d’initiatives agricoles durables basées sur les entreprises. CNFA travaille avec des entreprises, des fondations, des gouvernements et des communautés pour établir des partenariats locaux et mondiaux personnalisés qui répondent à la demande croissante de nourriture dans le monde. Depuis notre création en 1985, CNFA a conçu et mis en œuvre des initiatives de développement agricole basées sur les entreprises afin de faciliter l’accès au marché, d’améliorer la compétitivité des entreprises agricoles, d’accroître la productivité et d’améliorer l’accès aux intrants et au financement dans 47 pays du monde.
Pour en savoir plus sur Cashew-IN, consultez notre liste de lecture du programme Cashew-IN sur YouTube.
Share
Recent Posts
Building Lasting DPI Through Local Ownership: Lessons from Ethiopia’s Livestock Information System
Sustainable DPI depends on more than technology – it requires local capacity and government ownership. Drawing on lessons from Ethiopia’s aLIVE program, this blog explores how investing in both can build more resilient and lasting DPI.
Three Fundamentals for Climate and the Future of Health
Climate change is no longer a distant environmental concern; it is a growing public health challenge. Reflecting on discussions during London Climate Action Week, this blog explores why stronger investment, cross-sector collaboration, and better data are essential to building climate-resilient health systems.
(inter)National Models for Women’s Safety Online
Development Gateway and IREX spent the last year analyzing how different nations approach the "how-to" of online safety regulations. This blog discusses our research, which suggests that the most effective models go beyond reactionary and punitive measures to facilitate a functional ecosystem of trust and accountability.