Resilience by eDesign: Digital Emergency Procurement
Public procurement may not be the most exciting function of government bureaucracy – but in a global emergency, public spending helps acquire materials to respond to the crisis, and stimulates the economy to assist with post-crisis recovery. The UK Treasury has pledged over £15 billion for PPE procurement, and the US government spent $2.6 billion on Covid-19 response contracts between February and April 2020 alone.
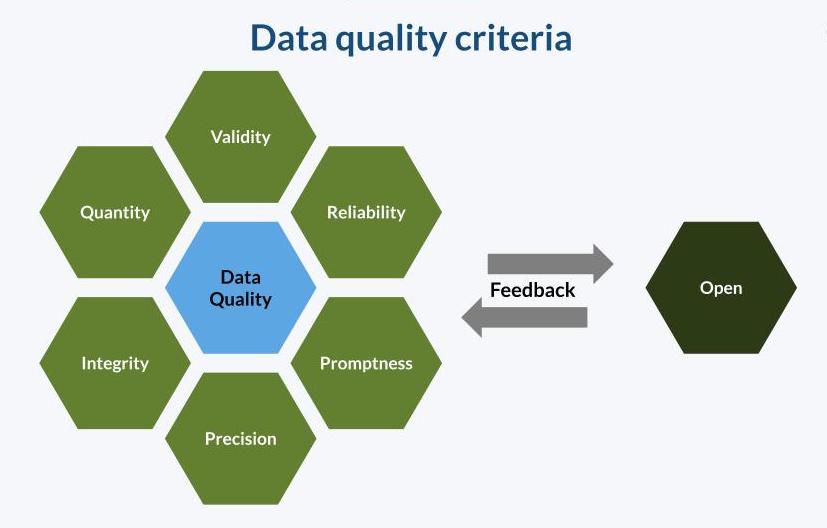
Countries with user-friendly procurement technology were much better suited to ramp up purchasing as prices skyrocketed, exchange rates fluctuated, and distribution channels were interrupted. However, we know that digital technologies are not a panacea for better governance, and the market shocks of the Covid-19 pandemic have made this clear once again. Digital tools such as e-procurement need to be complemented by comprehensive strategies and policies that ensure user needs are met from a more holistic perspective.
In recent months with these digital and policy challenges top-of-mind, DG set out to understand what public procurement policies, contracting mechanisms, and data and digital capabilities were required to procure a rapid and effective emergency response. A holistic view of procurement data, digital, and policy needs during an emergency is captured in the public-facing Emergency Procurement: Lessons Learned from Covid-19 Report and accompanying Indicator Framework.
Today, we are excited to launch the Report and Indicator Framework.
Emergency Procurement Indicator Framework & Overview
Emergency Procurement Indicator Framework & Overview [prompts Excel download]
DG and the Global Digital Marketplace Programme’s Covid-19 Emergency Procurement Collaboration
Development Gateway has been working on a project for the UK Government Digital Service (GDS) Global Digital Marketplace Programme and the Prosperity Fund Global Anti-Corruption Programme, led by the Foreign & Commonwealth Office (FCO), which included the topic of Covid-19 procurement response. This work was completed through a combination of desk research, key informant interviews, and participation in public discussions and forums.
Innovation in Crisis: Creative Solutions to Emergency Procurement
Despite having a federal agency designated to emergency response coordination, the US’s emergency procurement system failed to account for the unprecedented market shocks presented by this pandemic: 1) its global scale, and 2) requirements for social distancing. Without a central purchasing hub or coordinated budget planning, state-level buyers in the United States competed against one another to secure personal protective equipment (PPE) for healthcare workers. Supply chain risk protocols were not in place for local buyers to identify shipping disruptions, meaning city officials in Los Angeles and Boston had to hire private planes to retrieve PPE orders after disruptions to shipping lanes made normal market routes impossible.
Additionally, a majority of worldwide government services and procurement transactions – especially at the state level – are facilitated via face-to-face or paper-based systems. But even without fully-digitized procurement systems, we’ve observed many examples of creative solutions that assist governments in deploying a faster, more equitable pandemic response.
The following is a subset of tools that were launched to help governments navigate the high-risk and volatile Covid-19 market:
| Demand Aggregation Tools | Supply Aggregation Tools | Digital Marketplaces | Open Data Platforms |
|---|---|---|---|
| Colombia expanded its open contracting portal, Colombia Compra Eficiente, to centralize procurement and incorporate a demand aggregation instrument | In South Africa, the state of KwaZulu-Natal created its own Covid-19 Supplier Database for its Public Health Department | Amazon Business created Covid-19 supply store for frontline medical personnel and emergency response organizations | Ecuador developed a public procurement search tool and called on the public to help monitor pandemic procurements for corruption, including a training video with information on how to register and report suspicious activity |
| Malaysian civil society launched kitajagakita.com, a platform which matches people who want to help with people who need help | The UK government launched a webpage where UK businesses could offer coronavirus support | Gov shop is part of the US National Governors Association (NGA) Task Force on the Covid-19 supply chain, and is maintaining
a national registry of “verified” and vetted suppliers |
Moldova launched a Covid-19 procurement dashboard to allow the public to monitor pandemic spending |
In studying these solutions, we made a few key observations:
- Buying smarter and faster in an emergency requires tradeoffs – and procurement data can help governments make more informed purchasing decisions (the next post in this series will explore this in-depth!)
- Some rules preserve integrity, but others hamstring response – can any procurement regulations or contract terms become more flexible in crisis?
- Learning from success or failure can help build more resilient procurement systems – in many ways, Covid-19 can be seen as a “worst case scenario,” and inform priorities for future improvements. Further, although the pandemic is on an unprecedented scale, many user needs and data use cases would hold for any emergency, such as an earthquake.
e-Procurement Is a Means, Not an End
e-Procurement digitizes several phases of the government purchasing process for increased efficiency and time and cost savings, and many public procurement officers are urging their governments to make the shift if they have not already done so.
But it’s important to remember that digitalization in itself is not an end goal. This lesson has been underscored through the experiences of Public Procurement Officers charged with supplying a response to Covid-19. In order for procurement technology to be resilient to market shocks and domestic emergencies, it needs to take a holistic view of user needs.
This post is the first in a 3-part blog series focused on DG’s collaboration with the Global Digital Marketplace Programme. To learn more about how these procurement technologies can be more user-centered, stay tuned for Part 2 on what we learned about digital user needs and data use cases during this emergency.
Related Posts
Procurement Data and COVID-19: Buying Smarter in a Crisis
Achieving resilient public procurement goes beyond digitization and automation: data generated through these processes must also be used by government to make smarter decisions – particularly during crisis – and by civil society to hold government accountable for those decisions.
Building Procurement Back, Better
As governments look to “build back better,” we can expect an influx of government spending to stimulate the economy, and a shift in priority goods and services to purchase. While the world transitions from emergency response to recovery, governments’ focus will shift from using technology to procure other products, to procuring technology products themselves.
When Covid-19 Confirms the Need for Open Contracting in Senegal
Each year, governments spend trillions of dollars through public procurement of goods and services – without a focus on accountability, much can be lost through waste or corruption. Today, more than ever, transparency in public procurement and Open Contracting is needed in Senegal and around the world as governments respond to and recover from the Covid-19 pandemic.
Why a Fertilizer Dashboard for Kenya?
VIFAA Going Forward
In November 2022, AfricaFertilizer (AFO), our partner on the Visualizing Insights on Fertilizer for African Agriculture (VIFAA) program, rebranded and launched a new website. This website includes the integration of country-specific VIFAA dashboards, which were previously housed in separate websites. By integrating the country-specific dashboards as well as fertilizer data on trade, production, consumption, and retail prices for 18 countries in sub-Saharan Africa, the new AFO data allows easier comparative analysis across countries and contributes its quota to the advancement of food security throughout Africa.
We have updated the previous country-specific dashboards links to now redirect you to AFO’s new website in order to ensure you are accessing the most up-to-date resources.
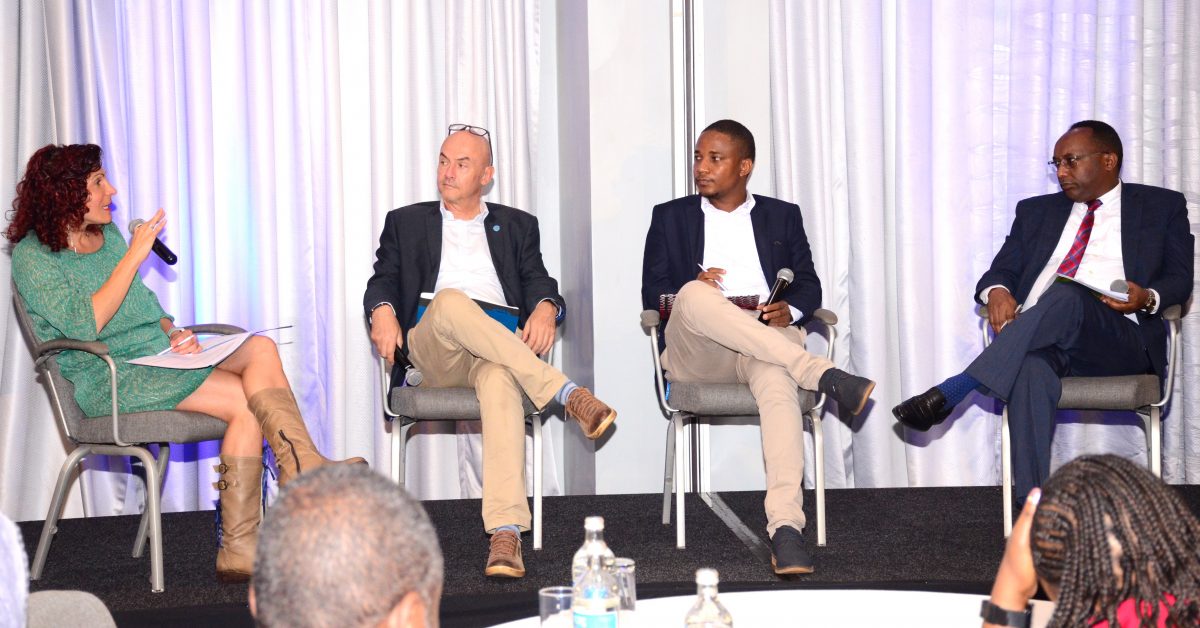
Yesterday, we launched the Visualizing Insights for African Agriculture (VIFAA) Dashboard in Kenya. Tracking information from fertilizer price to consumption, the new dashboard makes Kenya’s fertilizer data easier to access, use, and share for national and county level decision making.
Below, Grace Chilande of AFO and IFDC explains why the VIFAA dashboard is needed and how it will be used.

We are proud to have launched the VIFAA dashboard in partnership with Africafertilizer.org (AFO), the International Fertilizer Development Center (IFDC), the Kenya Ministry of Agriculture, Livestock and Fisheries, county governments, numerous private sector companies, and development partners.
Share
Related Posts
Supporting Ethiopia’s National Soil Fertility and Health Action Plan
Declining soil fertility remains a major constraint on Ethiopia’s agricultural productivity. This blog reflects on the launch of the National Soil Fertility and Health Roadmap and DG’s support in its development, highlighting lessons on government-led reform and long-term resilience.
Development Gateway Collaborates with 50×2030 Initiative on Data Use in Agriculture
Development Gateway announces the launch of the Data Interoperability and Governance program to collaborate with the 50x2030 initiative on data use in agriculture in Senegal for evidence-based policymaking.
Reflecting on 3 Years of Digital Advisory Support for Agricultural Transformation
As the DAS program concludes, this blog reflects on its impact in advancing digital transformation in agriculture, highlighting lessons on capacity building, knowledge transfer, and sustaining resilient food systems.
Building resilient food systems is essential to ensuring global access to nutritious, sustainable diets. Yet, despite agriculture and food production increasing globally over recent decades, acute food insecurity and malnutrition continue to rise, particularly among the world’s most vulnerable populations.
Addressing this challenge requires systemic change across the entire food ecosystem, from production and monitoring to distribution and quality assurance. It also involves equipping smallholder farmers with timely data and user-friendly digital tools that empower them to make informed decisions, improve productivity, better integrate into existing value chains, and deal with the interconnected challenges they face.
However, merely supplying data and digital agriculture tools is insufficient to enable the systemic change required to strengthen the resilience of food systems. To achieve this form of long-term impact, it is necessary to provide sufficient advisory services on how to best utilize these data and tools, as well as local capacity building and training to ensure that the necessary advisory support services remain available when and where they are needed most.
DAS: Improving the Efficiency of Agriculture Data Use
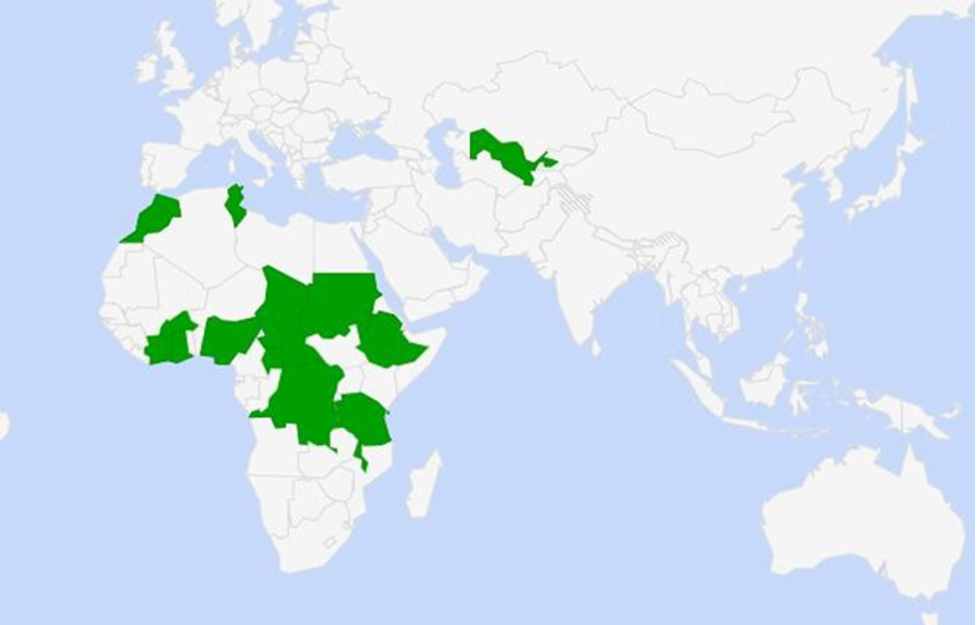
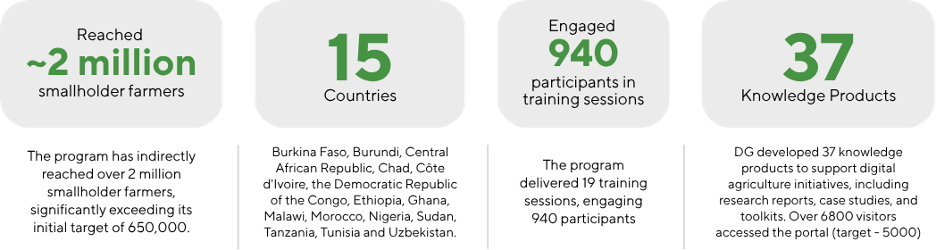
To support this need, Development Gateway (DG), in partnership with digital development experts, Jengalab, and training experts, TechChange, with support from the International Fund for Agricultural Development (IFAD), implemented the Digital Advisory Support Services for Accelerated Rural Transformation (DAS) program from 2022 to 2025. By providing technical support for ICT4D activities within IFAD-financed programs, DAS aimed to improve the livelihoods of rural smallholder farmers through facilitating digital transformation in agriculture. The program’s target regions were East and Southern Africa, Central and West Africa, and the Near East and North Africa.
With the DAS program concluding in March 2025, we reflect on its impact in integrating ICT4D solutions to improve rural livelihoods, the effectiveness of its knowledge transfer and capacity building for sustaining gains, and the lessons it offers for future agricultural technology programs.
Integration of ICT4D Solutions
To support IFAD – the only multilateral development institution that focuses exclusively on transforming rural economies and food systems – with its digital strategy, DAS provided on-demand advisory services to support ICT4D activities for IFAD-financed programs. By filling gaps related to technical support, DAS strengthened the ability of these programs to build, maintain, and scale their use of technology in supporting farmers.
While the impact of the DAS support services is ongoing and may only become apparent in the months and years to come, some have already been identified, captured in the examples below.
Nigeria
In Nigeria, the DAS program conducted an assessment of the digital agriculture ecosystem. Serving as foundational research for various project activities – including online training on principles of digital development, interoperability, and in-person monitoring and evaluation (M&E) training – this assessment helped identify key digitalization challenges in the country, such as connectivity and affordability, and generated recommendations for strategic partnerships to address these challenges.
The assessment, which identified data gaps, prioritized interventions, and fostered collaboration with stakeholders, facilitated the development of an ICT4D strategy with the Nigerian government, laying a solid foundation for local ICT-enabled projects and providing a strong case for scaling digital innovations in IFAD-supported programs.
Morocco
In Morocco, DAS provided ICT4D support to the Integrated Rural Development Project of the Mountain Areas in the Oriental Region (PADERMO), contributing to the development of specific actions within the project. These included a pilot initiative to monitor beehives digitally, the establishment of digital agricultural cooperatives, and the use of digital services to promote and market agrifood products.
In particular, support from DAS partners enhanced the integration of digital tools, such as piezometers – geotechnical sensors that measure pore water pressure and water level in soil and rock – during the design phase. To further improve impact in future interventions, the team noted that digital skills training and a deeper understanding of implementation partners’ practical capacities would be highly beneficial.
Tanzania
In Tanzania, DAS assisted with the development of the country’s first e-agriculture strategy – the Digital Agriculture Strategy (2025 – 2030) – by conducting a situational analysis and generating a draft zero for it. This enabled the Ministry of Agriculture (MoA) to better leverage digital agriculture technologies and enhance data-driven decision-making in the country. DAS further supported capacity-building activities for the government and implementing partners on how to effectively integrate digital solutions for agriculture, informed by digitalization trends and practices from other countries.
Following the development of the e-agriculture strategy, IFAD, in collaboration with the United Nations Capital Development Fund (UNCDF) and the Food and Agriculture Organization of the United Nations (FAO), formed the Joint Programme on Data for Digital Agricultural Transformation, supporting the MoA to better leverage data and strengthen interoperability to transform the country’s agriculture sector and provide more efficient service delivery. Through the technical support provided by DAS and the subsequent Joint Programme, 10 innovative agri-tech projects are expected to scale up, with additional catalytic investment provided for 3 agri-tech projects. It is estimated that this will result in more than 500,000 smallholder farmers – including 300,000 women and 100,000 youth – gaining access to enhanced digital services.
Impact of Capacity Building Trainings
By identifying specific learning areas within digital agriculture that would be of greatest relevance to IFAD-financed programs, Development Gateway and TechChange designed a number of training courses that provided capacity building for those who work in agriculture, as well as to mid-to-senior level officials and technical staff working in ministries, agencies, and organizations.
A total of 19 in-person training sessions were held on a variety of different topics, reaching 940 participants. Following up with these participants more than six months after they had completed their training, 92% stated that much or all of the course content remained relevant to their work and that they continue to frequently support colleagues using the concepts learned.
In addition to in-person training sessions, the DAS ICT4Ag Digital Classroom Series was created, containing four IFAD-sponsored self-paced training courses and ensuring the continued impact of the initiative. Two examples of IFAD-sponsored training courses on digital agriculture are highlighted below.
Basics of Digital Agriculture Ecosystems and Interoperability
In this course, participants learned about the causes and consequences of fragmented data, as well as the tools and techniques needed to achieve digital transformation for rural agriculture. Through exploring models of enabling environments for digital agriculture, participants learned how to assess the maturity of their own agriculture ecosystem. This course further outlines use cases and best practices for interoperable data use in digital agriculture, linking data from different sources in a standardized, context-aware way.
Access the free 2-hour self-paced Basics of Digital Agriculture Ecosystems and Interoperability course.
Basics of Digital Rural Finance for Agriculture
Introducing participants to digital finance in agriculture, this course explores how digital services and tools can be applied to an agricultural project or intervention with a financial component. Completing the course enabled participants to draw insights from IFAD’s project portfolio on the relevance of digital technologies to advance financial inclusion in rural areas, as well as to utilize IFAD’s financial strategy to deliver these tools and services to smallholder farmers.
It further equipped participants with knowledge of how to accurately assess the financial needs of smallholder farmers and how best to leverage digital technologies to address them. Through the use of real examples and case studies, the course made understanding the principles underlying the design and implementation of digital financial initiatives as simple and applicable as possible.
Access the free 2-hour self-paced Basics of Digital Rural Finance for Agriculture course.
Lessons Learned & Recommendations
Through its 3-year lifespan, the DAS program made significant strides in supporting the digital transformation of agricultural systems across IFAD’s portfolio across East and Southern Africa, Central and West Africa, and the Near East and North Africa. Through tailored advisory services, targeted capacity building, and the development of knowledge products, the programme strengthened the ability of governments, project teams, and implementing partners to integrate digital tools in a way that is inclusive, sustainable, and aligned with local contexts However, as with every program, there were lessons to be learned on how to improve the impact of such programs in the future.
- Deploying ICT4D solutions in resource-constrained settings with low levels of digital literacy requires a strategic, context-aware approach that grounds innovation in practicality.
- Time constraints were a recurring challenge in countries such as Tunisia and Uzbekistan, where short mission durations restricted the depth of engagement. This hindered the ability to address more complex digital needs or provide sufficient capacity-building.
- In scenarios where capacity is limited and advisory engagements are short, it can further be difficult for the Project Management Unit (PMU) staff to define their needs and internalize the steps necessary to drive change and sustainably take recommendations forward to achieve long-term success.
- Programs could have benefited from a more unified approach to digitalizing Monitoring & Evaluation (M&E) processes, as well as involving end users in the design of any tool.
- Although the DAS intervention has proved valuable in a multitude of implementing countries, room for improvement exists in tailoring the digital solutions provided to fit the local context. Feedback suggested that consultants could benefit from a deeper understanding of IFAD’s context and projects to enhance their ability to provide practical and implementable technical solutions. This is particularly important in aligning with the realities on the ground, such as the technical capacities of the implementing partners, the developmental (rather than research-oriented) nature of IFAD projects, and the characteristics of the final beneficiaries – mainly smallholder producers with relatively low digital and technical skills.
Recommendations for Future Programs
As the DAS program closes, it opens more doors for follow-up initiatives that build on the results it has achieved. In particular, the three facets of knowledge transfer, local ownership, and long-term sustainability will remain paramount for any initiative seeking to achieve digital transformation in the rural agriculture sector.
More than that, the following recommendations are suggested for future programs:
- Prioritize preliminary capacity-building activities: It is highly recommended that future digital interventions aiming to achieve similar results carry out preliminary capacity-building activities, such as a dedicated introductory phase for digital training. This will ensure that teams and PMUs are equipped with the necessary skills and knowledge to effectively implement digital solutions, efficiently adapt ICT4D tools to the local context, and maximize their ability to sustainably impact development outcomes.
- Implement M&E frameworks during the design phase: In order to accurately assess the effectiveness and impact of digital initiatives, it is paramount that clear M&E methodologies – as well as a structured approach to introducing these frameworks – be included in the program’s design. Doing so enables teams to easily track progress, effectively maintain alignment with the program’s objectives, and efficiently evaluate how well the digital components were implemented, as well as their ongoing impact on driving systemic change.
- Provide long-term ICT4D support: Finally, it is important to note that short-term advisory missions often lack the depth needed to fully implement programs that provide technical assistance. As such, it is recommended that long-term technical assistance be provided within IFAD’s projects to foster continuity, mentorship, and problem-solving beyond initial design, ensuring impact continues to evolve well after the program’s close.
The Kenya Fertilizer Dashboard is Live!
We are thrilled to announce that the Kenya Fertilizer Dashboard, under the Visualizing Insights for African Agriculture (VIFAA) program is live and available to the public.
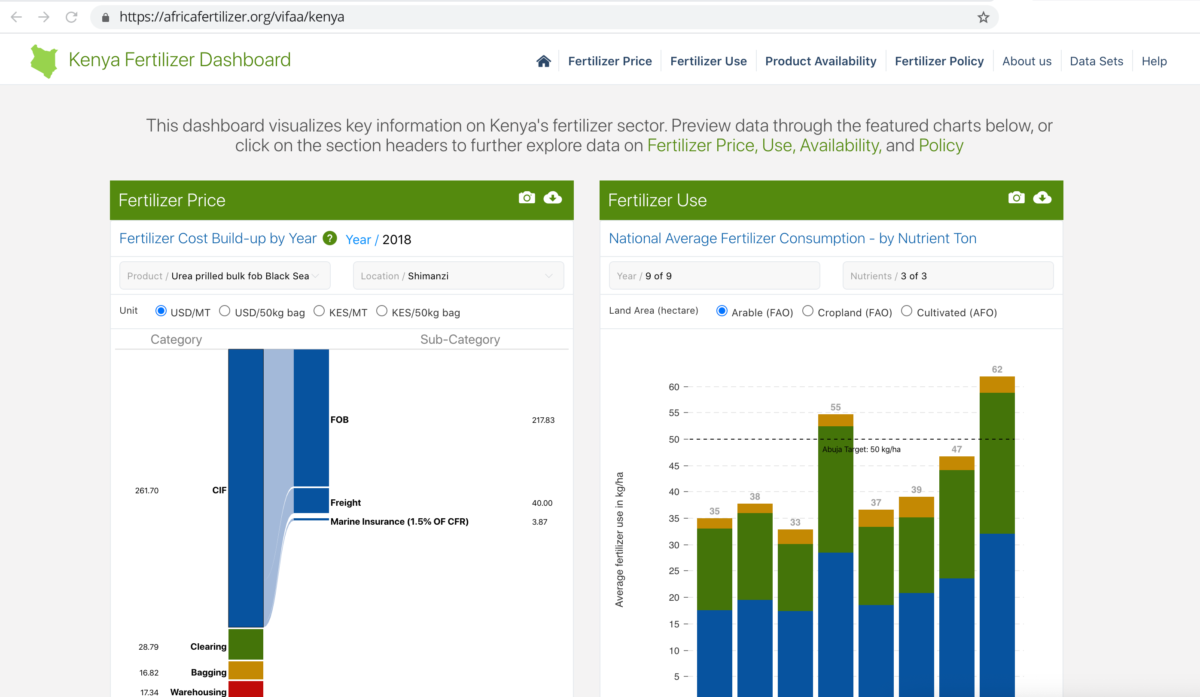
Over the last year, Development Gateway has worked in close partnership with Africafertilizer.org(AFO), the International Fertilizer Development Center (IFDC), the Kenya Ministry of Agriculture, Livestock and Fisheries, County governments, numerous private sector companies, and development partners to understand the cycle of demand, supply, and use of Kenya’s fertilizer data. Together we have co-designed a dashboard to address key decision-making needs, prioritizing data such as fertilizer price, production and consumption data, and identifying new opportunities to collaborate in closing data gaps.
The interactive, user-friendly site enables users to:
- View key data on fertilizer price, use, availability, and policy in one place;
- Interact with different products and crops across years of data; and
- Download data in a variety of formats.
The Kenya Dashboard is the first of three, with dashboards for Nigeria and Ghana soon to follow. Check back for further details!
For a deeper dive into the indicators on the dashboard, read blog 1 and blog 2 in this series.
If you’re interested in learning more about the Kenya Fertilizer Dashboard, please contact Charlene Migwe cmigwe@developmentgateway.org or Vinisha Bhatia-Murdach vbhatia@developmentgateway.org. This work has been supported by the Bill & Melinda Gates Foundation.
VIFAA Going Forward
In November 2022, AfricaFertilizer (AFO), our partner on the Visualizing Insights on Fertilizer for African Agriculture (VIFAA) program, rebranded and launched a new website. This website includes the integration of country-specific VIFAA dashboards, which were previously housed in separate websites. By integrating the country-specific dashboards as well as fertilizer data on trade, production, consumption, and retail prices for 18 countries in sub-Saharan Africa, the new AFO data allows easier comparative analysis across countries and contributes its quota to the advancement of food security throughout Africa.
We have updated the previous country-specific dashboards links to now redirect you to AFO’s new website in order to ensure you are accessing the most up-to-date resources.
Share
Related Posts
From Data Gaps to Impact: Key Insights from the VIFAA Program
Over the last six years, DG, together with its partners AfricaFertilizer (AFO) and Wallace & Associates, collaborated to implement the Visualizing Insights on Fertilizer for African Agriculture (VIFAA) Program. In the program’s final year (2024), the team undertook a “program learning process” to reflect on outcomes, challenges, and successes through internal interviews. This blog captures five key learnings, which we hope will guide similar programs aiming to bridge data gaps in agricultural development.
Case Study: Fostering Sustainable Agriculture through Data-Driven Collaboration and Partnership: Ethiopia, Mozambique, and Nigeria
Through DG’s Visualizing Insights on Fertilizer for African Agriculture (VIFAA) program, we recently published a case study titled “Fostering Sustainable Agriculture through Data-Driven Collaboration and Partnership: Ethiopia, Mozambique, and Nigeria.” It dives deep into how the VIFAA program has impacted the fertilizer data and markets in Ethiopia, Mozambique, and Nigeria. In this blog, we explore the overall impact that the VIFAA program is making, why the program was needed, and offer some key highlights from the case study.
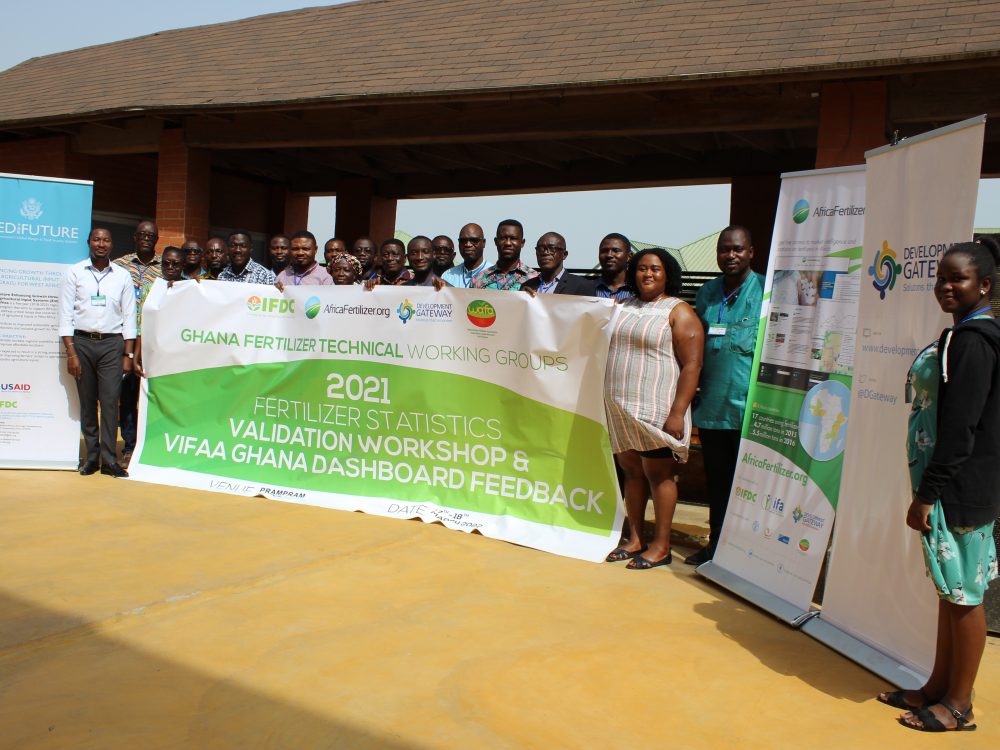
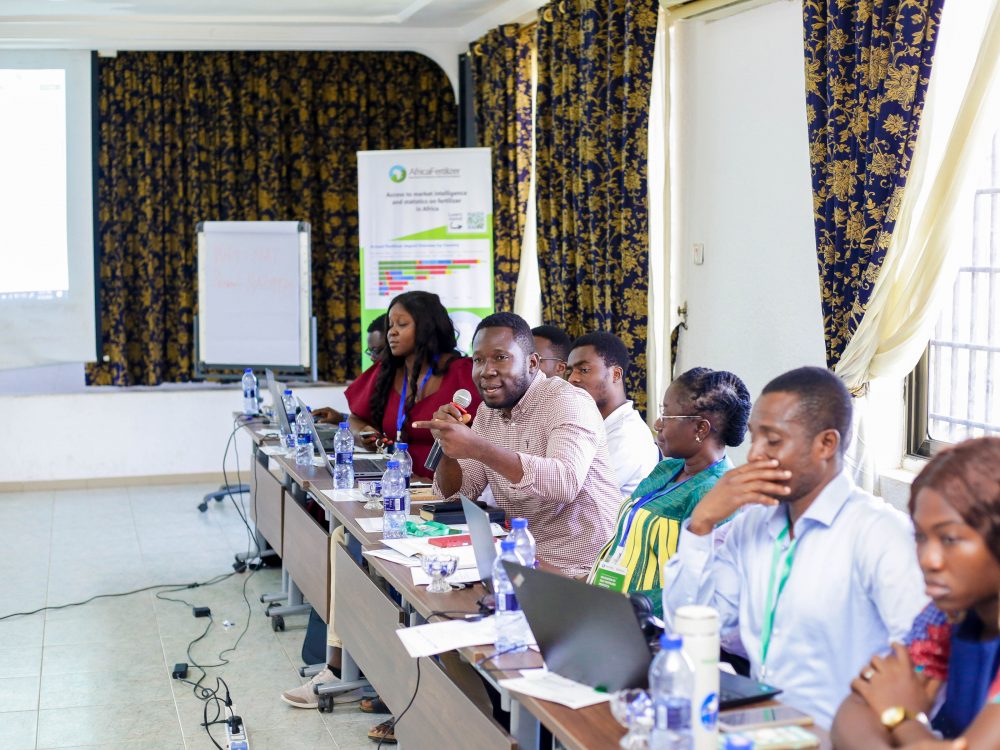
Fertilizer Technical Working Groups Provide Key Insights into Africa’s Fertilizer Sector
From June 2021 to September 2022, Development Gateway: An IREX Venture’s (DG’s) Visualizing Insights on Fertilizer for African Agriculture (VIFAA) program convened 12 Fertilizer Technical Working Groups in 14 countries which have yielded essential information on Africa’s fertilizer sector, including insights on how geopolitical events have impacted the fertilizer sector and what is needed to mitigate resulting threats to food security throughout Africa.
Sourcing Fertilizer Data in Sub-Saharan Africa
Scott Wallace is an agriculture development expert and a Senior Fertilizer Advisor to the VIFAA program. He has been advising DG since 2017. Grace Chilande is a Fertilizer Markets Specialist and AfricaFertilizer.org Coordinator at IFDC. Vinisha Bhatia-Murdach is Senior Learning Advisor and has been with DG since 2015.
For a deeper understanding of the data shown through The Visualizing Insights on Fertilizer for African Agriculture (VIFAA) program dashboard read the first blog in this series.
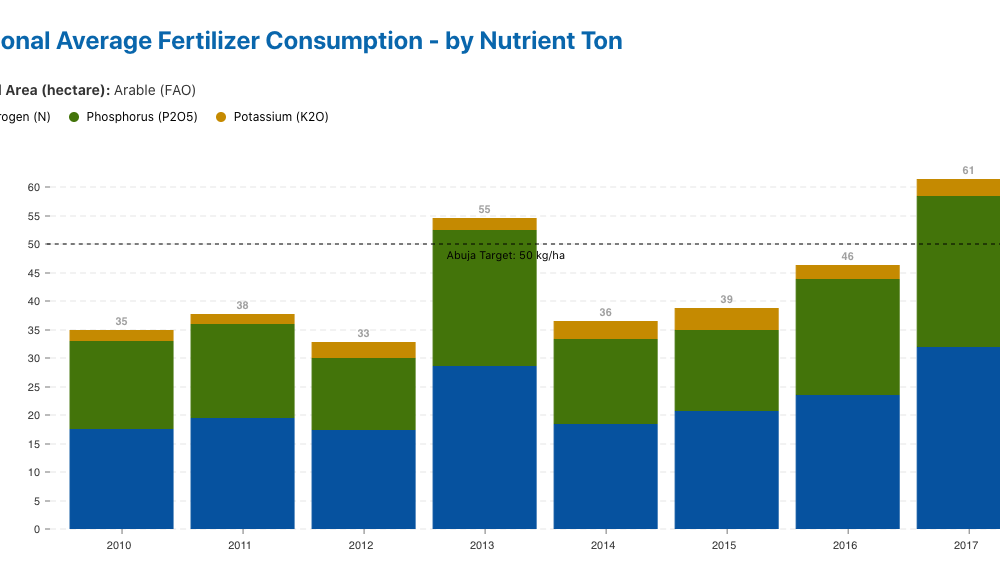
Previously, we talked about the importance of price, policy, consumption, and availability sub-indicators that inform the high-level indicator called Kilograms per Hectare (Kg/Ha) or more formally referred to as the National Average Fertilizer Consumption. In advance of the first VIFAA country dashboard launch next week, we will explore the importance of and how we source accurate and reliable data for each of the indicators. This is a crucial step in making data available in a way that stakeholders can use to inform their decisions.
Source: Fertilizer Technical Working Group (FTWG)
Analysis by: Africafertilizer.org
Why is accessing reliable consumption data important but challenging?
The Kg/Ha or National Average Fertilizer Consumption indicator is crucial to benchmark a country’s fertilizer use with its neighbors, the rest of the world, and in a historical context to understand year on year progress. At a high level, the indicator, Kg/Ha, relies on two critical pieces of information that are difficult to acquire. First, the numerator (Kg) equates to the total fertilizer consumed in a calendar year. Second, the denominator (Ha) equates to how much arable land was utilized during the same time frame.
For now, let’s focus on the numerator (total fertilizer consumed) and why this data is so difficult to acquire, despite being one of the most important pieces of information sought by stakeholders. This information relies on data such as how much fertilizer was produced domestically, how much was imported, how much was exported, how much was consumed during the year, as well as the amount of fertilizer held in storage for the next farming season. When the various data sets remain in silos, government, and private sector market actors are not able to make decisions that ensure there are no supply shortages and agricultural production shortfalls. Surveying all the supply-chain participants and smallholder farmers in a given country would be one solution, but is simply not possible. Even if it were, the process could be riddled with response biases that make it difficult to acquire accurate information. Thus, fertilizer consumption data has to be triangulated from multiple sources.
To highlight some of the problems that occur when gathering data, let’s study the fertilizer market of a non-existent country called Nabanda.
In Nabanda there are 5 major private sector fertilizer suppliers that import and distribute fertilizer. Last year these suppliers imported 250,000 metric tons of fertilizer. The Government also announced a tender to supply 75,000 metric tons of product at a 50% discount. However, the announcement came late due to the government awaiting budget approval. Thus, halfway through the season, an additional supply of fertilizer was distributed. However, the price was quite attractive to traders who purchased a large quantity of product and smuggled it across the border into neighboring landlocked countries where profits are higher. Two of the major importers utilized their imported product as raw material to blend the fertilizer for maize farmers (the largest crop produced in Nabanda). Due to delays at the port, a significant percentage of their product was not able to be blended before the rains fell. Thus, this product will remain in storage for next year’s farming season. The other three private-sector importers (two of which participated in the government tender) sold all of their product to five key distributors in the country. These distributors had large amounts of urea (a nitrogen-based product) in their warehouses from the previous year so their warehouses increased the amount of product in storage, but could not get enough fertilizer to satisfy farmer demand. At the end of the year, the Customs office declared that 325,000 metric tons of fertilizers reached smallholder farmers during the year. The Ministry of Agriculture highlighted the 75,000 metric tons had a major impact on the yield of smallholder farmers. Simultaneously, the National Bureau of Statistics reported that 50% of the states in Nabanda did not have enough product to meet the needs of the maize farmers during the year. Most likely, your head is swirling with numbers. This is a typical example of issues that create confusion when trying to understand how much fertilizer was actually utilized by farmers during the year.
Where Does the VIFAA Program Get the Necessary Fertilizer Data for its Dashboards?
Keeping in mind the case study of Nabada, early in the program we realized that if VIFAA dashboards are to be used in decision making, they need a strong data provider with deep roots in public and private sector partnerships to access quality data. Therefore, in 2019, the International Fertilizer Development Center’s (IFDC) AfricaFertilizer.Org (AFO) initiative joined the VIFAA program and AFO is now the main source of data for VIFAA dashboards. VIFAA- AFO partnership has been crucial in ensuring that data from both the public and private sector are brought forward and reliably sourced in the dashboards.
AFO was started in 2009 to address the gaps in fertilizer data on availability and market information in sub-Saharan Africa (SSA) with the goal of increasing fertilizer nutrient use to 50Kg/Ha. Over the years, AFO has worked to consistently collect, process, and publish official national statistics on production, trade, consumption, and price.
AFO collects this data in three ways:
1. Direct collection through consultants and field data collectors
2. Partnerships and data sharing agreements with market analysis firms, government ministries, customs, and revenue authorities, and from private sector companies that enable it to gather so much important data
3. Initiatives such as national Fertilizer Technical Working Groups (FTWGs).
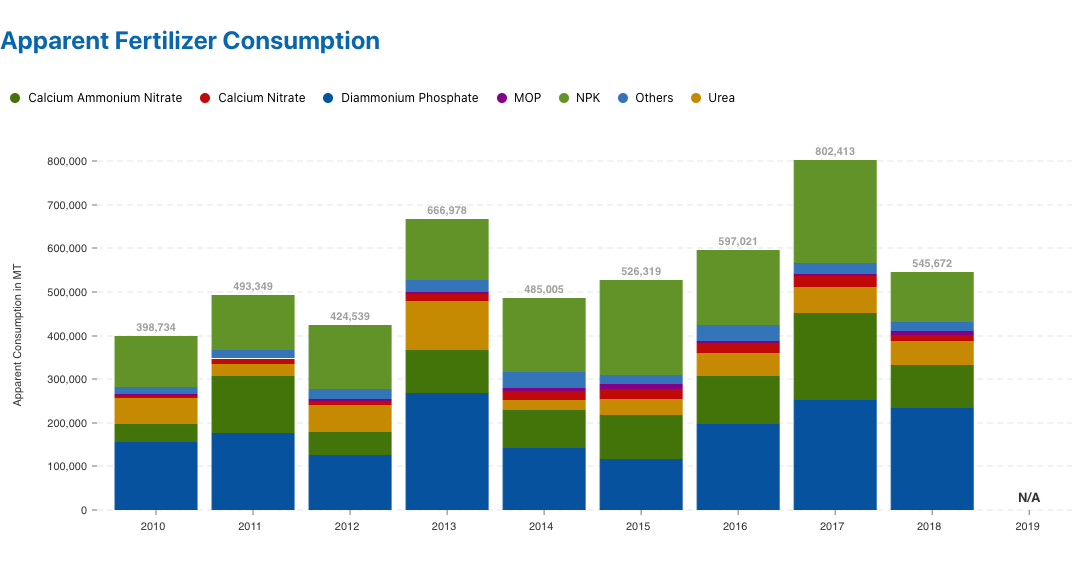
As the case study of Nabada highlights above, many stakeholders have information about how much fertilizer was consumed in a given year, but in their own silos. FTWGs provide a crucial mechanism for understanding how much fertilizer was consumed, by bringing together stakeholders from the public and private sector to triangulate the existing fertilizer data. Depending on the country, the FTWG typically represents the customs office, the port authority, the ministry of agriculture, the national bureau of statistics, and key private sector representatives. The FTWG meetings usually take place during the first quarter of the year when government data becomes available for the previous year. The FTWG representatives spend two days going through each organization’s data to resolve differences between the various organizations and identify the “apparent consumption” amount for that year, which all stakeholders can agree to. This allows all stakeholders both public and private sector to understand the market situation, agree on a common set of data, and better prepare for the needs in the upcoming season.
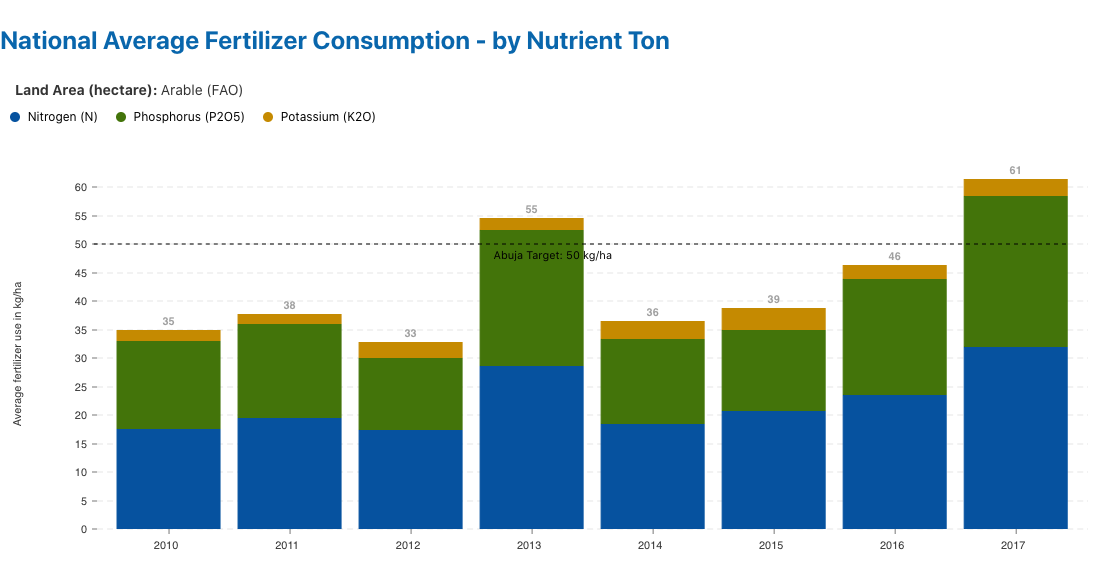
This apparent consumption data, collected by AFO at the FTWG meetings is the very same one used in the numerator of the fertilizer sector’s most important high-level indicator – Kg/Ha. VIFAA visualizes both the apparent consumption and the national average fertilizer consumption data on the dashboards. VIFAA users in the public sector apply this information to track progress against the fertilizer goals or adjust policies and create incentives for actors in the supply chain as needed. The private sector can apply this information to better plan procurement and imports for the following season.
VIFAA Going Forward
In November 2022, AfricaFertilizer (AFO), our partner on the Visualizing Insights on Fertilizer for African Agriculture (VIFAA) program, rebranded and launched a new website. This website includes the integration of country-specific VIFAA dashboards, which were previously housed in separate websites. By integrating the country-specific dashboards as well as fertilizer data on trade, production, consumption, and retail prices for 18 countries in sub-Saharan Africa, the new AFO data allows easier comparative analysis across countries and contributes its quota to the advancement of food security throughout Africa.
We have updated the previous country-specific dashboards links to now redirect you to AFO’s new website in order to ensure you are accessing the most up-to-date resources.
Share
Related Posts
Understanding Fertilizer Data
Finding reliable agriculture data in sub-Saharan Africa is often difficult. If available at all, data is usually fragmented and tucked away in silos within government ministries or closely held by private companies. It is also significantly delayed or in a format that makes analysis difficult. For stakeholders who need information for decision making, a lack of reliable data is a significant barrier. The Visualizing Insights on Fertilizer for African Agriculture (VIFAA) program is working towards making fertilizer-related data, a key subset of agriculture data, more accessible to stakeholders for decision making.
Why a Fertilizer Dashboard for Kenya?
In developing the VIFAA Kenya Dashboard, we worked in partnership with Africafertilizer.org (AFO) and the International Fertilizer Development Center (IFDC) to understand the cycle of demand, supply, and use of Kenya’s fertilizer data. Grace Chilande of AFO and IDFC provides more information on why the dashboard is needed and how it will be used.
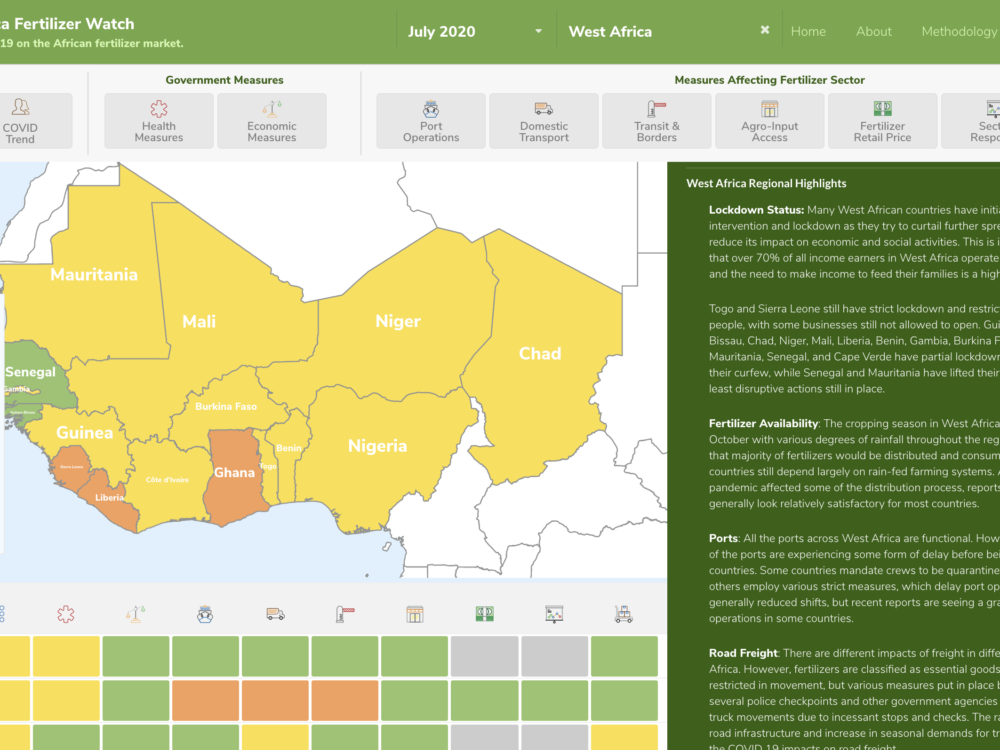
Measuring COVID-19’s Impact on the Fertilizer Sector in Sub-Saharan Africa
The COVID-19 Africa Fertilizer Watch Dashboard, covering 28 countries across sub-Saharan Africa was launched today. This dashboard uses 11 indicators to track COVID-19 country-specific mitigation measures on the delivery & use of fertilizers to identify impacts on productivity & food security across the continent. The goal of this dashboard is to support efficient and effective responses to the evolving global health emergency, and ensure that sufficient and appropriate fertilizers reach farmers.
Turning 20 in 2020…

As I sit to write about Development Gateway’s future, on our 20th anniversary, the world looks quite different than it did just a few short months ago. In one sense, the global pandemic has left no one untouched; while in another it has painfully underscored the many ways in which persistent inequities amplify the impact of emergent shocks. Globally, we have seen increased backlash against these inequities, from the US to Mali to India to Hong Kong, and beyond.
Within digital governance, the “technology theatre” of COVID-19 response continues to be fraught: we’ve seen a multitude of tools-first approaches, outsized influence from big tech, and insufficient data governance models that risk undermining trust in government and instead opening doors for harms. Meanwhile, comparing the performance of countries in combating COVID-19 has underscored the need for effective (and trusted) government, reduced bureaucratic corruption, and strengthened social cohesion, with trusted sources of data and information to go along. As our board member, Nanjira Sambuli, put it, “[t]here is no technological wonder that can ‘leap frog’ this fundamental reform” toward locally owned, trusted, and legitimate application of technology in solving critical governance and service delivery challenges.
While the world feels less predictable than at any point in my life, DG’s vision of a world in which institutions listen and respond to the needs of their constituents; are accountable; and are efficient in targeting and delivering services that improve lives feels more relevant than ever. But while our vision remains fixed, 2020 has highlighted that helping to build this future requires us to be more audacious in our advocacy, more intersectional in our approach, and more ambitious in our work. Marginal improvements will not take us through a recovery toward a brighter future.
Who We Are and How We Work Matters
Global DG: When I joined DG in 2010, we were very much a “DC shop” with a large US team and heavy center of gravity in our HQ. Outside of the US, our offices in Dakar, Senegal, and Nairobi, Kenya were small and led by senior European consultants.
Over the past decade, we’ve decentralized to the point where two-thirds of our team is based outside of the US, and have prioritized hiring team members in and from the countries in which we work. This decentralization has made DG a better organization that benefits from diverse perspectives, understanding of (sub)national context, and greater trust from governments and partners. It has also made us more resilient during COVID-19, enabling us to continue our work more effectively. Future team growth will continue to be almost exclusively in the countries and regions where our work takes place, as we further our identity as a truly global organization.
Equity and Inclusion: DG has placed a strong emphasis on gender: in our leadership, governance, HR policies, programs, external advocacy, and policy engagement. We’ve had the opportunity to be the fiduciary vehicle for the Open Heroines network, as it grows its community and considers long-term governance arrangements. This focus on gender will continue to be a critical element of DG’s approach, and will become more intersectional with a stronger emphasis on race and other forms of inclusive representation.
Adaptation: DG has gone through many iterations over the past two decades, and that ability to change is both the secret to our longevity and the key to our future success. While it’s become trite to say, DG is truly a learning organization: we take what we learn in one program and apply to others, we constantly confer with partners and clients to learn how we can do better, and we work to improve the skills and knowledge of our team. In an uncertain environment, the ability to learn, adapt, and apply our core competencies of data, technology, and institutional change toward emergent needs is crucial to our future.
Understanding Institutions: One of the legacies of our World Bank founding is a long history of working closely with governments and development agencies from the inside. Our approach has changed significantly over the decades to be more problem-driven and collaborative, but our experience has created the credibility to serve as trusted partners – navigating bureaucratic hurdles and inevitable politics and territoriality – to support governments in using data and technology to solve their highest priority challenges.
Data, Technology, and Evidence: Everything we do at DG centers around supporting our partners to apply data, technology, and evidence toward achieving better, more equitable outcomes. Building tools that get used – whether to improve procurement efficiency and transparency, designing better tobacco control policies, or informing governments of the impact of COVID-19 on fertilizer markets – all start with identifying real problems and applying the best available data and evidence. As we are seeing in 2020, the need for trusted intermediaries and technical and political support for evidence-informed policy-making is more important than ever. We can’t confidently project the exact challenges 2021-onward, but we can anticipate that the ability to support trust-based, rigorous, equitable, appropriately governed, and timely data use will be needed to meet them.
Our Third Decade
As we look forward to DG’s next decade, which coincides with the end of the 2030 SDG era, the tumult of the present, together with our core identity and skills, point us to several opportunities to contribute to a more hopeful future.
Data Equity: It’s no longer enough to do the right things in managing data securely and ethically, or even to push for stronger data protection, privacy, and governance. 2020 has made clear yet again the deep inequities in how data are collected (or not), protected (or exposed), and used (or abused) – and the ways in which performative technology theatre distracts from the harder work of building trust in government and providing digital services that are fairly designed and responsive to the needs of constituents. Data to inform policies that are responsive to the needs of women, minority, and marginalized communities are often missing and/or not disaggregated, and the default lens of (white) male data too often persists. DG will become more assertive in pushing for a future where data are collected for the benefit of – and in participatory consultation with – the communities from which they are currently extracted, used to support the priorities of those communities, and protected and/or deleted when their consented purposes are achieved. We were at the forefront of the open data movement and the push for data use, and will increase our investment to become a leader in defining, practicing, and advocating for data equity in development.
Policy and Advocacy: DG has evolved in recent years into a policy contributor, building from our hands-on work to shepherd critical lessons between the global development community and our partners at the national and subnational levels. Historically, this work has been exclusively bootstrapped and scaffolded on top of existing projects. As we see the impact our work can have on global and national policymakers, we also see the opportunity and need to do more – to address critical issues like systemic racism and sexism in development, the ongoing crisis in global cooperation, and continued challenges in applying and using evidence. For the first time in 2020, we have carved out a core budget for policy that, while modest, will be complemented by greater fundraising focus to build out a policy practice at DG.
Programmatic Focus: In recent years, we’ve moved from an organization that followed a more traditional consulting approach (implementing dozens of smaller projects per year), to one that takes on several concurrent large programs (current examples include: OpenDCH, DCDJ, VIFAA, TASAI VISTA, TCDI, AD3, and a soon-to-launch program on data for cashews in West Africa). Implementing these larger programs initially stretched us – requiring advancements in our operational processes, M&E capabilities, and administrative processes – but also validated our theory that longer-term implementation, deeper partnership, and more iterative design processes gives us a greater opportunity to achieve deep and meaningful partnerships and impact.
A global pandemic may not be the ideal business environment to pursue a growth agenda, but we believe that now is the time for DG to be bolder, and that this boldness will require that we also be bigger. The world around us is changing daily, but the principles upon which we are built are the right ones for navigating and influencing that change. We are looking forward to working with our partners in making DG’s 3rd decade our most ambitious and successful one yet.
Share
Related Posts

20 Years of Lessons Learned
DG has been shaped by 20 years of lessons learned through assessments, implementations, and challenges. These lessons have helped to evolve our approach, influenced our policy perspective, and supported continuous growth & innovation.

Who Are We Now?
Over the last twenty years, DG has morphed into a global organization with location-based personnel across the world. Where are we now? Who is Development Gateway and what do we prioritize?
A Brief History of DG
As we celebrate our 20th anniversary, we recognize that in many ways the DG of today and the DG of 20 years ago are totally different, but what we have accomplished and learned on the journey has become part of our DNA. Our successes and challenges have fed into our ethos as the innovative, agile organization that we are today.
Who Are We Now?
Charlene Migwe-Kagume is a Senior Consultant based in Nairobi. She works in Kenya on Open Contracting and Fertilizer data. Charlene has been with DG since 2018. In this post, Charlene gives an overview of DG’s current work and priorities.
DG’s Ownership Priority
When I joined DG in 2018, I instantly knew I had joined a group of young and vibrant individuals. What struck me the most was the willingness of everyone at DG to learn and quickly adapt to improve. As we celebrate our 20th anniversary, we look back at our data approaches guided by lessons learned over the years in understanding the most suitable solutions for different geographies, use cases, and engagements. In particular, our proactive experience in both technical and policy implementation guides us in delivering tailored and viable data solutions.
Out of the many positive elements of DG’s approach, I will focus on ownership, which in my opinion, is by far the most valuable aspect of all our projects. Simply because if ownership is not established at the beginning of a project, well-built data tools will be left lying idle – not used to inform decision-making and policy. Establishing ownership of any data initiative comes with keeping in mind certain complex factors. Time and thought need to be taken to understand the stakeholders and their needs.
Our Agile Approach to Meeting Stakeholder Needs
In our experience, stakeholders may change, and their needs may also change throughout the project. In particular, when working with the government, priorities are often determined by changes in society, political landscapes, or other external factors. For example, some priorities of both national and sub-national governments will need to align with national strategies, which are constantly evolving. At DG, we apply an agile approach to implementation that has proven effective in ensuring the data initiative adapts to the ever-changing needs of government institutions.
Incentives and Policies for Ownership
However, an agile approach needs to be complemented with incentives and clearly defined policies that establish the use and institutionalization of data initiatives. A number of data initiatives will require some form of commitment from the government, which often are slow to organizational change, and may have some personnel who lack the motivation to adopt new initiatives. Adding value to the target institution is not always sufficient in ensuring the long-term adoption and use of data initiatives. Over the years, we have learned that integrating data use strategies and policies establish necessary guidelines for the long-term use of data initiatives, and we have learned how to embed this practice in the institution’s processes. Finally, strategic stakeholder engagement in the adoption of data use strategies and policy must be done.
In 2018, DG, in partnership with HIVOS, supported the Government of Makueni County in Kenya to ensure the use of open contracting data in improving procurement processes. Ownership was a key priority because the County government’s objective was to institutionalize its commitment to open contracting, and to ensure all departments use the data to improve the county’s procurement process and reduce corruption. In 2018, an MoU established between HIVOS, DG, and Makueni County that assigned each party activities aimed at ensuring the use of open contracting data in improving procurement processes. Some of the activities include handover training, developing a data management plan to ensure timely data is published, and the establishment of an open contracting policy to guide all departments.
Looking Ahead
Over the last twenty years, DG’s work has been pioneering and has had a significant impact in shaping data and policy conversations. Started in the World Bank, DG has morphed into a global organization with location-based personnel across the world. Based in Nairobi, I have seen the impact of this in ensuring context-aware and flexible decisions in all our implementation work. Be it aid management, open contracting, agriculture, or health, we collect and document learning through our in-country assessments that give us institutional, sub-national, and national contexts. The Visualizing Insights on Fertilizer for African Agriculture (VIFAA) initiative – supported by the Bill & Melinda Gates Foundation – is a great example, with a team from Kenya, Armenia, Romania, Argentina, US, Nigeria, and Ghana.
At DG, we harness the knowledge from our global teams to improve the implementation of our projects, and looking ahead, there are opportunities to share our learning externally as well. We look forward to translating our learning into global contributions, continuing to shape our data work and policy positioning.
Share
Related Posts
Turning 20 in 2020…
As we look forward to DG’s next decade, which coincides with the end of the 2030 SDG era, the tumult of the present, together with our core identity and skills, point us to several opportunities to contribute to a more hopeful future. We are looking forward to working with our partners in making DG’s 3rd decade our most ambitious and successful one yet.
20 ans de leçons apprises
DG a été façonné par 20 ans de leçons apprises à travers les évaluations, les mises en œuvre et les mesures d’atténuation pour faire face aux défis. Ces leçons ont contribué à faire évoluer notre approche, à influencer notre perspective stratégique et à soutenir l’innovation continue.
20 Years of Lessons Learned
DG has been shaped by 20 years of lessons learned through assessments, implementations, and challenges. These lessons have helped to evolve our approach, influenced our policy perspective, and supported continuous growth & innovation.
Understanding Fertilizer Data
Scott is a senior agriculture development expert and a Senior Fertilizer Advisor to the VIFAA program. He has been advising DG since 2017. Vinisha Bhatia-Murdach is Senior Learning Advisor and has been with DG since 2015.
The Visualizing Insights on Fertilizer for African Agriculture (VIFAA) program is working towards making fertilizer-related data, a key subset of agriculture data, more accessible to stakeholders for decision making.
Finding reliable agriculture data in Sub-Saharan Africa is often a difficult undertaking. If available at all, data is usually fragmented and tucked away in silos within government ministries or closely held by private companies. It is also significantly delayed or in a format that makes analysis difficult. For stakeholders in the agriculture value chain, who need information about the market for decision making, a lack of reliable data is a significant barrier.
At the same time, agriculture is a key source of livelihood in Sub-Saharan Africa. 33 million smallholder farmers – who make up approximately 80% of the population – need agriculture inputs such as tools, seeds, and fertilizer in order to produce a viable crop that they can sell in the marketplace. As fertilizer is the most expensive agricultural input for the farmer, making sure they have the right type of fertilizer, at the best price, and that it is available at the right time – is critical. Currently, not a single country in Sub-Saharan Africa is self-reliant on the primary nutrients needed for crops to grow (nitrogen, phosphorus, and potassium). Thus decisions on when to import and how much fertilizer to import needs to be made months before the rains come, since very few farmers in SSA have access to irrigation and they are reliant on the annual rains to water their crops.
The VIFAA Program aims to close key information gaps for fertilizer stakeholders in our focus countries of Kenya, Nigeria, and Ghana. By September 2020, the VIFAA team will launch its first dashboard focusing on Kenya’s fertilizer sector. It will cover four main areas of fertilizer information: price, consumption, availability, and policy. The ultimate goal of the VIFAA program is to support data use for decision making, and by extension to support smallholder farmers better access and use fertilizer they need.
In order to achieve these goals, VIFAA started with in-depth assessments in several African countries. We spoke with nearly 100 stakeholders to understand their priorities, how to turn those priorities into indicators, and then we set out to co-design the dashboard.
The assessment confirmed some of what we knew. From a perspective of 30,000 feet, the most important fertilizer indicator is the average consumption of fertilizer per area of cropland – Kilograms per Hectare (Kg/Ha) – which highlights how much fertilizer is actually being used in the field. In 2006, the Abuja Declaration on Fertilizer for an African Green Revolution set 50 kg/ha as the primary target to reach (we will talk more about this indicator and the current levels in technical detail throughout this series). This average fertilizer consumption indicator, Kg/ha, serves as a high-level target, but to understand what factors are contributing to this consumption rate requires additional information. Based on the public and private sector stakeholder feedback, VIFAA has categorized this information under four themes:
- Price How much does fertilizer cost throughout the entirety of the value chain?
- Availability How much product is actually available in the country?
- Fertilizer Use What types of products are farmers applying and which crops?
- Policy What is the policy environment and considerations around fertilizer that impact the factors above?
While DG has expertise in increasing data use and a background in agricultural projects, it was crucial to build a more specific skillset through partnership – specifically a partner with expertise in fertilizer data. We realized that the International Fertilizer Development Center’s (IFDC) Africafertilizer.org (AFO) initiative was well-positioned to strengthen existing fertilizer data sets, while making them more accessible to decision-makers. This was a perfect marriage as AFO has been collecting data but did not have the required expertise to ensure it was accessible and presented in a way that ensures stakeholders will use it. Together DG and AFO and jointly convened the potential public and private sector users of this data in Kenya, Nigeria, and Ghana. Through a series of workshops, we worked to define priority indicators within the themes listed above, and to co-design dashboard visualizations to meet the needs of the wide variety of fertilizer data users, all while ensuring the variation required to meet each country’s specific market needs. Over the next few weeks, look for more blogs as we tell the story of the VIFAA fertilizer dashboards, their data, and their use.
VIFAA Going Forward
In November 2022, AfricaFertilizer (AFO), our partner on the Visualizing Insights on Fertilizer for African Agriculture (VIFAA) program, rebranded and launched a new website. This website includes the integration of country-specific VIFAA dashboards, which were previously housed in separate websites. By integrating the country-specific dashboards as well as fertilizer data on trade, production, consumption, and retail prices for 18 countries in sub-Saharan Africa, the new AFO data allows easier comparative analysis across countries and contributes its quota to the advancement of food security throughout Africa.
We have updated the previous country-specific dashboards links to now redirect you to AFO’s new website in order to ensure you are accessing the most up-to-date resources.
Share
Related Posts
From Data Gaps to Impact: Key Insights from the VIFAA Program
Over the last six years, DG, together with its partners AfricaFertilizer (AFO) and Wallace & Associates, collaborated to implement the Visualizing Insights on Fertilizer for African Agriculture (VIFAA) Program. In the program’s final year (2024), the team undertook a “program learning process” to reflect on outcomes, challenges, and successes through internal interviews. This blog captures five key learnings, which we hope will guide similar programs aiming to bridge data gaps in agricultural development.
Case Study: Fostering Sustainable Agriculture through Data-Driven Collaboration and Partnership: Ethiopia, Mozambique, and Nigeria
Through DG’s Visualizing Insights on Fertilizer for African Agriculture (VIFAA) program, we recently published a case study titled “Fostering Sustainable Agriculture through Data-Driven Collaboration and Partnership: Ethiopia, Mozambique, and Nigeria.” It dives deep into how the VIFAA program has impacted the fertilizer data and markets in Ethiopia, Mozambique, and Nigeria. In this blog, we explore the overall impact that the VIFAA program is making, why the program was needed, and offer some key highlights from the case study.
Fertilizer Technical Working Groups Provide Key Insights into Africa’s Fertilizer Sector
From June 2021 to September 2022, Development Gateway: An IREX Venture’s (DG’s) Visualizing Insights on Fertilizer for African Agriculture (VIFAA) program convened 12 Fertilizer Technical Working Groups in 14 countries which have yielded essential information on Africa’s fertilizer sector, including insights on how geopolitical events have impacted the fertilizer sector and what is needed to mitigate resulting threats to food security throughout Africa.
20 ans de leçons apprises
Vanessa Baudin Sanchez est la Directrice Régionale de DG pour l’Afrique de l’Ouest, basée au Sénégal. Vanessa a commencé avec DG en 2008 en tant qu’analyste technique. Tout au long de son parcours, Vanessa a été un lien important entre les leçons apprises dans la mise en œuvre de nos projets et l’application de notre travail. Ici, elle met en évidence les leçons les plus importantes que DG a tiré des programmes qu’elle a mis en œuvre, et comment ont-ils façonné l’organisation que nous sommes aujourd’hui.
Click here to read this article in English.
Pourquoi l’apprentissage continu est-il important?

Ma première tâche à DG était de reconfigurer le réseau de notre partenaire au Burundi pour fournir aux utilisateurs PGA une connexion Internet stable et un accès confortable à notre plateforme. Je me souviens de cette première mission comme si c’était hier – ainsi que de nos premières installations PGA, avec leurs bugs, leurs exceptions Java, qui apparaisaient immanquablement en plein milieu de nos présentations!
Depuis lors, les installations PGA se sont considérablement améliorées et, le système répond presque parfaitement aux besoins des utilisateurs dans la mesure où les modules et les fonctionnalités supplémentaires ont été développés sur la base de leurs commentaires.
Notre processus Agile, et les processus opérationnels de nos partenaires, encadrent le développement de nos outils. Nous avons su répondre au défi récurrent du faible débit Internet dans la majorité de nos pays partenaires en créant une version hors-ligne de la plateforme. Au fil des années, nous avons amélioré la convivialité de la PGA, notre méthodologie ainsi que notre approche qui se veut participative tout au long du cycle du projet, pour des installations plus rationnelles, avec un meilleur rapport qualité-prix.
La PGA était notre produit phare au moment où j’ai rejoint DG. Les leçons que nous avons tirées du développement de nouvelles fonctionnalités et de l’étroite collaboration avec nos partenaires, nous ont amené à étendre les fondamentaux de la gestion de l’assistance au développement à d’autres secteurs, notamment à «ceux qui pourraient bénéficier d’une divulgation et d’une utilisation accrues des données».
Lorsque nous commençons un nouveau projet, ou que nous nous essayons de travailler dans un nouveau secteur, nous commençons toujours par une évaluation pays (mon étape préférée!). Les évaluations auxquelles j’ai participé ont été – et continuent d’être – la meilleure expérience d’apprentissage pour l’équipe du projet. Nous rencontrons toutes les parties prenantes. Très souvent, nos pays partenaires ont déjà pris des mesures pour améliorer la collecte et la divulgation de données; alors nous leur demandons «comment pouvons-nous vous aider?» – cette approche permet, avant tout, de reconnaître leur travail. Il s’en suit une évaluation conjointe des défis actuels, et enfin un partage de leçons apprises, de bonnes pratiques et recommandations à adapter à leur contexte.
Nous encourageons également nos partenaires à nous évaluer dans un souci de toujours faire mieux. Je pense que même si nous restons fidèles à notre mission et à nos valeurs fondamentales, nos méthodologies continuent d’évoluer notamment grâce aux retours constructifs, internes et externes, qui nous ont permis, 20 ans plus tard, de développer des solutions qui aident nos clients à atteindre leurs objectifs stratégiques
Lorsque DG a lancé l’indice WIM, en partenariat avec WIM Guinée, les participants ont partagé des commentaires qui auront sans doute un impact sur notre méthodologie si nous devions reproduire cet exercice à l’avenir: lorsque nous évaluons les commentaires, nous essayons d’évaluer les commentaires positifs et négatifs pour confirmer la neutralité de l’outil et confirmer l’adhésion des parties prenantes.
Les leçons de technologie
La technologie semble toujours effrayer les acteurs non-techniques qui sont sceptiques quant à sa pertinence, sa convivialité mais surtout sa pérennité. Leur réticence est plus que compréhensible lorsqu’ils référencent le nombre de systèmes qui ont été abandonnés quelques années après leur installation. S’il est difficile pour une organisation comme la nôtre d’affirmer que nos outils ne connaîtront pas le même sort, nous sommes en mesure de dire que notre approche inclut un important facteur de durabilité. Comment est-il articulé?
- Nos outils doivent être utiles. Par conséquent, ils doivent être flexibles et évolutifs. DG travaille avec des normes internationales progressives (par exemple, IATI, ITIE, OCDS) et soutient leur mise en œuvre au niveau national. Il en est de même pour les stratégies nationales qui peuvent changer pendant la mise en œuvre. L’appui de DG doit pouvoir s’adapter à ces aléas. L’évolutivité et la flexibilité sont deux facteurs clés inclus dans la première partie de l’approche de développement technique de DG, lui permettant de s’adapter rapidement aux nouvelles demandes et aux nouvelles exigences et de rester dans la course!
- Deux raisons sont souvent invoquées pour expliquer pourquoi beaucoup de systèmes informatiques sont abandonnés dans les pays: la première est liée aux coûts récurrents de licence qui finissent par être trop chers pour les institutions; la seconde est liée au manque de capacités locales pour gérer et maintenir un système au fil du temps. DG a résolu le problème de coût car nos outils sont développés sur des logiciels open source, sans frais de licence. Pour la deuxième préoccupation, nous mettons l’accent sur la formation et le renforcement de capacités locales, un volet fondamental dans tous nos programmes tant sur l’utilisation que sur la maintenance de nos outils. Nous allons encore plus loin, et formons des formateurs locaux, en leur donnant les moyens et les capacités de former des utilisateurs sans notre implication – un facteur clé pour une utilisation durable des ressources avec un impact significatif sur l’appropriation.
Madagascar gère sa PGA de manière indépendante depuis près de 10 ans, et reste l’un de nos meilleurs pays en termes de processus et de résultats. Au cours de ces 10 années, l’équipe PGA de Madagascar a également subi quelques changements, les membres étant nommés à différents postes. Le processus de mise en œuvre a été adapté au renforcement durable des capacités d’une équipe complète. Ainsi, la rotation du personnel a eu un impact minime et le processus PGA reste hautement viable.
Les leçons sur la mise en œuvre des projets
Les politiques et stratégies nationales, y compris celles qui gèrent la divulgation des données, sont parfois incomplètes ou peu claires. Si elles sont bien rédigées, leur application dans le pays se heurte à certains défis. Nos rencontres préalables, avec les principales parties prenantes d’un secteur, aident énormément la mise en œuvre de nos projets en donnant à notre équipe un aperçu de la valeur ajoutée que notre expertise – collecte et publication de données; science des données; utilisation des données dans les processus décisionnels – peut apporter au secteur. Nos concepts sont essentiellement basés sur les besoins exprimés par les parties prenantes, qui participent aussi activement à la validation des exigences via notre processus de co-design, avant de nous engager dans le développement des outils.
DG a développé un outil de collect de données EI pour l’Initiative pour la Transparence des Industries Extractives du Nigéria (NEITI) pour rationaliser le processus annuel de réconciliation et réduire les délais constatés dans la publication des informations. Le processus a commencé par une évaluation technique initiale de leur processus d’audit actuel. Il s’en est suivi des sessions de travail conjointes sur les modules et fonctionnalités à inclure dans l’outil pour mieux soutenir le flux de travail et arriver à la rationalisation recherchée. DG et NEITI ont rédigé, ensemble, les exigences techniques avant le développement de l’outil. NEITI a également été impliquée dans chaque itération de développement de l’outil pour fournir des commentaires supplémentaires et améliorer la fonctionnalité.
L’adhésion des parties prenantes est crucial dans la mise en œuvre de nos projets. Allons plus loin – avoir un partenaire local fiable est important pour plus de résilience dans les projets, en particulier dans les secteurs sensibles ou politiques. Par exemple, certains de nos projets ont été bloqués en raison d’instabilité politique, de changements de gouvernement ou même d’initiatives similaires mises en œuvre par un autre ministère ou par une autre division au sein du même ministère. Pouvoir compter sur un partenaire local s’est avéré très efficace pour renforcer la durabilité et la stabilité tout en essayant de faire avancer le projet même compte tenu des obstacles sur lesquels la DG a très peu de contrôle.
Après avoir installé la PGA au Niger et entamé le processus de viabilité de la plateforme, le pays a connu une vague d’instabilité politique. L’équipe, et le projet, sont restées inactives pendant quelques années avant de contacter DG pour relancer le processus au niveau national.
Les leçons tirées des défis
Lorsque nous travaillons avec les gouvernements plusieurs membres du personnel considèrent tout outil informatique comme synonyme de tâche supplémentaire et peuvent s’attendre à certains avantages tels que des voyages de renforcement des capacités ou de nouveaux équipements. Parfois, lorsqu’ils se rendent compte que nos projets n’incluent pas ces éléments, on sent une certaine démotivation de l’équipe qui se traduit par un ralentissement de nos activités. DG a appris qu’il est important de faire participer l’équipe complète dès le début du projet: cela favorise l’appropriation au niveau national et contribue à la durabilité des outils, car un plus grand nombre d’équipes locales profitent de la formation initiale et du renforcement des capacités.
DG a identifié d’autres facteurs de motivation tels que la participation de nos partenaires – et leur implication – à l’atelier annuel des bonnes pratiques PGA, ou des visites d’échange. D’autres mesures peuvent être inclure l’achat de clés Internet locales sur le long terme ou l’organisation d’ateliers externes de collecte/validation de donnée. Les équipe projet de DG ont appris à mettre l’accent sur les avantages liés à la mise en place d’un outil notamment le gain considérable de temps – un tâche qui nécessitait plusieurs semaines de travail, peut être accomplie en quelques minutes ou en quelques heures,
Dans le cadre du programme Des Chiffres et Des Jeunes (DCDJ), DG a formé et placé des Data Fellows pour des stages en science des données dans toute la Côte d’Ivoire. Les Fellows ont élaboré des outils de données en fonction des besoins de leur organisation hôte; par exemple, un Fellow a créé un outil de compilation de données a permis au Programme National de Lutte contre le Sida (PNLS) de réduire le temps nécessaire pour compiler les données des rapports d’une semaine à quelques minutes.
Que faisons-nous avec tout ce qu’on apprend?
Dans les pays où j’ai eu l’opportunité de travailler, j’ai remarqué qu’ils sont rarement au stade zéro. Ils ont déjà posé les premiers jalons, mais pourraient freinés par des changements organisationnels, opérationnels ou institutionnels.
Dans les pays où je me rends, j’essaie de trouver le maillon faible de la chaîne avant d’évaluer la meilleure façon d’améliorer et de soutenir les efforts de nos partenaires.
Cette approche est applicable à tous les secteurs tant qu’ils partagent notre vision: promouvoir la prise de décision fondée sur des preuves, et accroître la transparence et les mécanismes de responsabilité au niveau des pays, grâce à des informations faciles à comprendre et à utiliser.
En 2018, OSIWA a soutenu des efforts de recherche de DG au Sénégal, en Guinée et au Nigéria, pour déterminer la faisabilité et la pertinence d’y installer des portails nationaux comme outils de collecte de données. À mi-chemin de l’évaluation, c’était comme si nous avions quelques années de retard – les besoins des acteurs non-étatiques avaient évolué vers leur volonté de disposer de données sur l’impact des industries extractives, au-delà de la simple transparence sur les flux financiers. Les parties prenantes, en particulier les acteurs non-étatiques, veulent accéder à des informations qui déclencheront des débats sur les impacts socio-économiques et environnementaux des activités de l’industrie extractive – pour protéger les intérêts nationaux et autonomiser l’exploitation minière. communautés affectées. Notre objectif principal est devenu secondaire et notre recherche s’est concentrée sur la mise en évidence des défis et des demandes exprimés en matière de données. Une fois terminé, nous avons partagé nos conclusions sur leurs besoins en données au niveau mondial et avec les communautés de donateurs, ce qui, nous l’espérons, aidera à mieux soutenir les acteurs non étatiques dans leur quête de plus de transparence.
Conseils pour faire progresser l’apprentissage
- Connaître le contexte – y compris les opportunités et les défis; partenariat avec des organisations locales fortes; connaître et soutenir les normes internationales au niveau national; et la présentation de solutions concrètes a aidé DG à comprendre comment écouter d’abord, et seulement ensuite à fournir des suggestions sur la façon dont nous pouvons travailler ensemble pour obtenir des résultats.
- Démontrer les avantages – tout en étant très conscient des inconvénients – et proposer des mesures d’atténuation permet d’élever le niveau d’intérêt d’un partenaire.
- Faire preuve de flexibilité et d’ouverture rassurera les partenaires sur votre résilience, surtout lorsque nous soulignons l’importance des capacités locales. Cette valeur transformera toute discussion générale en une discussion constructive, conçue pour soutenir des initiatives dans une variété de secteurs dans de nombreux pays du monde.
Share
Related Posts
Turning 20 in 2020…
As we look forward to DG’s next decade, which coincides with the end of the 2030 SDG era, the tumult of the present, together with our core identity and skills, point us to several opportunities to contribute to a more hopeful future. We are looking forward to working with our partners in making DG’s 3rd decade our most ambitious and successful one yet.
Who Are We Now?
Over the last twenty years, DG has morphed into a global organization with location-based personnel across the world. Where are we now? Who is Development Gateway and what do we prioritize?
20 Years of Lessons Learned
DG has been shaped by 20 years of lessons learned through assessments, implementations, and challenges. These lessons have helped to evolve our approach, influenced our policy perspective, and supported continuous growth & innovation.
20 Years of Lessons Learned
Vanessa Baudin Sanchez is DG’s Regional Project Manager for West Africa, based in Senegal. Vanessa started with DG in 2008 as a technical analyst. Through her time at DG, Vanessa has been an important link connecting lessons learned through project implementation and application for our work. Here she highlights some of the most important lessons DG has learned through the programs she has implemented, and how they shaped the organization we are now.
Cliquez ici pour lire cet article en français.
Learning Shapes Our Work
My first task at DG was to assess and redesign our partner’s network in Burundi to provide AMP users with a comfortable Internet connection. I remember this day like it was yesterday – our early AMP implementations, the glitches, the bugs, and the Java exceptions we faced while in-country and right in the middle of our presentations! Since then, AMP implementations have significantly improved. And as additional modules and functionalities were developed based on partner feedback, the system almost perfectly matches their needs. In addition to developing tools based on both our agile processes and existing partner operational processes, we have also responded to the low bandwidth challenges in the majority of our partner countries by offering an offline version. As we improved AMP usability over the years, we also improved our methodology and approach to streamline its in-country implementation, reducing costs, and favoring a participatory approach throughout the project cycle.
The AMP was our leading system at the time I joined DG. The lessons we’ve learned from developing new features to better support our partners have helped us rethink our approach and expand our work to sectors outside of aid management. We asked ourselves, “what other sectors could also benefit from more data disclosure and use?” When we begin a new project or shift focus to a new sector, we start with an in-country assessment (my favorite stage!). The assessments in which I have participated have been – and continue to be – the best learning experiences for the project team. During this time, we meet all stakeholders. Very often, our partner countries have already started taking action towards improving their data collection and disclosure, so we ask, “how can we help you?” – recognizing their work, jointly assessing their current challenges and building on those findings, sharing lessons learned, examples, best practices, and recommendations that will be tailored to their particular context.
We ask our partners to evaluate us so we can do better next time. I feel that while we remain true to our mission and our core values, our methodologies keep improving mainly because of the constructive feedback we receive both internally and externally. This allows us to deliver, 20 years on, tools that help our clients meet their strategic objectives.
When DG launched the WIM Index, participants shared feedback that would impact our methodology if we were to replicate this exercise in the future: when trying to assess feedback, we try to assess positive feedback as well as negative to confirm the neutrality of the tool and get more stakeholder buy-in.
Lessons about Technology
Technology seems to always scare non-technical actors who question its relevance, its usability but mostly, its sustainability. Their reluctance is more than understandable when they share with you the number of systems that have been implemented and then shelved for many years. While it is difficult for any organization to claim that our tools will continue to be used when other systems are put aside, we are in the position today to say that our approach prioritizes sustainability over time. How do we do this?
- To remain useful, we have learned that our tools need to be flexible and scalable: DG works with progressive international standards (e.g. IATI, EITI, OCDS) and supports their implementation at the country level. The same is true if national policies shift during implementation, DG’s support can adapt as well. As such, scalability and flexibility are two key factors included in the early part of DG’s approach to technical development, allowing them to adapt quickly to new demands and new requirements and stay in the game!
- Two reasons are often given as to why IT systems go unused: First, licensing costs that end up being too expensive for organizations, and second the lack of local capacities to maintain and sustain a system over time. DG resolved the cost issue as our tools are developed on open-source software, free of licensing fees. For part two, we make it a point to train and build local capacities on the maintenance of our tools as well as its usage. We also take it even further and train local trainers, empowering them to train users without DG’s involvement – a factor key to sustainable utilization of resources with a significant impact on ownership.
AMP Madagascar has independently managed their AMP for almost 10 years and still remains one of our strongest AMP partner countries in terms of processes and results. During those 10 years, the Madagascar AMP team also underwent some changes as members were appointed to different positions. Because the implementation process was tailored to sustainable capacity building of a full team, changes in staffing have had a minimal impact as the AMP process in-country is still highly viable.
Lessons about Project Implementation
National policies and strategies, including the ones managing public data disclosure, are sometimes incomplete, other times unclear, or they are well written but their application and enforcement in the country can face challenges. Meeting key stakeholders in a sector has greatly helped our project implementations by giving our team insights on the added value of our expertise – data collection and dissemination, and data science and data use in decision-making processes – can bring to the sector. As such, our designs are based on stakeholders’ expressed needs and they actively participate in requirements validation through our co-design process before we engage in tool development.
DG developed Nigeria Extractives Industry Transparency Initiative (NEITI)’s data collection tool and the process started with an initial assessment of their current audit process. After, joint working sessions on the modules and functionalities to be included in the tool to better support workflow and streamlining were held. Together, DG and NEITI wrote the technical requirements prior to tool development. NEITI was also involved in each iteration of tool development iterations and was able to provide additional feedback to improve the functionality.
Stakeholder buy-in has been crucial in our project implementations. One step further – having a reliable local partner is sometimes important to project resilience, especially in sensitive or political sectors. For example, some of our projects were stalled because of political instability, government changes, or even similar initiatives being implemented by another ministry or even another division within the same ministry. Being able to rely on a local partner has proven to be very efficient in building sustainability and stability and trying to advance the project even given obstacles DG has little control over.
After installing AMP in Niger and working jointly for several years, the country experienced a wave of political instability. The team remained inactive for a few years before they contacted DG to re-launch the process.
Lessons Learned from Challenges
One thing that is almost always a challenge when working with governments is that some staff see any IT tool as an additional task, and they might expect additional benefits such as capacity building trips or equipment as incentives to learn and use the tool. At times, when they realize that our projects do not always include these benefits, there is a demotivation from the team, and activities are slowed down. However, DG has learned that training locally with the full team has huge advantages: it supports fuller in-country ownership and contributes to tool sustainability, as larger numbers of the local teams can take advantage of the initial training and capacity building.
We have learned that motivation can still include cross-country learning and participation in DG’s semi-annual AMP workshop, study tours, and exchange visits. It can also include purchasing internet keys for the project and organizing data collection/validation exercises and workshops outside of the office. Additionally, we’ve learned to highlight the time-saving benefits of an information management tool like AMP are significant motivators themselves – DG’s tools mean that what used to take several individuals weeks of administrative work now takes just a matter of minutes or hours.
As part of the Des Chiffres et Des Jeunes (DCDJ) program, DG trained and placed Data Fellows in data science internships throughout Cote d’Ivoire. Fellows built data tools based on their host organization’s needs; for example, one time-saving data compilation tool that a Data Fellow built enabled the National AIDS Control Program (PNLS) to reduce the time it took to compile report data from over a week, to a matter of minutes.
Where Does Our Learning Go?
In the countries in which I have been given the opportunity to work, I have noticed that they are rarely at stage zero. They have been working to put the pieces together, but might be struggling with organizational, operational, or institutional changes – these are pretty similar in countries regionally.
After realizing this, I now go to countries to find the missing link, and to assess how best to improve and support our partners’ existing efforts. This approach is applicable to all sectors as long as they share our vision: to promote evidence-based decision-making processes, and to increase transparency and accountability mechanisms at the country level, through information that is easy to understand and use.
In 2018, OSIWA supported research in Senegal, Guinea, and Nigeria to determine the feasibility and relevance of implementing country portals as data collection tools. Partway through the assessment, our main objective rapidly shifted. It was as if we were a few years late – non-state actors expressed the need to have data on the impact of extractive industry, beyond just transparency on the financial flows. Stakeholders want to access information that will trigger debates on socio-economic and environmental impacts of extractive industry activities – to protect national interests and empower mining-affected communities. Our main objective became secondary, and our research focused on highlighting their expressed data challenges and demands. Once completed, we shared our findings about their data needs at the global level and with donor communities, which we hope will help better support non-state actors in their quest for more transparency.
Tips for Taking Learning Forward
- Knowing the context – including the opportunities and challenges; partnering with strong local organizations; knowing and supporting international standards at the country level, and showcasing real-life solutions has helped DG understand how to listen first, and only then provide suggestions on how we can work together to achieve results.
- Demonstrating the pros – while being very aware of the cons – and proposing mitigation measures helps raise a partner’s interest level.
- Showing flexibility and openness will reassure partners of your resilience, especially when we emphasize the importance of local capacity. This value will turn any general discussion into a constructive one, tailored to support initiatives in a variety of sectors in many countries globally.
Share
Related Posts
Turning 20 in 2020…
As we look forward to DG’s next decade, which coincides with the end of the 2030 SDG era, the tumult of the present, together with our core identity and skills, point us to several opportunities to contribute to a more hopeful future. We are looking forward to working with our partners in making DG’s 3rd decade our most ambitious and successful one yet.
Who Are We Now?
Over the last twenty years, DG has morphed into a global organization with location-based personnel across the world. Where are we now? Who is Development Gateway and what do we prioritize?
20 ans de leçons apprises
DG a été façonné par 20 ans de leçons apprises à travers les évaluations, les mises en œuvre et les mesures d’atténuation pour faire face aux défis. Ces leçons ont contribué à faire évoluer notre approche, à influencer notre perspective stratégique et à soutenir l’innovation continue.
Understanding Stakeholder Needs: Extractives Industry Data Portal Assessment in West Africa
Starting in June 2018, in partnership with Open Society Initiative for West Africa (OSIWA), DG assessed the extractive industry (EI) data landscape in Senegal, Nigeria, and Guinea. The goal was to determine the feasibility of designing and implementing an Extractives Industry Data Portal (EIDP) for each country, the initial objective of which would be to reduce reporting delays in Extractive Industry Transparency Initiative (EITI) annual reports. These delays could be up to two years for some countries.
This assessment followed initial work developing a website and portal for the Extractives Industry Transparency Initiative (EITI) International Secretariat. It included an in-depth study of each country’s legal and institutional frameworks, readiness to open up EI data; an analysis of activities of actors in the sector and their willingness to promote open data use, and a review of human and technical capacities for sustainable implementation. The assessment methodology included desk research to understand the specific country context, followed by one-on-one interviews with stakeholders in the government, private sector, and community service organizations.
Findings
One major finding is that countries are at the stage now where collecting data on the EI financial flows is no longer enough. The stakeholders, and especially the non-state actors, want information that will help them advocate for protecting the environment of the neighboring communities, make sure that the kids have proper educational services, and that the communities have access to health facilities. These assessments changed our perception of the need for national portals. At first, we envisioned a simple data collection tool, but now we understand that these tools need to be more advanced. They need to be able to measure the impact on communities well being in general, highlighting the obstacles, challenges, priorities, and the areas that could be improved.
Share
Related Posts
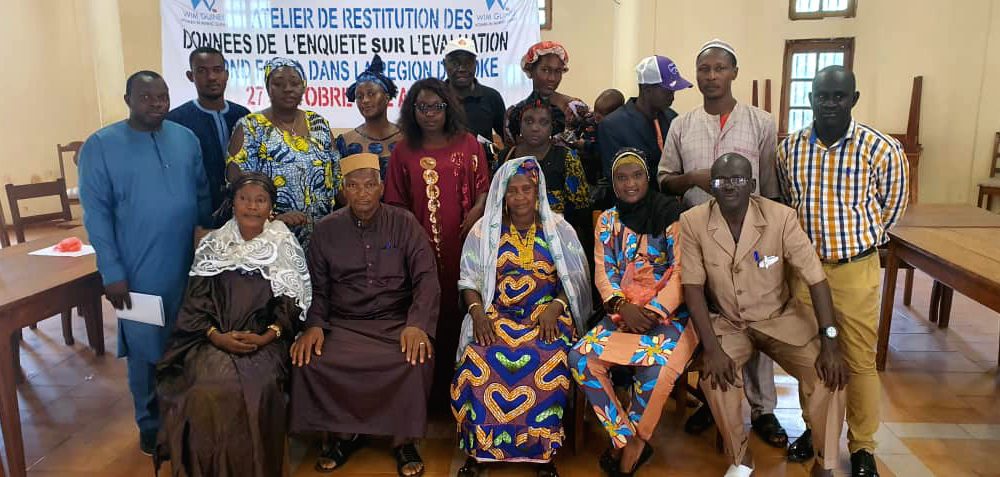
Les Fonds FODEL : Un appui aux femmes des es communautés minières avec WIM Guinée
Nous avons organisé un atelier de validation avec notre partenaire de mise en œuvre, Women in Mining (WIM) Guinea dans la région de Boké le 22 octobre 2022 pour confirmer les résultats d'une collecte de données conduite par WIM Guinée dans les sous-préfectures minières de Boké et Boffa. Les données ont révélé des améliorations potentielles des fonds de développement économique local (FODEL) et de leur administration qui, si elles sont mises en œuvre, pourraient permettre davantage aux femmes et aux associations de femmes des communautés minières de capitaliser sur ces fonds et de mieux les utiliser pour soutenir leur développement local.
FODEL Funds: Supporting Women in Mining Communities with WIM Guinea
DG and our implementing partner, Women in Mining (WIM) Guinea, held a validation meeting in the Boké region of Guinea on October 22, 2022 to confirm the findings of a data collection initiative that WIM Guinea conducted in the country’s Boké and Boffa mining subprefectures. The data revealed potential improvements to local economic development funds (FODEL) and their administration that, if implemented, could further enable women and women's associations in mining communities to capitalize on these funds and better use them to support their local development.
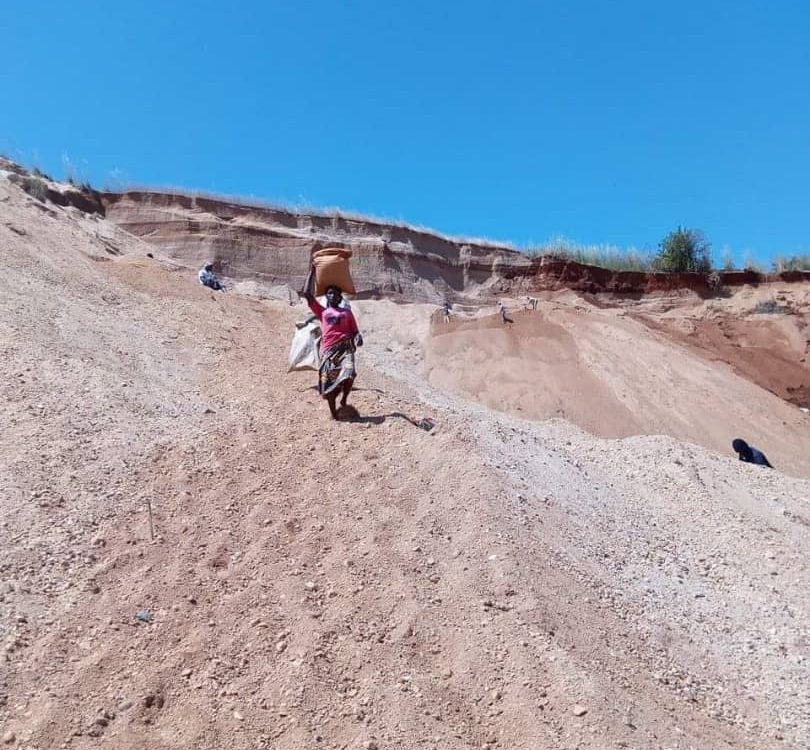
Une réflexion sur les données des IE
Au cours des dernières années, DG a intensifié sa recherche dans le domaine des industries extractives (IE) en Afrique de l'Ouest, ce qui a permis de mieux cerner les lacunes en termes de données et d'identifier les opportunités du secteur. Nous avons constaté que les informations disponibles au grand public sont principalement axées sur la transparence des flux financiers et ciblent la scène internationale, mais occultent les facteurs non-financiers et l'impact local réel de l'industrie. Une question reste en suspens : comment promouvoir la divulgation de données susceptibles d'appuyer les communautés impactées par les activités extractives ?