
Building an Efficient Database to Improve Data Use in Côte d’Ivoire
This post originally appeared as Building an Efficient HIV/AIDS Database for Improved Data Use in Côte d’Ivoire on the DCLI website, which can be found here.
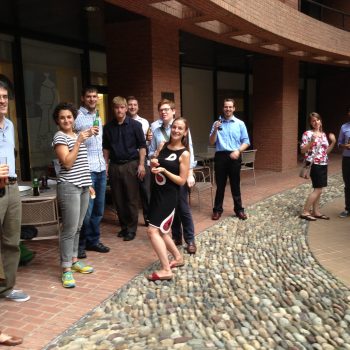
A Data Fellow placed with the National AIDS Control Program (Plan National de la Lutte Contre le SIDA/VIH, PNLS), the government agency that coordinates the national response to the HIV/AIDS crisis in Côte d’Ivoire, Ali Diakité, built a solution that noticeably improved the PNLS process efficiency and data quality. As the primary HIV/AIDS control program in Côte d’Ivoire, PNLS uses the tool to make direct improvements to its data quality, timeliness, and epidemic response.
Background
Des Chiffres et Des Jeunes (DCDJ) aims to bolster the subnational supply and usage of data for citizens of Côte d’Ivoire, engage youth as champions of these services, and fuel innovation to address rising data and information needs. Through the DCDJ Fellowship Program, Ivorians between 18 and 34 years old spend two months in intensive data science and analytics training. Following the training, Fellows are placed in internships to support their hosting organizations in making data-informed decisions. DCDJ (Des Chiffres et Des Jeunes) is a project of the Data Collaboratives for Local Impact (DCLI) program, a partnership between PEPFAR and the Millennium Challenge Corporation (MCC) that aims to increase expertise and resource availability in Côte d’Ivoire.
The National AIDS Control Program (Plan National de la Lutte Contre le SIDA/VIH, PNLS) is the government agency that coordinates the national response to the HIV/AIDS crisis in Côte d’Ivoire. PNLS is responsible for collecting and reporting logistical and clinical data from 33 regions and 113 districts, as well as creating and executing the National Strategic Plan (Plan National du VIH/SIDA, PNS) to fight HIV/AIDS, which is the national roadmap for the next five years of Côte d’Ivoire’s epidemic response.
Ali Diakité is an alumnus of the first cohort of the DCDJ Fellowship program. Ali holds a degree in statistics from Ecole Nationale Supérieure de Statistique et d’Economie Appliquée d’Abidjan (ENSEA). After the training, Ali was placed in an internship at PNLS, to support their efforts in confronting the HIV/AIDS crisis in Côte d’Ivoire. A year later, Ali has been able to implement and sustain a new data collection tool to ease PNLS’ slow data aggregation and use process.
A Lack of Timely, High-Quality Data
Despite the wealth of data reported to PNLS, department heads lacked access to timely, high-quality data for policy and program decision making. During stakeholder interviews within PNLS, Ali learned that the lack of standardized data formats made compiling the reported logistical and clinical data a time-consuming and error-prone process. Inconsistent categories and Excel table headers from different clinics and pharmacies had to be hand-reconciled into one consolidated data set. Without interoperable data formats, data quality suffered, and compiling the data took ten individuals over a week of work. Then inconsistent data would be sent back to the districts for corrections and the process would start again from the beginning. The time- and resource-intensive data compilation and correction process meant some of the data could be up to a year old. Finally, even if the data was more accurate, the data was stored in a series of spreadsheets, which made analysis more difficult without a statistician on staff at PNLS. PNLS was making decisions and setting long-term strategies based on suboptimal, sometimes outdated, data. Ali explained, “The problem was really having access to the data quickly. They weren’t even dealing with analysis or visualizations – their first challenge was getting the data. So we wanted to address the root causes of the problem.”
Developing a Solution
Ali used the Python skills and other resources gained during the Data Fellowship training to develop an efficient data compilation tool for PNLS. Ali’s program gathers data from a variety of heterogeneous datasets and compiles it into a standard format in a single homogenous database in a matter of minutes. During the automatic compilation process, the tool also completes data quality checks. In the final stages, data is provided to users in an easily digestible format.
Before creating the tool, Ali researched the data ecosystem of PNLS. With a more complete understanding of the reporting and compilation process, Ali considered several solutions. A Python based solution was the best fit as it automated and accelerated the data compilation process. The tool was created to systematically format comparable data, and simultaneously check cells for accuracy. For example, if a clinic reports treating 30 patients, but also reports that 36 of the patients were male, the tool automatically alerts PNLS of the reporting error.
Impacts for PNLS & Ali
The Python-based program has drastically reduced the amount of time and number of staff necessary to compile data from reports. Before, ten PNLS staff members would manually check each cell of data reported by clinics and pharmacies in 33 regions and 113 districts, a process that could take more than a week. Now, the Python program completes the entire process quickly and automatically in a matter of minutes. After the compilation process, PNLS staff now access and analyse one unified file in a single, accurate format referred to as the National Database. Previously, even though data was compiled every quarter, the slow processing time sometimes meant analyzing data that was six or nine months old. Now that the Python program has automated the process, data is from the previous one or two months, which makes it significantly more relevant. . Ali began his evaluation and work on a solution in January 2019, by May 2019 the python program was introduced organization-wide, and continues to be in use today. Ali has trained several of his colleagues at PNLS to use, maintain, and update the Python program so that it will continue to be useful in the future.
On an organizational level, more accurate and timely data gives PNLS a better understanding of the realities of HIV/AIDS in Côte d’Ivoire. Before, the organization was relying on out of date data and information. As a result, PNLS had miscalculated how many HIV/AIDS patients it was treating and could not understand why the numbers of patients being treated did not match with the significant interventions taking place. But with data compiled from the Python program, PNLS could see the actual numbers, correct inaccuracies, and understand the true impact.
The PNS currently under development draws heavily on data processed by Ali’s program. Ali said, “I was really honored to be involved in these discussions that international experts also attended. It was a moment of pride for me to see that such an important document for the fight against HIV/AIDS is being developed based on data I helped obtain through the solution that I built.”
The deployment of Ali’s solution noticeably improved the PNLS process efficiency and data quality. PNLS uses the tool to make direct improvements to its data quality, timeliness, and epidemic response. In addition, PNLS extended Ali’s contract beyond the length of the Data Fellowship. Using the wealth of knowledge he acquired as a DCDJ fellow, Ali now has the resources to take his career far beyond what he might have imagined before graduating from University.
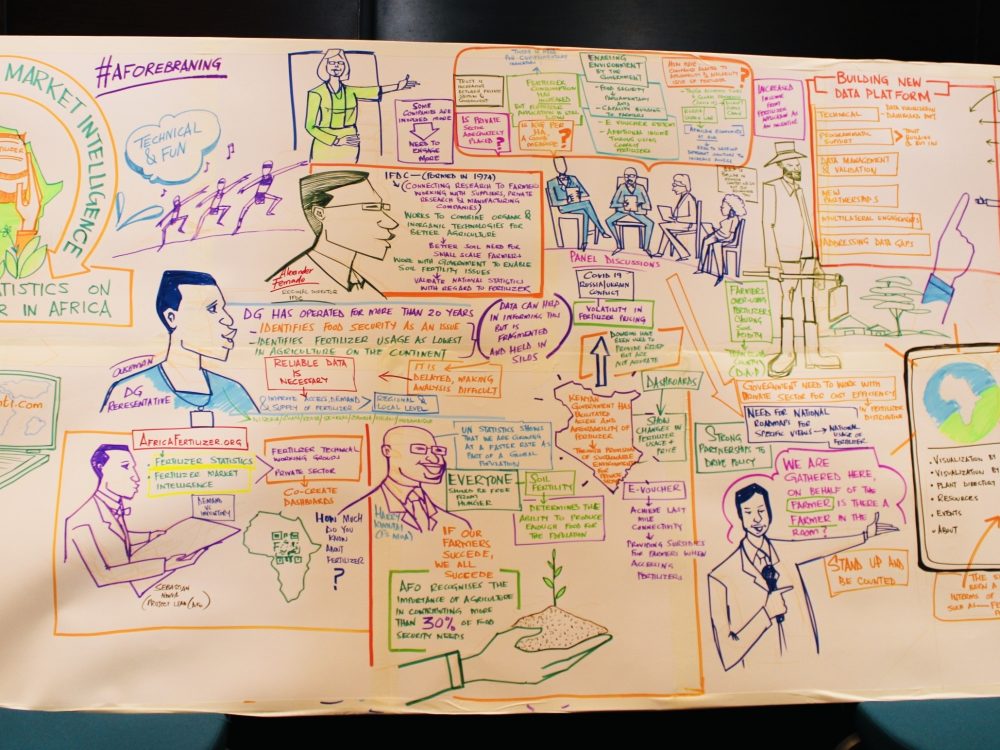
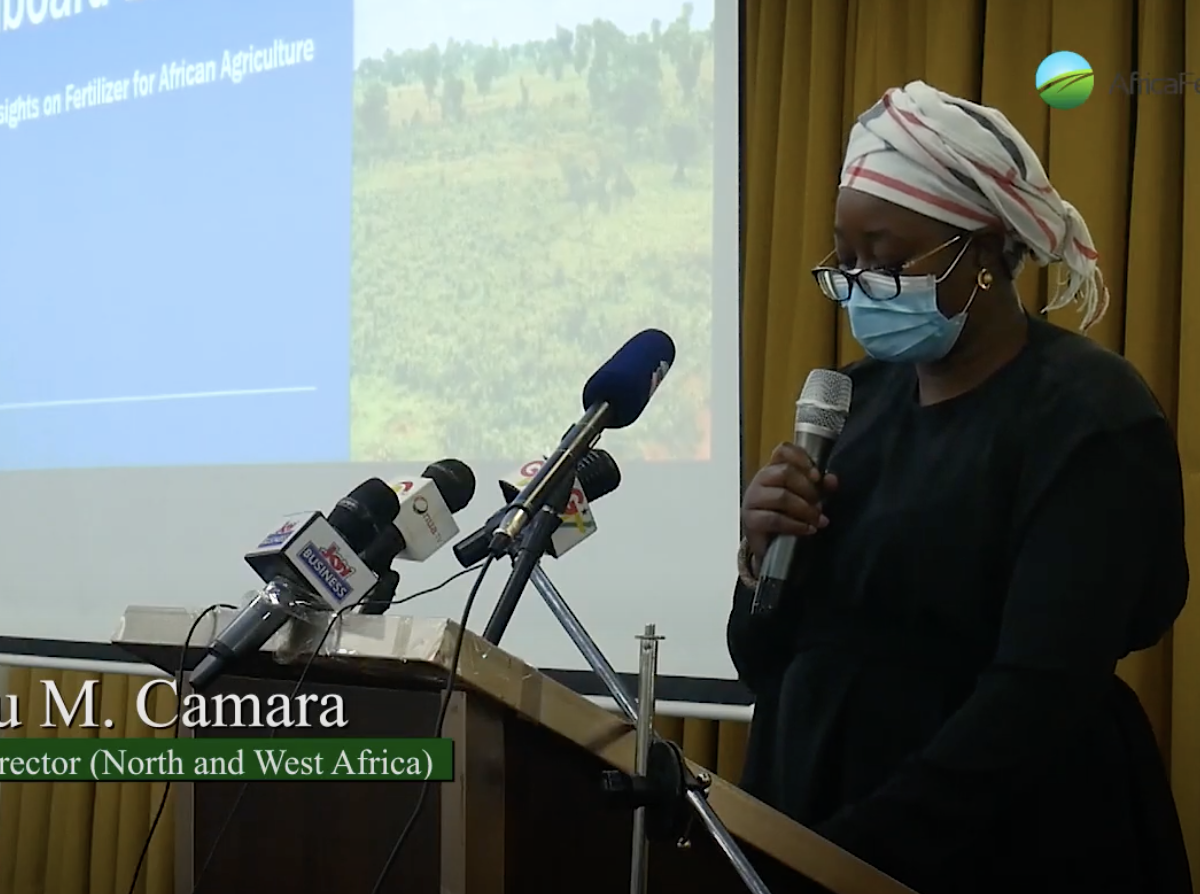
Measuring COVID-19’s Impact on the Fertilizer Sector in Sub-Saharan Africa
In an effort to support food security, a new dashboard tracks country-specific mitigation measures, from economic responses to the availability of fertilizer stocks in 28 countries in sub-Saharan Africa. This is a joint press release from Development Gateway, AfricaFertilizer.org, International Fertilizer Development Center, The African Fertilizer and Agribusiness Partnership, and AFRIQOM.
Nairobi – Today, The COVID-19 Africa Fertilizer Watch Dashboard, covering 28 countries across sub-Saharan Africa was launched. This dashboard uses 11 indicators to track COVID-19 country-specific mitigation measures on the delivery and use of fertilizers to identify impacts on productivity and food security across the continent. The goal of this dashboard is to support development partners’ and the private sector’s efficient and effective responses to the evolving global health emergency, and ensure that sufficient quantities of appropriate fertilizers reach farmers in time for planting.
Sub-Saharan Africa (SSA) has the lowest fertilizer usage in the world – insufficient to replace soil nutrients lost every year to crop production. In addition, huge demographic shifts in SSA could have major impacts on food security. Combined with new COVID-19 lockdown policies, understanding where and how barriers to distribution are impacting farmers is crucial for agricultural productivity.
The dashboard was developed through a partnership between the International Fertilizer Development Center’s (IFDC) AfricaFertilizer.org initiative, the African Fertilizer and Agribusiness Partnership (AFAP), Development Gateway, and AFRIQOM.
The fertilizer sector has been lucky that most ships were in the seas when COVID-19 hit so product was already moving for this growing season in Africa. But as lockdowns and other impacts continue, we will need to monitor these indicators; countries likely won’t feel the full impact until the next growing season.
The Dashboard
The COVID-19 Africa Fertilizer Watch Dashboard is publicly available online. This dashboard uses 11 indicators such as price, availability, port operations, domestic transport, and government mitigation measures to track and visualize COVID-19’s impact on access and use of fertilizers across Africa. It also includes the impact of the COVID-19 pandemic on the population (overall and calculated trend over previous 14 days); the government/public measures taken (health and economy); and fertilizer-specific measures and/or logistical issues affecting movement of fertilizers from ports to farms (ports, roads, borders, retail, stocks and sector-wide responses).
Data on COVID-19 cases comes from https://covid-api.com/, an API based on public data from the Center for Systems Science and Engineering (CSSE) at Johns Hopkins University. The data repository is updated daily, and its full list of data sources are detailed there. The COVID-19 Africa Fertilizer Watch checks this system periodically for confirmed cases in each of the dashboard’s 28 supported countries, updating the “COVID-19 Trend” indicator as new data is available. More information about the methodology can be found on the COVID-19 Africa Fertilizer Watch website.

The Partnership
The project grew out of an existing partnership between AfricaFertilizer.org and Development Gateway, who have been working on the Visualizing Insights on Fertilizer for African Agriculture (VIFAA) program supported by the Bill & Melinda Gates Foundation. VIFAA is designed to holistically address the supply, demand, and use of fertilizer data at both country and regional levels through dashboards and visualization tools. As the COVID-19 pandemic evolved, VIFAA began building on the West Africa Fertilizer Watch and East & Southern Africa COVID-19 Fertilizer Watch bulletins developed by IFDC and supported by AFAP and AFRIQOM.
AfricaFertilizer.org (AFO) – the premier source for fertilizer statistics and information in Africa. It is hosted by IFDC and supported by several partners, key among them being the International Fertilizer Association (IFA), Argus Media, and Development Gateway via the VIFAA program. Since 2009, AFO has been collecting, processing, and publishing fertilizer production, trade, and consumption statistics for the main fertilizer markets in sub-Saharan Africa. AFO has an extensive network of fertilizer industry players in the main fertilizer trade corridors and maintains key information on the major producers, their production facilities and capacities, importers/suppliers, and various distribution channels.
The African Fertilizer and Agribusiness Partnership (AFAP) – is an independent non-profit organization founded in 2012 by a partnership of African development organizations. It was built on the work of the Comprehensive African Agriculture Development Program (CAADP), a framework for achieving ambitious agriculture development goals set in place by African nations and leaders. AFAP implements sustainable development projects and advises public, private sector clients, NGOs, and donors on policies and market-driven business solutions in the agriculture inputs and agribusiness value chain. AFAP is a technical partner on the COVID-19 Africa Fertilizer Watch, conducting impact assessments of the pandemic on the Agrodealer business.
Development Gateway: An IREX Venture (DG) – provides data and digital solutions for international development. DG creates tools that help institutions collect and analyze information; strengthen institutional capability to use data; and explore what processes are needed to enable evidence-based decisions. A mission-driven nonprofit since 2000 with staff based in five global hubs and around the world, DG supports the use of data, technology, and evidence to create more effective, open, and engaging institutions. DG developed the dashboard for the COVID-19 Africa Fertilizer Watch, and is the lead implementer of the four-year Visualizing Insights on Fertilizer for African Agriculture (VIFAA) program.
International Fertilizer Development Center (IFDC) – As an independent non-profit organization, IFDC works throughout Africa and Asia to increase soil fertility and develop inclusive market systems. Combining science-backed innovations, an enabling policy environment, holistic market systems development, and strategic partnerships, the organization bridges the gap between identifying and scaling sustainable agricultural solutions, resulting in improved household food security and enriched family livelihoods around the world. Using an inclusive approach, IFDC employs locally driven solutions that are environmentally sound and impact oriented that bring change at local, regional, and national levels. IFDC implements the USAID-funded Bureau for Resilience and Food Security Feed the Future project on Soil Fertility Technology Adoption, Policy Reform, and Knowledge Management (RFS-SFT). The project bridges the gap between scientific research and technology dissemination to smallholder farmers. RFS-SFT conducts research with partners from universities, national and international research and development institutions, and the private sector.
AFRIQOM – is an independent privately held firm that provides market research, analytics, trading intelligence and consultancy studies with a focus on African fertilizer markets. By doing so, and being the leaders in the continent, AFRIQOM brings transparency to an opaque market to help and contribute to Africa Green Revolution motion. AFRIQOM has recently launched AFRIQEVENTS program, in partnership with major associations, for conferences around the continent offering a novel platform to develop the fertilizer consumption rate in Africa.
VIFAA Going Forward
In November 2022, AfricaFertilizer (AFO), our partner on the Visualizing Insights on Fertilizer for African Agriculture (VIFAA) program, rebranded and launched a new website. This website includes the integration of country-specific VIFAA dashboards, which were previously housed in separate websites. By integrating the country-specific dashboards as well as fertilizer data on trade, production, consumption, and retail prices for 18 countries in sub-Saharan Africa, the new AFO data allows easier comparative analysis across countries and contributes its quota to the advancement of food security throughout Africa.
We have updated the previous country-specific dashboards links to now redirect you to AFO’s new website in order to ensure you are accessing the most up-to-date resources.
Share
Related Posts
From Data Gaps to Impact: Key Insights from the VIFAA Program
Over the last six years, DG, together with its partners AfricaFertilizer (AFO) and Wallace & Associates, collaborated to implement the Visualizing Insights on Fertilizer for African Agriculture (VIFAA) Program. In the program’s final year (2024), the team undertook a “program learning process” to reflect on outcomes, challenges, and successes through internal interviews. This blog captures five key learnings, which we hope will guide similar programs aiming to bridge data gaps in agricultural development.
Case Study: Fostering Sustainable Agriculture through Data-Driven Collaboration and Partnership: Ethiopia, Mozambique, and Nigeria
Through DG’s Visualizing Insights on Fertilizer for African Agriculture (VIFAA) program, we recently published a case study titled “Fostering Sustainable Agriculture through Data-Driven Collaboration and Partnership: Ethiopia, Mozambique, and Nigeria.” It dives deep into how the VIFAA program has impacted the fertilizer data and markets in Ethiopia, Mozambique, and Nigeria. In this blog, we explore the overall impact that the VIFAA program is making, why the program was needed, and offer some key highlights from the case study.
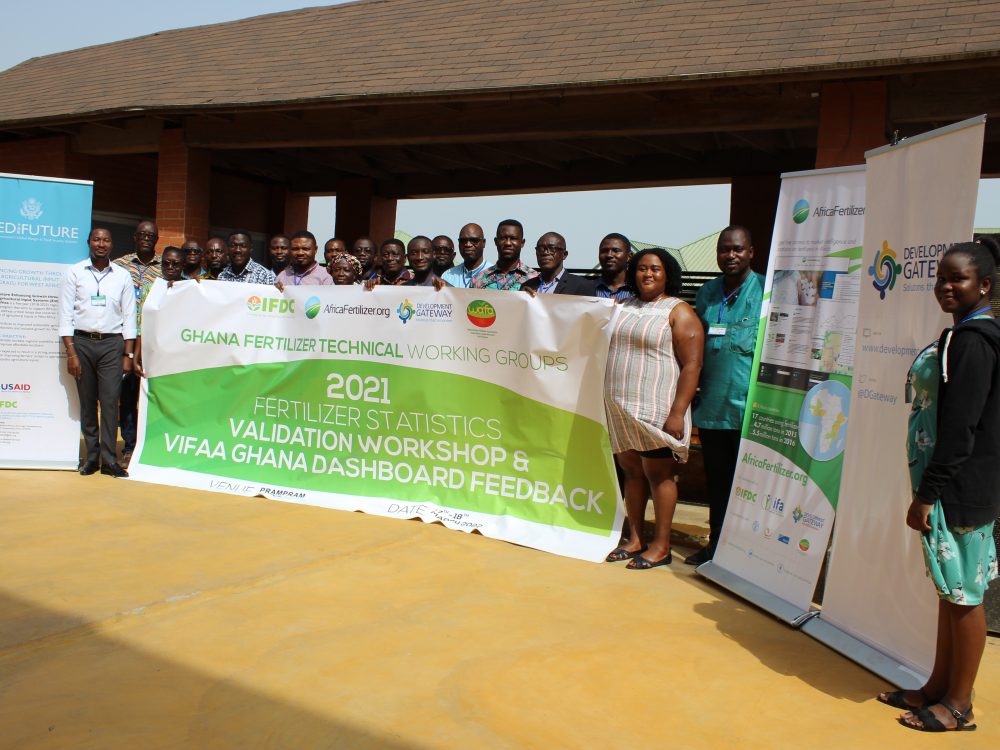
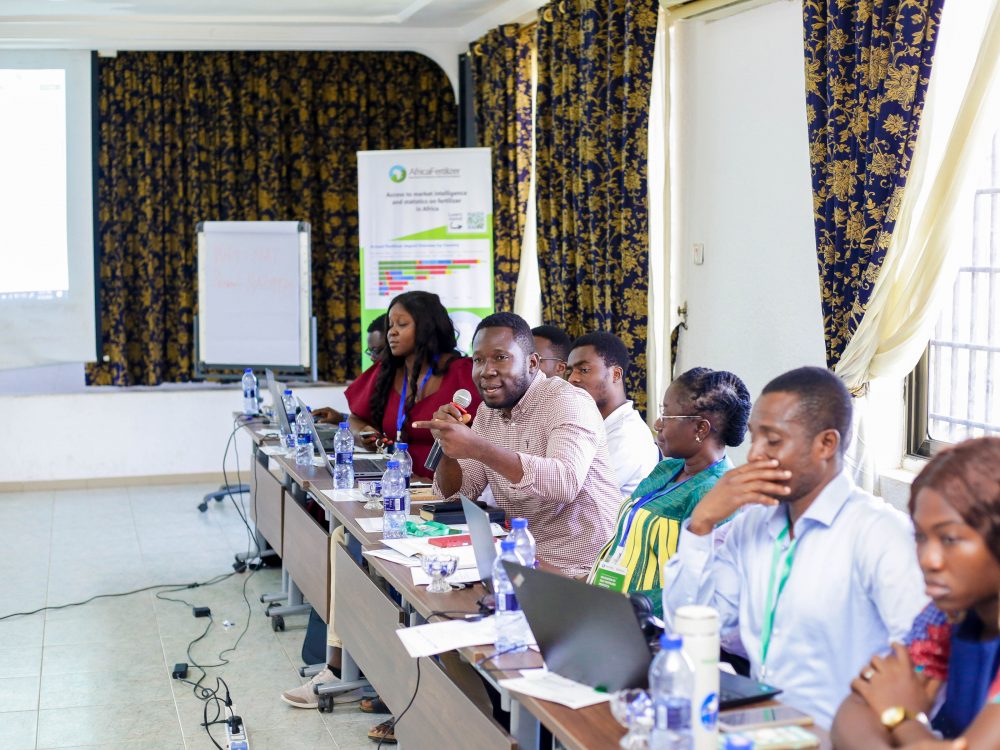
Fertilizer Technical Working Groups Provide Key Insights into Africa’s Fertilizer Sector
From June 2021 to September 2022, Development Gateway: An IREX Venture’s (DG’s) Visualizing Insights on Fertilizer for African Agriculture (VIFAA) program convened 12 Fertilizer Technical Working Groups in 14 countries which have yielded essential information on Africa’s fertilizer sector, including insights on how geopolitical events have impacted the fertilizer sector and what is needed to mitigate resulting threats to food security throughout Africa.
Development Gateway and the Eggheads of Open Data
This is a guest post from Dr. Catherine (Kate) Weaver, Associate Dean and Associate Professor at the LBJ School of Public Affairs, and Co-Director of Innovations for Peace and Development, at The University of Texas at Austin.
Nearly ten years ago when I began working with fine folks at Development Gateway, I was still an untenured assistant professor at The University of Texas at Austin (UT). Josh Powell, now CEO, was freshly promoted from his internship position with DG. As a young start-up, DG was doing something quite daring. It was reaching out to work with “eggheads” in academic institutions like the University of Texas, Brigham Young University, and the College of William & Mary (home to AidData). The goal was to find willing partners to dive into the relatively new field of open data, and specifically to test one risky hypothesis: If we could geospatially map global aid flows at a highly refined level, could we make aid data transparent in a way that would empower key stakeholders within donor organizations and aid-receiving countries to make better decisions about where they put aid dollars?
Determined to give the “eggheads” a dose of reality, then DG CEO, Jean Louis Sarbib, and Director of Innovation, Steven Davenport, invited Dr. Michael Findley and myself to participate in the Aid Management Program (AMP) Best Practices Workshop in December 2010 in Nairobi, Kenya. Here we pitched what we thought was a simple idea: we would work with one AMP country to use ArcGIS to map the subnational locations and detailed activities of all aid projects in their country. It was an ambitious attempt to show proof of concept on the promise of data visualization previously launched by the World Bank under its Mapping for Results program. As academics, we had the job security and grant money to take it on. Through its World Bank ties and AMP program, DG had the in-country connections, technical capacity and the street-smarts to carry it off. The wonderful Aid and Debt Division of the Ministry of Finance in Malawi, led by Stan Nkhata, had the courage to support us. And the first multi-donor aid mapping exercise was born.
We achieved that proof of concept after nearly two years of hard work. It took months of digging out and digitizing hard files from various storerooms and file cabinets in Malawi, mobilizing a small army of UT and William & Mary interns to manually hand code thousands of pages of documents, and mining these same documents for the locations of projects to feed into Geonames and ArcGIS. In late 2011, our work resulted in a map of all the aid data (we could find) in one country (Malawi), visualized through maps and dashboards that we hoped (!) would be useful to decision-makers in countries.
To be honest, we learned as much about what could not be done at the time as what could be done. Read our report here. While we produced some very pretty maps which garnered considerable excitement internationally, we were also keenly aware of the “gaps and traps of maps.” For example, there was a lot of missing data due to huge variability in the availability and quality of information in project documents, locations of aid activities (when provided) were far from precise, and activity coding was difficult because of the death of project description information. Moreover, using the maps, even when we could build incentives and capacity for such use, was problematic. These early maps were fundamentally built upon spotty data because we were still much in the early days of aid transparency. We were caught in a giant catch-22: you couldn’t get robust use until the data were comprehensive, timely, and accurate, but you couldn’t get donors to report unless they were convinced that the resources and time they put into reporting data would lead to ethical and meaningful use of that data.
Very quickly the excitement of the initial multi-donor aid map wore off, and bigger and better initiatives took off. These included the AidData Center for Development Policy consortium (funded by USAID) to scale up multi-donor mapping and data use studies, the International Aid Transparency Initiative – already established previously – expanded the geospatial component of its common standard for improved donor reporting, the expansion of groundbreaking work on open data by numerous NGOs such as Development Initiatives and Open Data Watch, the continued advocacy efforts of Publish What You Fund, research endeavors such Open Data for Development (OD4D), and the launch of numerous annual global forums such as the International Open Data Conference. DG was centrally involved in all of this.
That was a decade ago. What does this story say about DG and where it is today?
Without a doubt, DG was then – and is now – recognized and respected widely as a global innovator and leader in the open data space now working across numerous sectors (including results data, gender data, extractives, open contracts, and agriculture). DG continues to take big risks and establish important partnerships across academics, NGOs, IGO, government, and civil society. More importantly, DG is, and has always been, willing to ask tough questions – often about the effectiveness of its own prior work – and to learn from failure. Its work with the AMP systems also reveals DG’s successful business models: build and sustain partnerships, share knowledge, listen and learn, adapt.
Finally (and I think this is the most important point), DG is patient and persistent. The dedicated staff and leaders of DG know that the real work of open data requires digging in when the excitement fades, doing the hard and tedious work maintaining and adapting systems, constantly reflecting upon the underlying assumptions of our theories of change around open data, and testing those assumptions again and again with painstaking, rigorous evaluation.
Share
Related Posts
Turning 20 in 2020…
As we look forward to DG’s next decade, which coincides with the end of the 2030 SDG era, the tumult of the present, together with our core identity and skills, point us to several opportunities to contribute to a more hopeful future. We are looking forward to working with our partners in making DG’s 3rd decade our most ambitious and successful one yet.
Who Are We Now?
Over the last twenty years, DG has morphed into a global organization with location-based personnel across the world. Where are we now? Who is Development Gateway and what do we prioritize?
20 ans de leçons apprises
DG a été façonné par 20 ans de leçons apprises à travers les évaluations, les mises en œuvre et les mesures d’atténuation pour faire face aux défis. Ces leçons ont contribué à faire évoluer notre approche, à influencer notre perspective stratégique et à soutenir l’innovation continue.
In Partnership: 11 Years of Investing in Development Data
This is a guest post from Alena Stern and David Trichler. Alena Stern is the former W&M program manager for the AidData Higher Educations Solutions Network award. She is currently a data science fellow at the Urban Institute. David Trichler is the former W&M AidData Director of Operations. He is currently interim Assistant Director at W&M’s Global Research Institute.
In 2008 we realized we had a problem. From a William and Mary senior honors thesis project in 2003, PLAID (Project Level AID) had grown into a team of dozens of faculty and students at William & Mary and Brigham Young University, working together to create the world’s largest database of project-level aid investments, precisely coded by specific activities. But while we had made great progress on creating a rich dataset that powered the publication of numerous academic articles and books, as PLAID reached its fifth year in 2008 we wondered how to expand our impact outside of academia.
At the same time, Development Gateway, a spin-off of the World Bank led by Jean-Louis Sarbib, had created a database of development activities called AiDA and were seeking more refined data to improve the tool’s ability to provide analysis to policymakers in areas of foreign assistance, aid allocation, and aid effectiveness.
It was, as they say, a match made in heaven. Mike Tierney, Director of W&M’s Global Research Institute, commented at the time: “We immediately saw the complementarity with Development Gateway’s work. We originally built PLAID to do academic research, but input from the policy community made clear that a publicly accessible database could also promote accountability, coordination, best practices…there is great potential for a much wider audience to benefit from it.”
It was a prescient statement, as an agreement in the fall of 2009 created the AidData partnership and set the foundation for a scaling of evidence-based insights in partnership with dozens of NGOs, governments, and multilateral institutions. A pivotal outcome from AidData included support to establish the international standard for geo-coding aid projects and the adoption and diffusion of this innovation. Prior to this, geocoded aid data had been considered something of a novelty within the policy community. Today of course, it is commonplace for government ministries throughout the world to identify the localities where development projects are implemented and assess whether development assistance is fairly allocated based on need.
In 2012, AidData became one of the founding centers of USAID’s Higher Education Solutions Network, helping to catalyze a geospatial revolution with partners in and beyond the Agency. W&M, in partnership with the terrific Nancy Choi, Josh Powell, and Vanessa Goas leadership team at Development Gateway, implemented a range of activities across multiple continents along with partners at Brigham Young University, University of Texas-Austin, and Esri. Together the group expanded in-county use of more precise data in over a dozen countries, mobilized over 100 researchers to better analyze the impact of development activities, built capacity of USAID missions and community partners to use geocoded data in their work, and ran experiments to identify how to improve the uptake of new data platforms and uses.
In 2015 AidData became an independent research lab at W&M, continuing its partnership with Development Gateway as we continued to leverage our respective strengths in research and in-country implementation on projects in Cote d’Ivoire, Nigeria, and Haiti.
Each day, we work in international development because we hope to make things better. While there are highs and lows in the journey, one of the joys in the work is finding those who share similar values and a relentless pursuit of excellence. DG has been just that kind of partner for AidData, and we hope you’ll join us in a toast to them as they celebrate 20 years. We look forward to continuing our work to go faster, and farther, together.
Share
Related Posts
The G20 Must Recognize the Power of Procurement for Social & Economic Good
Procurement deserves a strategic seat at the top table across all of the Italian G20 presidencies. Anti-corruption priorities and open contracting solutions can drive progress in a number of areas.
The Open Gov Hub: A Pivotal Partnership that Created a Vibrant Community
Development Gateway is a co-founder of the Open Gov Hub, and manages the Hub jointly with Global Integrity. In this guest post, Open Gov Hub (OGH) leadership past and present explore the value of a thematic co-working space, and how that value transcends physical structure.
Nathaniel Heller – Current Vice President & Managing Director, Geneva Global; Co-Founder, Global Integrity; DG Board Member:
The idea for what eventually became the Open Gov Hub began when I ran into a colleague in the open government community at a conference in Lima, Peru. We hadn’t seen each other in months despite being professional allies and collaborators… and yet he worked roughly five blocks away from where the Global Integrity office was (at the time) in Washington, DC. “This seems a little inefficient,” I reflected to myself, and the rest, as they say, was history.
From that little moment to a more formal lunch with roughly a dozen potentially interested groups at Global Integrity’s then dingy office space caddy-corner from today’s Open Gov Hub location on Vermont Avenue, a number of us began to coalesce behind some of the core design principles that have always been central to the hub: gather the best organizations working on open government and citizen engagement under one roof; help them improve their physical plant and operating infrastructure by sharing costs across the many organizations; and make the thing financially sustainable from day one without a dime of outside donor subsidy. While much has changed about the hub since we first opened its doors, those core tenets still hold true.
Critical to getting the Hub off the ground was Development Gateway, whose old office space on G Street between 18th and 19th was reconfigured from a traditional office setting to the open floor plan and collaborative environment that we know the hub for today. Development Gateway’s leadership at the time, including Jean-Louis Sarbib and Stephen Davenport, took a huge leap of faith in allowing their office to be repurposed to host an entire crazy community they barely knew. But those leaders and DG had foresight. They understood that by linking up with peers in a collaborative fashion rather than viewing them narrowly as competitors for a limited pot of philanthropic funding, they could accelerate DG’s transformation into the world-leading “data for development” non-governmental organization that it is today. I’m quite confident that without having had the courage to fully embrace the hub concept and its community, DG wouldn’t have evolved into what it now is.
Alan Hudson, Global Integrity Executive Director:
I joined Global Integrity in April 2014. I was living in the UK at the time, but – with the Open Gov Hub having been one of the things that lured me away from Brighton, England – I was very happy to be in Washington D.C. on the very first day that the current Open Gov Hub (version 2.0) opened its doors. With Nathaniel still at the helm for Global Integrity throughout 2014 and Tina Crawley doing a great job of helping the community to make the new space its own, I settled into life at Global Integrity, moving to DC in September 2014.
I took over Nathaniel’s role at the start of 2015, and, along with developing a new strategy for Global Integrity, the most important thing I was involved in during that year was hiring Nada Zohdy as the new Director of the Open Gov Hub. Everybody on the interview panel was excited about the prospect of having Nada take on this leadership role and we were thrilled when she accepted our offer. The Open Gov Hub, and Global Integrity, have been very lucky to have Nada lead the community over the last five years. The commitment, creativity, and community-building skills that Nada has brought to the role have been truly exceptional.
Nada Zohdy, Open Gov Hub Director:
The Open Gov Hub has continued over the years to be a jointly managed partnership of Global Integrity and Development Gateway, with former DG CEO Jean-Louis Sarbib playing a very key Hub advisory role for many years and passing the baton to Josh Powell who has actively engaged more recently.
Since 2015, we’ve grown the Hub’s member network, programs and operations in a wide variety of ways. Our membership has more than doubled, now up to 50 member organizations and well over 300 people as active members who collectively focus on over 100 countries worldwide.
In 2016, we developed the Hub’s first-ever strategy and we continue to implement an evolved version of it today. Our strategy structures our efforts to maximize resource sharing and collaboration across the network and helps to provide a clear shared vision and organizational structure, while maintaining room for ongoing adaptation and for supporting the strategies and priorities of individual member organizations as they also evolve.
And we’ve certainly kept Open Gov Hub a buzzing place! We have consistently averaged about 3 events per week, totaling over 150 per year, with over 10,000 visitors annually. The Hub team has grown too, and continues to strive to foster the Hub as a world-class meeting place, where on any given day you have the chance to meet someone new you might collaborate with, and learn something new to enhance the social impact of your work.

Over time we’ve learned that collaboration can take many forms – shared staffing referrals and arrangements have become the single most common form of collaboration (and are a testament to how much organizations trust each one another to help them improve their number #1 resource – talent). But collaboration has also taken the form of joint events and programs, joint fundraising proposals, sharing/joint use of research and data, and more, with connections facilitated and supported by the Open Gov Hub team.
The emergence and expansion of our Global Network of Affiliate Open Gov Hubs in other countries is another significant highlight. This formally began in 2014 with the first affiliate in Nepal, and our partner Accountability Lab has played a leading role over the years expanding the network. In 2019 we secured this program’s first grant funding (from the Open Society Foundations) to formalize and expand the support we provide like-minded civic innovation hubs in other countries. The network now includes 13 hubs across 5 different continents! We look forward to deepening this work to scale up the impact of the Hub well beyond Washington, D.C.
Despite all the growth and successes, we of course face challenges as well, especially today in light of rising authoritarianism around the world (which we designed the Defending Democracy program in response to), and of course the COVID-19 pandemic. The fundamental way people connect and work – in person and virtually – is rapidly changing, and we are doing our best to adapt and evolve in response. After almost 5 months of Stay at Home orders, no single member organization has left the network, which is a testament to how much members value the Open Gov Hub beyond our physical coworking space. Whatever challenges we face, we will continue to lead with our values front and center – openness, collaboration, learning, and innovation – because working together continues to be the best way to address collective social challenges, in our backyards and around the globe.
Share
Related Posts
The G20 Must Recognize the Power of Procurement for Social & Economic Good
Procurement deserves a strategic seat at the top table across all of the Italian G20 presidencies. Anti-corruption priorities and open contracting solutions can drive progress in a number of areas.
Our Partnerships Make Us DG
Sarah Orton-Vipond is Director of Engagement and Partnerships for DG, starting as a Business Development Associate in 2012. During her time at DG she has worked on open contracting, TASAI-VISTA, and DG’s Results Data Initiative. She is also an active member in Open Heroines.
When Lindsey Fincham, our Communications Specialist, first joined DG, she asked me about DG’s competitors. I received a justifiable eye roll when I gave my typical answer, “we don’t have any.” Sure, we do compete on requests for proposals and funding is a finite resource, but if we don’t have something valuable that sets our approach apart from other organizations, why would we do it alone? Rather than compete with our peer organizations, we prefer to partner to learn from those with complementary thematic or geographic expertise and to deliver stronger program outcomes.
The True Value of Partnership
Out of DG’s twelve core values, five are centered on partners and partnerships. The prioritization of partnerships comes from our willingness to admit that we do not have all the answers. Our ability to achieve sustainability and impact is greatly dependent on our strong partnerships, which expand beyond our expertise alone. From our early days co-designing – long before co-design became a buzzword – the Aid Management Platform (AMP) with the Government of Ethiopia and other partners, to today, partnerships are what make DG, DG. Below, I have grounded our core values in examples that show how partnerships over the years have allowed us to be more effective, to learn and grow together, and to creatively solve problems through joint expertise.
Value: We are a global organization and partner locally whenever possible through teams in the regions and communities where our work takes place.
Our team is increasingly from and based in the countries where we work, and we prioritize partnering with local organizations whenever possible. The Results Data Initiative, which helped shape DG’s thinking around data and decision-making, would not have been as successful without our in-country partners in Tanzania, Ghana, and Sri Lanka. Our partners knew the key stakeholders in the results data space, as well as the local priorities within agriculture and health. In an example from Sri Lanka, without the contextual knowledge from our partnership with Management Frontiers, we would not have made our way to the Ampara District Office or the Ampara General Hospital. The Ampara District – entirely across the country from Colombo, where our research was primarily focused – has received many accolades, including a two-foot tall trophy with a golden rooster. Ampara General Hospital itself has also received many international data awards. What we learned around the Ampara District, due to the relationships held by Management Frontiers, was a driver in how we think about benchmarking, including that physical awards on data quality and data use can establish incentives that affect the results data ecosystem.
Value: We partner with institutions to drive change from the inside.
Our programs with the biggest impacts are those where we have transitioned beyond a client-consultant relationship into a cohesive team with shared goals. One clear example of this is our work with Comité de Mobilisations des Ressources Extérieures (COMOREX) on the Aid Management Program in Cote d’Ivoire. The high-level buy-in from the Prime Minister, who uses AMP for monthly meetings with development partners, and the involvement of sector ministers and other stakeholders from the very outset of implementation made COMEREX an ideal partner. Since 2012, COMOREX has effectively integrated AMP into their own internal processes, and has played an important standard-setting role in the AMP community – becoming a thought leader in AMP’s evolution. COMOREX has suggested many of the improvements that have been incorporated into AMP and benefited AMP users globally, in addition to hosting study tours for peers from Haiti and Chad.
Value: We build solutions with, not for, our partners.
Value: We work to build local and partner capacity for our tools whenever possible, and we prioritize solutions that are the right fit for partners in the long-term.
Co-design is a term that gets thrown around a lot; and our solutions have traveled along the co-design spectrum the past two decades. Through the Results Data Initiative, we put our approach to co-design to the test, including in our partnership with Malawi’s Ministry of Agriculture. Rather than a narrow technical assessment centered on designing a generic agricultural monitoring system, we collaborated on an in-depth co-design of the National Agriculture Management System (NAMIS), which focused on understanding the true decision-making needs of a variety of stakeholders at both national and sub-national levels. Through this co-designed assessment, DG worked closely with the Government, building consensus and securing buy-in from champions; interviewing over 75 stakeholders; and developing a report that identified the needs of a decision-centered system. We often joke that building technology is the easier part of our work. Designing with our partners and fully understanding the context and needs is hard – but it is vital for sustainable solutions.
Value: We contribute to the global policy community through active participation in multi-stakeholder partnerships; collaboration with like-minded partners; and active dissemination of policy-relevant lessons.
As we wrote in our recent blog on DG’s work in the global policy space, “After a history of deep relationships with country governments and development partners, we realized that we had a lot to say.” Learning from partners with goals similar to ours has allowed us to cross-pollinate the spaces in which we work, and our voice in the policy space has been guided by learnings from partnerships with governments, institutions, and multi-stakeholder groups as well. For example, we are actively engaged with both the International Aid Transparency Initiative (IATI) at the country-level and at the global policy level. We have been able to see how countries struggled with interoperability of their data systems when implementing the IATI standards; and we were able to help translate the challenge back to IATI to improve the standard. Additionally, the collaboration and lessons learned from our policy partners feed into our broader policy framework. For example, lessons from DG’s partnership with Global Affairs Canada measuring Canada’s feminist international policy have made their way into an upcoming paper about using gender data for feminist outcomes in extractive industries.
Selecting Partners
Who we chose to work with is a reflection of DG, and the ways in which the roles of global organizations are rapidly evolving. When partnering, we are not simply looking for organizations that share and reflect our values. We also look for partners who:
- Complement DG’s skills and experience
- Are interested in collaborative thought-partnership. Rather than a purely technical and contractual relationship, we prefer to work in partnerships and consortiums where we can help shape the overall program vision and approach, and we look for the same collaborative input from our own subcontractors.
- Prioritize diversity in staff, leadership, and boards. While this can be a challenge, we all need to do better, and to hold ourselves and others accountable.
- Treat their team members with respect and have a reputation for doing so.
- Care about work that has lasting impact and makes a change.
Looking forward, being – and seeking out – good partners will remain a core part of our identity. In the coming years, DG will increasingly prioritize partners and funders who reflect our values, and we look forward to partnering with many of you in making DG’s next 20 years even more collaborative in creating more responsive, accountable, and effective development programming and institutions.
Share
Related Posts
The G20 Must Recognize the Power of Procurement for Social & Economic Good
Procurement deserves a strategic seat at the top table across all of the Italian G20 presidencies. Anti-corruption priorities and open contracting solutions can drive progress in a number of areas.
Building Côte d’Ivoire’s National HIV/AIDs Capabilities to Better Use Data & Tools for Decision-Making at PNLS
Des Chiffres et Des Jeunes (DCDJ) is a program led by Development Gateway (DG) and funded by the MCC-PEPFAR Data Collaboratives for Local Impact (DCLI) Program in Côte d’Ivoire. DCDJ aims to bolster the subnational supply and use of data for Ivorian citizens, engage youth as champions of these services, and fuel innovation to address rising data needs. A DCDJ Fellowship provides dual benefits for both Ivoirian host organizations and Data Fellows themselves. At the Programme National de Lutte Contre le Sida (National Program to Fight HIV/AIDS or PNLS), DCDJ Data Fellow Flore Koffi identified a need for faster visualization of important HIV/AIDS treatment data, and built a new dashboard that enables PNLS staff to access, analyze, and use information for the fight against HIV/AIDS.
This blog was originally posted on the DCLI website.
Background
The Des Chiffres et Des Jeunes (DCDJ) Data Fellowship is a flagship DCDJ program that places technically-trained Ivorian youth into organizations where they encourage and increase the degree to which data is used for decision making. It is a unique opportunity for young people to sharpen data skills while contributing to a strengthened data ecosystem and to data-related resource availability in Côte d’Ivoire. DCDJ is a program led by Development Gateway and funded by the Data Collaboratives for Local Impact (DCLI) program.
The DCDJ Data Fellowship equips Côte d’Ivoire with the human and intellectual capital it needs to promote, maintain, and succeed in sustainable development. Building young peoples’ skills to strategically catalyze sustainable change, DCDJ leverages local capacity to improve data access, sharing, and availability.
Problem

Côte d’Ivoire’s Programme National de Lutte Contre le Sida (PNLS) is a government agency that leads the response against HIV/AIDS in Cote d’Ivoire. At PNLS, workers had access to data, but analyzing that data was a challenge. Until recently, PNLS stored important data used to track progress in controlling the HIV/AIDS epidemic in separate Excel sheets. Each time updates were made in one sheet, they had to be manually updated across several others.
Flore Koffi, a DCDJ Data Fellow assigned to PNLS in 2019, observed that individually editing Excel sheets was insufficient to keep up with PNLS’s data needs. She noted, “When someone updated one spreadsheet, the rest of the staff’s spreadsheets would not get updated – it was really difficult for everyone to access and analyze the data.” PNLS staff struggled to keep data current across the organization. Despite a few previous attempts at introducing a new solution, no tool had managed to replace the Excel system.
PNLS also lacked the tools and experienced staff to add visualization dimensions and capabilities to its analysis. Effectively preparing and presenting information was a challenge. For example, the department struggled with gathering accurate, impactful data to prepare regular presentations on disease trends and intervention performance.
Solution
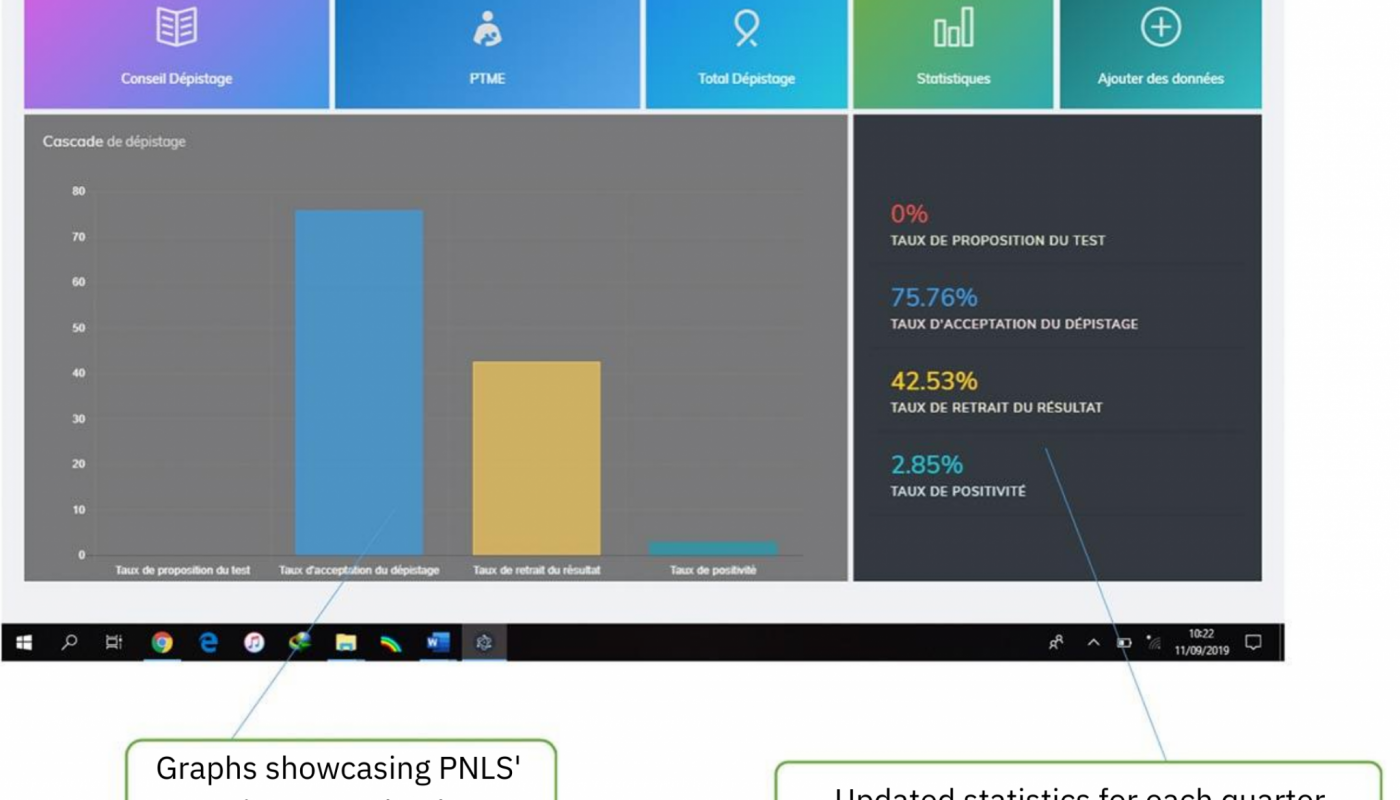
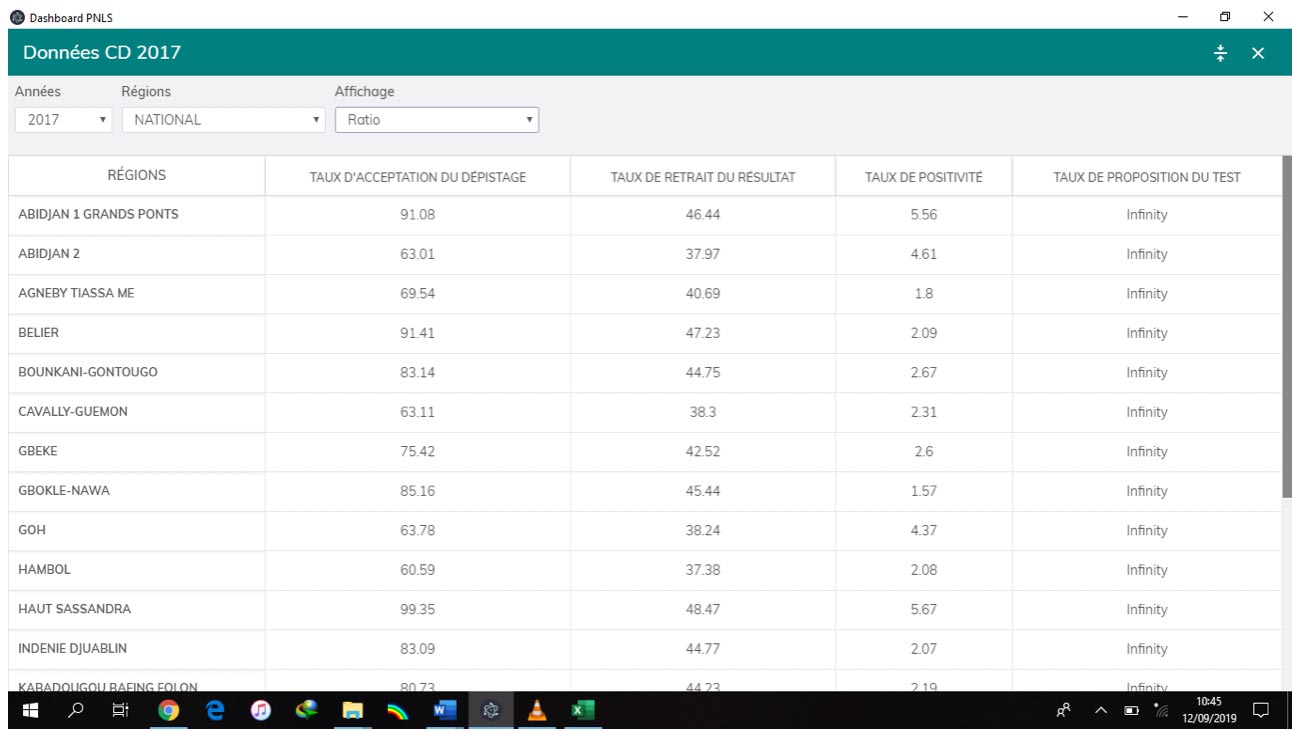
During her placement at PNLS, Flore identified the opportunity to enhance the use of the data stored on Excel sheets. She also recognized that any tool that would replace the Excel system needed to be sustainable, systematic, and useful for healthcare workers’ needs. To create a centralized source of regularly updated, real-time data, Flore collected and cleaned data, then built a new dashboard using her programming skills from the Data Fellowship. It includes data storage, analysis, and visualization of locations where HIV screening and prevention measures are already occurring, and where they are needed. This data, once distributed across multiple copies of spreadsheets kept by different staff, is now centralized and accessible in real time. Insights that used to be unreliable, scattered across departments, or buried with other unusable data, are now extracted and useful.
Processes
After identifying challenges, Fellows work to understand their placement sites’ overarching needs. At PNLS, Flore found the same need at PNLS that many Fellows find at their sites – for a singular data source where departments can access shared data and perform analyses. Flore’s solution to the data management and analysis problem was to create a unique, centralized data source where departments could access shared data and perform analyses.
She began collecting data in the M&E department, then worked with the HIV Screening, Transmission, Prevention, and other departments to gather more information. Flore then used a common programming language to build the new dashboard. She calculated baseline indicators to measure health outcomes, integrating and strengthening a measurement framework. She also trained PNLS staff on the indicators and how to run useful analyses. Because the tool also completes some analyses automatically, it is easy-to-use and requires just basic capacity building.
Outcomes & Impacts
Without visualization capabilities, effectively preparing and presenting information is a challenge. But with the new dashboard, the PNLS’s Head of HIV Screening Dept can quickly create graphs and charts for presentations. Staff can run reports and gather data without having to submit requests to the M&E department or propagating updates throughout other departments. Individuals now update a central cache of data, rather than reconciling changes across many copies of the same sheet.
Flore improved PNLS’s processes, while taking prudent next steps to advance a career at the intersection of data science, business, and health. Developing solutions that lead to both short- and long-term efficiency gains – like building a single source to access and analyze essential HIV/AIDS data – is an important professional step for Data Fellows. Having applied data science skills professionally, individuals can identify their next steps. The professional skills, technical know-how, and relationship management required to develop and roll out an organization-wide technical tool enabled Flore to lay the groundwork for her career while helping PNLS advance its mission.
Share
Related Posts
How DG Brought a Gender Data Approach to Our Least-Likely Projects — and Beyond
Martha Staid started at Development Gateway as a Senior Associate in 2014, and now serves as Director of Operations. In her role, Martha supports the work of DG’s project managers and researchers, working to ensure each project team has the right people and processes to drive data use. She has a background working on women and technology, and has led DG’s work on visualizing gender data, including the PREMAND and Countdown to 2030 dashboards.
The Early Days of Gender & Development
Once upon a time, a prevailing attitude in international development work was that projects did not need to focus on gender issues explicitly because “a rising tide lifts all boats” — that is, reducing poverty was the important goal, because women would be equally impacted by any improvement in wealth or resources.
We have long since agreed this is not true. As in all societies, built-in systems reinforce existing inequalities, like who has access to jobs, who controls household income, who eats first, whose education is prioritized and who drops out of school to care for family members. Unless interventions explicitly target a marginalized population — women and girls, ethnic minorities, the ultra-poor, etc — and actively seek to address the factors disadvantaging them, they are unlikely to see the same impact as the more powerful members of society. Put more succinctly, gender-blind is not gender neutral.
(While the examples below focus on self-identified women, gender is, of course, not a fixed binary. When projects fail to consider gender, it disadvantages anyone not considered “default” — that is, not male — including people who are transgender or who identify as neither male nor female. Considering gender at all is a beginning, but one that needs to quickly become more inclusive.)
For an even longer time though, gender in development data has been something of an afterthought. The focus was on the role of data or technology broadly; if gender came up, it was usually in the context of issues that explicitly affected women, like maternal health, or girls’ access to education.
Development Gateway was no exception. Here and there, we suggested data be disaggregated by gender, but as with DG’s internal demographics, it took time to develop an inclusive approach. It was not until 2016 that DG took a real first step into the world of gender data. Fittingly, it was in the context of tracking aid flows, building on one of our oldest areas of expertise. In partnership with the Center for Global Development, Data2X, and the Millennium Challenge Corporation, DG looked at how the International Aid Transparency Initiative (IATI) incorporated gender data, and what impact that could have. We found that, at the time, only 16% of projects reported via the IATI data standard used a gender data marker, and it was unclear exactly what that meant: was a project gender-specific? Gender-sensitive? Was it actually having the intended impact on women or girls? The reporting options were too vague to provide much insight.
On Not ‘Doing Gender’
In the five years since the work on IATI data, DG has increasingly sought to prioritize a gender data focus across our work. This differs, however, from saying we “work in gender” as a sector, in the same way we work in, say, agriculture or health. A great deal of amazing work is done specifically focused on advancing women’s rights and resources. However, we aim to think of gender as a cross-cutting issue with relevance to everything we do — and to everything the development data world does.
In the past five years, we have increasingly aimed to view our work through the lens of how it is likely to impact — or fail to impact — girls and women. What relevant information should be taken into account, what kind of data or disaggregation will allow decision-makers to tailor their approach to be sensitive to the gendered realities of life everywhere? By asking “How could we use a gender focus here?”, we have been able to answer a surprisingly broad range of questions.
ensure an inclusive data sector in emerging economies? (And why should we?)
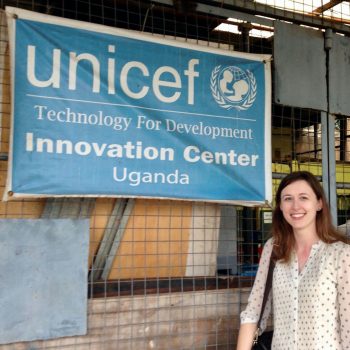
The Open Geospatial Data Center for Health, created by AidData, Development Gateway, the Côte d’Ivoire Ministry of Health, USAID and PEPFAR, aims to close gaps in HIV testing and treatment in Côte d’Ivoire. Part of this work is to better understand the geography where high-risk populations live and the accessibility of health services. DG led several OpenStreetMap Mapathons in 2018 to gather this data, and made a concerted effort to recruit female mappers to the work in Abidjan.
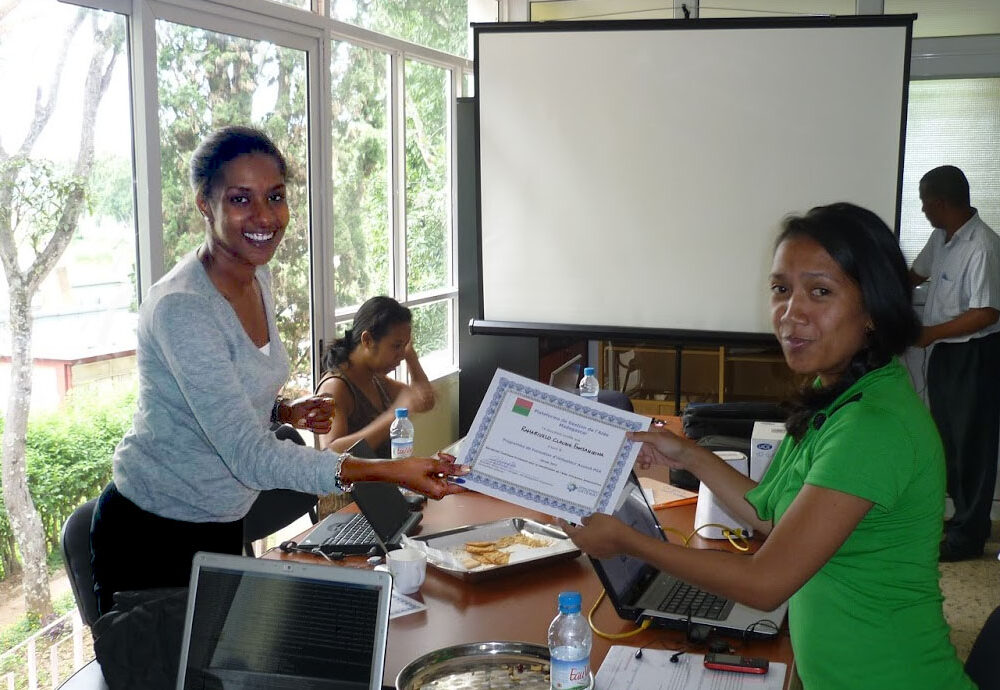
Whereas a “gender-blind” approach might reasonably have produced a volunteer group with demographics similar to those in the overall Ivorian mapping community, where only 3% of mappers are women, this gender-conscious approach resulted in a participation rate ten times higher at some events: 35% of data collection participants in San Pedro and 33% of mapathon participants in Bouaké. Why does this matter? When women are encouraged to participate, they are able to reap the benefits of experience and connections — and in this case, two women also received awards for their work. Crowdsourced mapping also benefits from women’s participation, by bringing in additional, gender-specific knowledge of community landmarks and social behaviors.
Also in Côte d’Ivoire, DG aimed to use a similar gender-aware approach as part of the Des Chiffres et Des Jeunes (DCDJ) project, supported by the MCC-PEPFAR Data Collaboratives for Local Impact (DCLI) Program. Its data fellowship program provides intensive data science training to local young professionals. After the training, these DCDJ Data Fellows are placed in public or private sector internships that support efforts to fight HIV/AIDS. Initially, the enrollment ratio of men to women mirrored the achievement gap seen broadly in higher education in Côte d’Ivoire; but we wanted to do better, and not perpetuate those patterns.Bringing more women into the program meant addressing the variety of barriers they faced — among them social stigma and lack of time — with a range of complementary interventions throughout the program lifecycle. This meant better targeting potential female applicants, providing them with women as mentors and role models, and ensuring their fellowship workplaces welcomed and valued their contributions. Again, targeted efforts were required just to provide a similar level of opportunity to women, but it paid off: from a female applicant rate of just 17% in the first cohort of fellows, the program was able to reach a 47% enrollment rate by the third cohort. In getting there, we learned a great deal about how to iterate for ongoing improvement, and to look to the expertise of local women in doing so.
hold oil and mining companies accountable for their real-world impacts?
The extractives industry might not be the most obvious fit for a gender focus, yet our work to promote transparency has consistently been useful and relevant. In partnership with the Open Society Institute of West Africa (OSIWA), DG has conducted assessments to map data needs, availability, and use in the extractives sector in Nigeria, Guinea, and Senegal, in alignment with the Extractives Industry Transparency Index (EITI). Our team found there was clear demand for more data on how the sector impacts women’s health and education, and also pinpointed places data existed but was inaccessible, like industry documentation on workforce gender breakdowns.
This experience let us advocate for more gender-inclusive approaches at the EITI 2019 Global Summit. It also led us to partner with Women in Mining – Guinea to create the first-of-its-kind Women in Mining Index, measuring the role women play in the industry, and the impact of the sector on women in nearby communities and nationwide. Its findings have been well-received and we hope to implement it in additional countries in the near future.
visualize data as an advocacy tool for health systems change?
PREMAND (Preventing Maternal and Neonatal Death in Northern Ghana) – In 2016, DG worked with the University of Michigan, Navrongo Health Research Centre, and USAID to visualize the different outcomes of maternal and newborn health crises and the societal and geographic factors that impact them. The mapping dashboard DG built lets users, including local decision-makers, explore the interaction between mortality rates and a range of social and economic realities. In doing so, it provides evidence to advocate for closer and better healthcare facilities. The project researchers also found a significant connection between infant survival rates and the power women held within the household to make decisions about seeking healthcare — a sharp reminder of the impact of women’s agency.
DG also visualized data at a more macro level in 2017, for health factors impacting women’s lives in low- and middle-income countries. Working with UNICEF, DG developed a set of online dashboards and country profiles for the Countdown to 2030 for Women’s, Children’s and Adolescents’ Health initiative. These tools illustrate progress toward health outcomes and incorporate enabling environment factors, like policies, financing, and equity of access to health coverage. The profiles were designed to be print-ready, meaning all the visualizations appear seamlessly on a 2-page printout, so policymakers and advocates with low bandwidth can use them when issuing guidance or advocating for funding.
drive data strategy and policy for governments, multilaterals, and CSOs?
The second phase of the Results Data Initiative (RDI) aimed to increase the use of results data via user-centered design. In 2017, DG began working with Global Affairs Canada (GAC) shortly after the launch of its new Feminist International Assistance Policy (FIAP). To support the surge in demand for gender-specific data, DG reviewed GAC’s internal project-level data, extracted data relevant to FIAP indicators, and aggregated them for a key performance indicator (KPI) baseline. We also designed an annual reporting template and methodology, used successfully to analyze ongoing FIAP progress, and to make allocation and programmatic decisions supporting the feminist agenda.
Advocating for transparency has long been a key tenet of DG’s work: in aid, procurement, extractives, and data overall. DG has worked closely with Open Heroines (OH), which brings together women working in the field of open data. To revisit a lesson from above, it often requires additional effort just to get women a seat at the table, which is why DG hosted funding for Open Heroines to allow young women from emerging economies to attend the Open Government Partnership Summit in 2019. OH’s advocacy for progressive policies that support women in the workplace has also helped push DG forward on issues like payscale transparency.
Today, we have a number of active projects that are using the gender lens, including a landscaping on data visualization tools for women’s health, with UNICEF and WHO; and our Gates Foundation-funded Tobacco Control Data Initiative, which incorporates information on how women and men use tobacco products differently, and other data needed to promote policies that reduce smoking rates in both groups.
The Future Coming On
So what’s next for DG and gender? We have come a good distance, but have farther to go. Programmatically, this will mean more consistently and thoroughly applying that gender lens, even (or especially!) when there is not an obvious fit.
Beyond our project work, DG has also aimed to advocate for feminist policies in our sector, and walk the walk by adopting them ourselves: be it through our hiring practices, benefits, or taking the pledge not to have DG team members serve on all-male panels. But focusing only on a narrow definition of gender is not enough. To these efforts, we need to add a more intersectional approach, recognizing that supporting women means supporting all women — and just as with gender, issues of race and other marginalized identities must be actively accounted for, or else we perpetuate existing imbalances. To that end, we’re aiming to take our earlier work a step further: for instance, ensuring every job applicant meets with diverse interviewers; and specifying that panels in which we participate should reflect diversity of race, ethnicity, and other relevant lived experience.
And we are excited to continue being part of the conversation debunking the myth of gender neutrality — from COVID-19 to data itself — and exploring where, when, and how a gender focus can advance the work we do.
Share
Related Posts
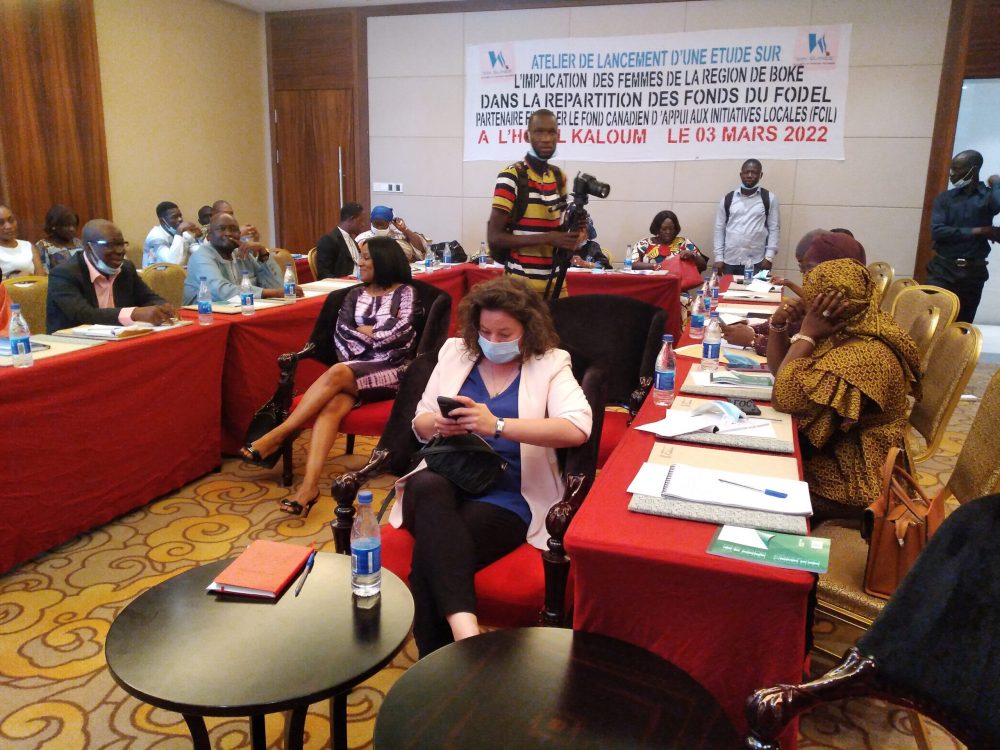
Women in Mining as Actors of Sustainable Development
Launched last week in Conakry, the Women in Mining initiative builds on our existing work in the mining industry in Guinea. With partners, DG will assess the involvement of women in disbursement of local economic development funds in the Boke region and develop a digital tool to visualize the findings.
Les femmes des zones minières, actrices du développement durable
Lancée la semaine dernière à Conakry, l’initiative “Women in Mining” s’appuie sur notre travail existant dans l’industrie minière en Guinée. Avec ses partenaires, DG évaluera l’implication des femmes dans le décaissement des fonds de développement économique local dans la région de Boke et développera un outil numérique pour visualiser les résultats.
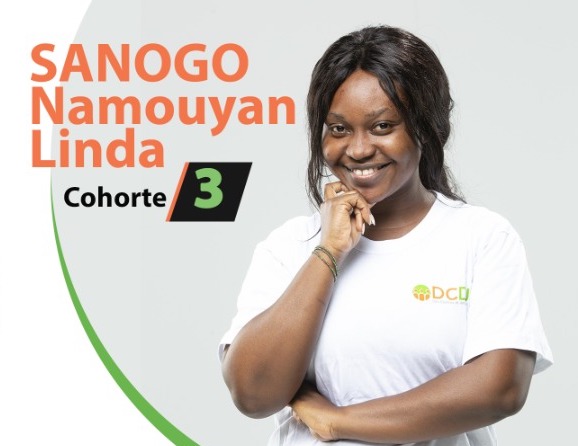
Empowering Counselors and Social Workers with Rapid Access to Patient Information
Linda Sanogo, a DCDJ Fellow in Côte d’Ivoire, worked with a community health facility to develop and train staff on a new database, as well as complete training on other IT systems. Because of Linda’s support, the facility has reduced the number of hours spent managing patient records, and opened up more time to ensure high-quality care.
Data, Digital, and Policy at DG
For over a decade, DG was widely known as “The Gateway”: as an IT vendor and curator of global public goods, such as Zunia, Country Gateways, and dgMarket. Today, we continue to be a trusted developer of digital and data solutions for international development – but we have also built out a strong policy focus.
Why? After a history of deep relationships with country governments and development partners, we realized that we had a lot to say.
Our Policy Focus
DG is uniquely positioned to add to the policy discussion. Our globally-based team understands the sectoral and country-context, our partnership ethos means we are well equipped to ask and seek answers to these questions, and our approach centers on co-creating flexible solutions and iterating to achieve better outcomes. In line with our mission and vision, we feel it is important to use our experience to inform global discussions to change business-as-usual thinking.
We were at the forefront of the open data movement, but were also among the first to critically evaluate whether and how this movement could lend itself to better-informed decision-making. After launching the first public-facing Aid Management Platform in Kosovo in 2010, we were able to expand from developing robust platform logics and data masks, to how data can be made useful and used to wider audiences.
Particularly over the past five years, we have published a number of blog posts, reports, and white papers that seek to answer questions such as:
- What makes open data accessible, useful, and used? Through key informant interviews across three countries, we published Avoiding Data Graveyards with the AidData Center for Development Policy to help funders understand key investment considerations for aid data and statistics, or our implementation research with UNICEF on barriers to country use of IATI data.
- How can we strengthen the use of monitoring and evaluation (M&E) data for feminist, results-based management? Our white paper on Understanding Data Use underscores the importance of decision space in achieving data uptake; and by sharing learnings from operationalizing Canada’s Feminist International Assistance Policy to inform ongoing feminist foreign policy initiatives.
- How can we understand and strengthen national data ecosystems? Through 17+ national data ecosystem assessments, we have deep understandings of administrative and statistical systems, and incentives for data quality and use.

Our Policy Value-Add
Through dozens of implementations across a variety of sectors, countries, and contexts, we have seen firsthand what makes data, technology, and evidence effective, and what can contribute to dormant systems filled with incomplete data that nobody uses.
We have fostered strong relationships with (and learned from) technical and policy-level actors around the world. These implementations give us a “view from the middle.” For example, we work with international secretariats and sub-national governments, NGOs, and national agencies to surface barriers to implementation of global data standards, and translate standards into actionable tools for country- and local-level use.
Finally, our policy is driven by our own action-oriented research. While our research is built on tested methodologies, our work also requires flexibility and generates usable lessons throughout the research process – not just final outcomes. The lessons we learn from our research feeds into our policy work, and visa versa. For example, our proposal for Malawi’s National Agriculture Management Information System was developed based on our CALM Methodologies and our IT know-how.
The Future
As we are finding our voice in the policy space, we are continuing to work with country partners and international open data community members to address barriers to effective aid data use. This year, we aim to formally launch the Principles for Subnational Data Use, developed in partnership with the MCC Data Collaboratives for Local Impact program. This publication will highlight the importance of local-level data for decision-making.
At the same time, we aim to increase our focus on supporting national- and local-level policymaking, particularly where our colleagues work. Through the Tobacco Control Data Initiative, engagement with ANACIM in Senegal, and open contracting work in Makueni County, Kenya, we are able to more deeply see the links between data access, use, and policy change. Our rapid growth in the agriculture data space – through TASAI, VIFAA, and related programs – will provide another opportunity to explore and support improved decision-making within a sector where data and technology are still comparatively nascent.
Finally, we see new opportunities to explore the key components of organizational data strategies and institutional incentives for data use; increased use of health response data; and to help shape the rapidly evolving conversation around data protection and governance. We have done quite a bit already in the data policy space, but look for much more from DG in the decades to come.
Paige Kirby is Senior Policy Advisor for DG. She has been with the organization since 2014, working on DG’s Aid Management Program, Results Data Initiative, and with partners on digital and data use strategies. You can follow Paige on Twitter here.
Share
Related Posts

The Future of Technology Governance and Global Development: Why DG Brought DataReady In-house
DG is excited to announce we now have more robust data governance advisory services with the recent integration of DataReady.
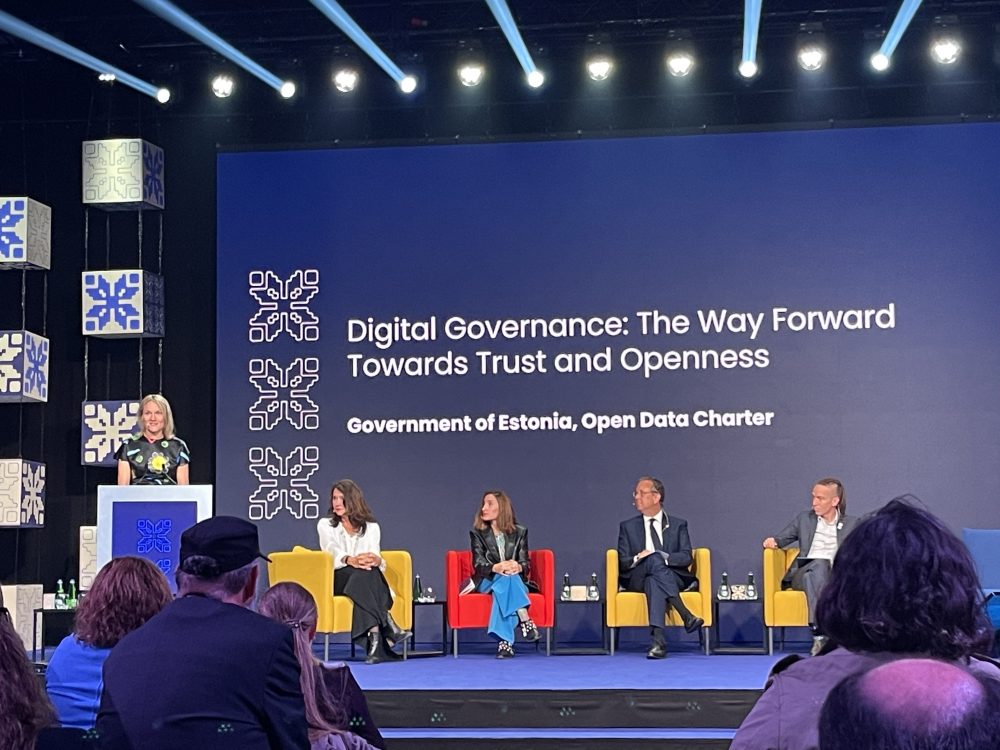
Democratizing Digital or Digitizing Democracy?
The 2023 OGP Summit in Tallinn, Estonia featured a number of discussions centered on open government in the digital age. While the use of digital tools in government is far from a new idea, the COVID-19 pandemic spurred a rapid expansion of this practice, with leaders quickly adapting to remote environments through digitizing government processes
Measuring digital transformation? Get real.
Senior Associate Annie Kilroy explores the limitations in how digital transformation has been measured and outlines recommendations for how to better assess the value and impact of digital transformation.