Posts categorized Explainer
Page 3
What’s Your Story and How Can Data Help Tell It?
For as long as Development Gateway has specialized in data, we have also specialized in data visualizations. In that time, we have discovered the pitfalls and learned ways that data visualizations can increase data use. In this post, we look specifically at selecting the right type of visualization for the story you want to tell.
The Building Blocks for Successful Data Visualization Tools
In 2020, we sought to answer a pivotal question: what are the good practices and lessons learned from the many existing women’s, children's, and adolescent’s health data visualization tools? In partnership with UNICEF, DG worked to identify good practices, as well as to determine any differences for emergency-focused data visualization tools, using COVID-19 as a test case.
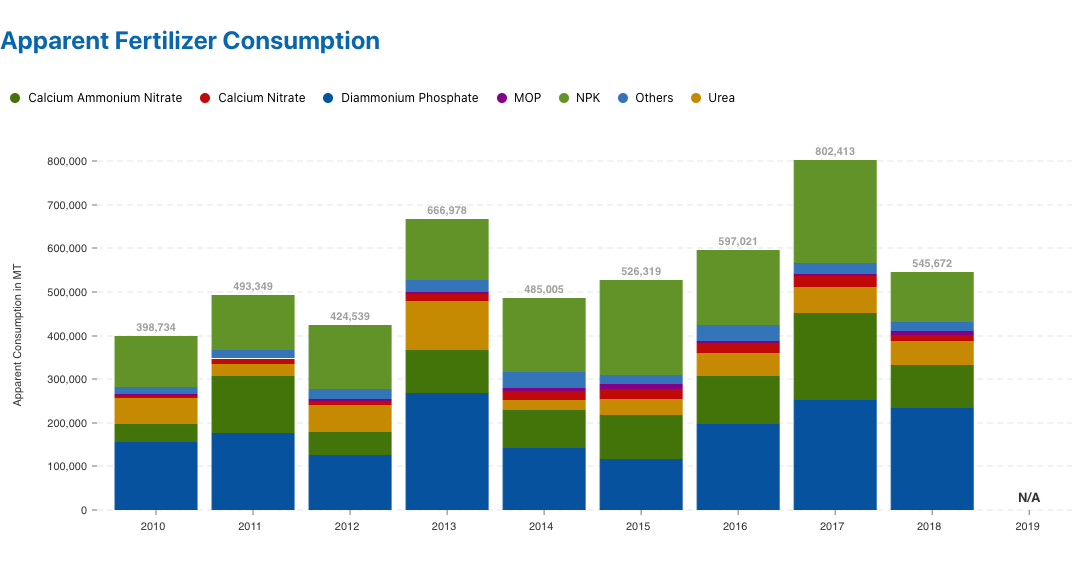
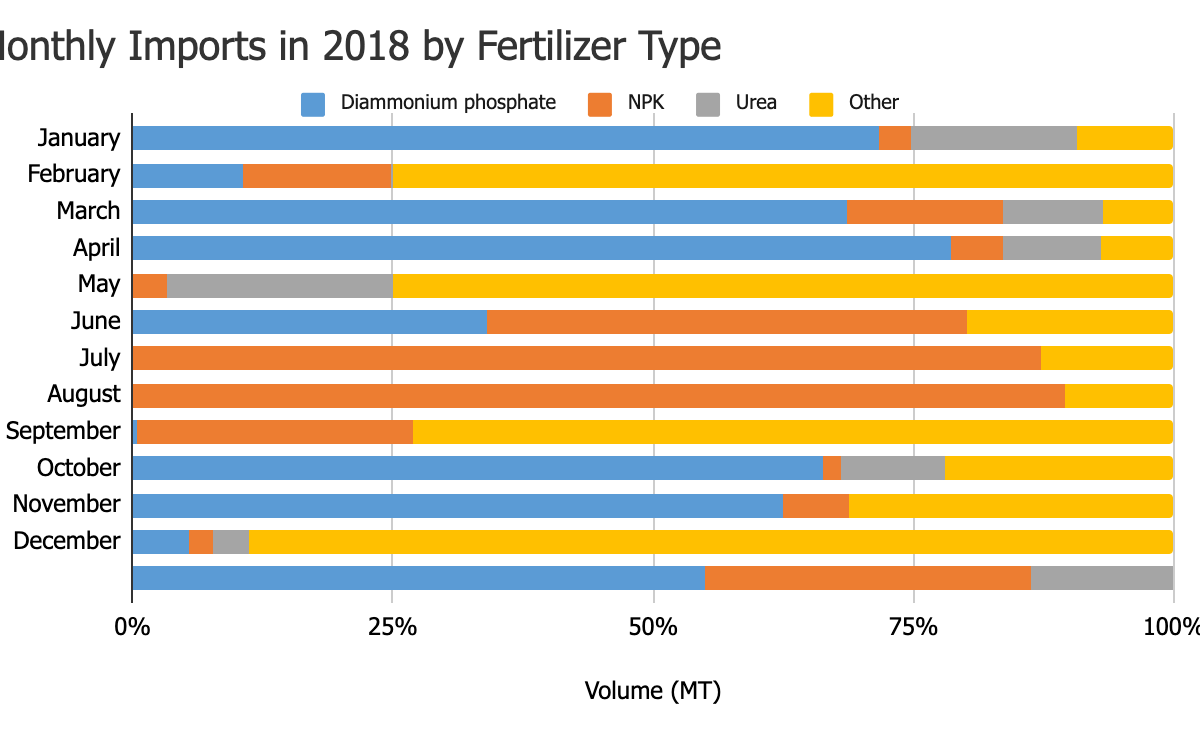
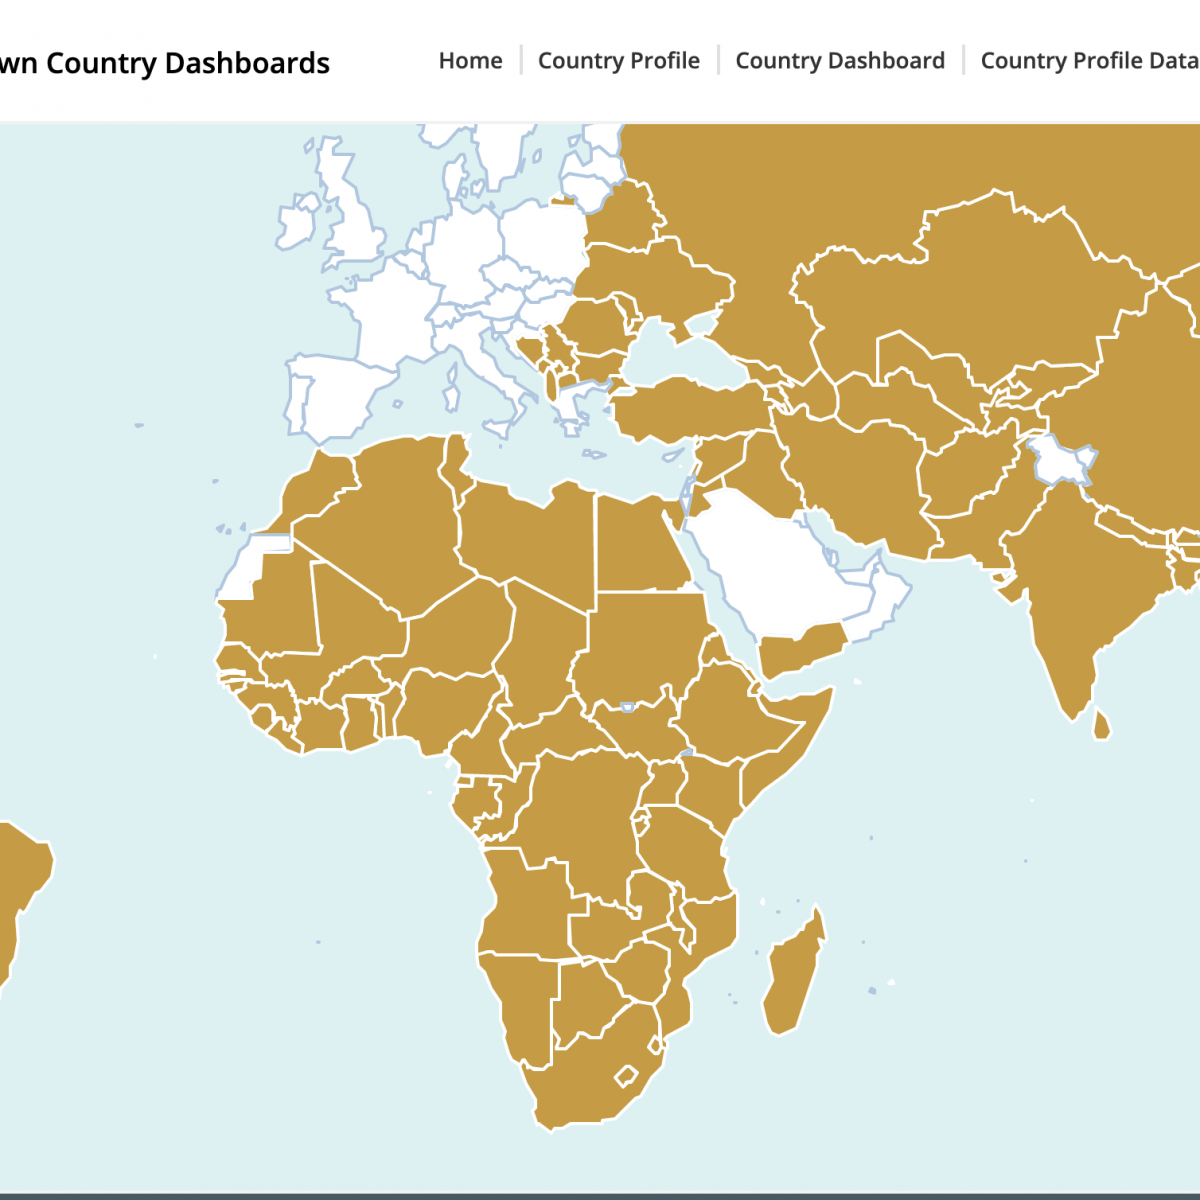
Sourcing Fertilizer Data in Sub-Saharan Africa
In advance of the first VIFAA country dashboard launch next week, we will explore the importance and source of accurate and reliable data for each of the indicators. This is a crucial step in making data available in a way that stakeholders can use to inform their decisions.
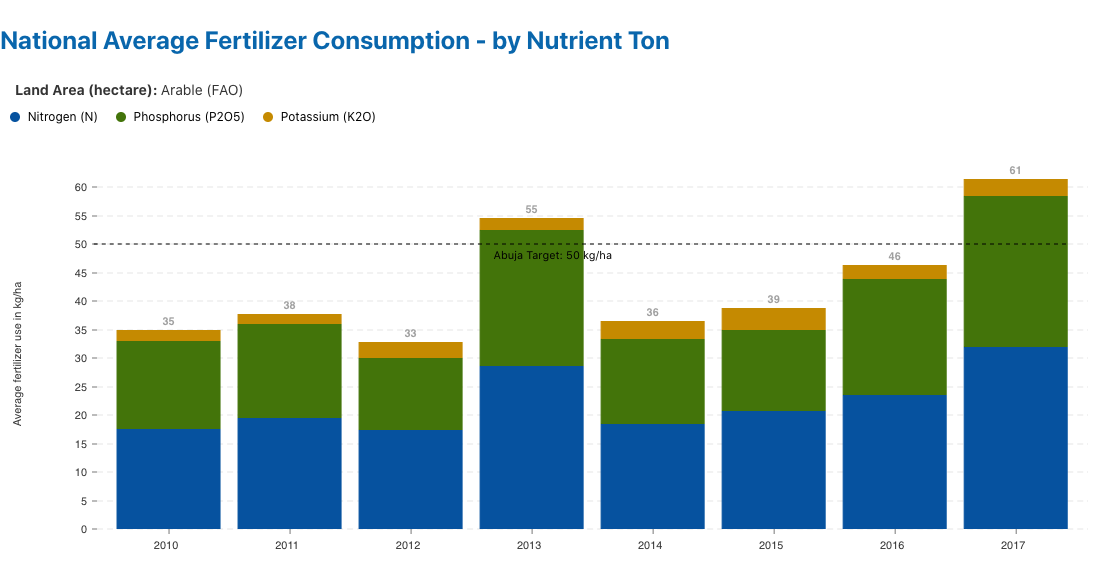
Understanding Fertilizer Data
Finding reliable agriculture data in sub-Saharan Africa is often difficult. If available at all, data is usually fragmented and tucked away in silos within government ministries or closely held by private companies. It is also significantly delayed or in a format that makes analysis difficult. For stakeholders who need information for decision making, a lack of reliable data is a significant barrier. The Visualizing Insights on Fertilizer for African Agriculture (VIFAA) program is working towards making fertilizer-related data, a key subset of agriculture data, more accessible to stakeholders for decision making.

COVID-19 Is Not Gender Neutral
As the world continues to face the effects of Covid-19, policymakers are turning to data more than ever to understand the scope of the crisis, anticipate its spread, and formulate policy decisions; but gender-disaggregated data are missing from the picture. Knowing what information is being captured and what is not could impact decision-making.
-1200x960.jpg)
Catalyzing Use of Gender Data
From our experience understanding data use, the primary obstacle to measuring and organizational learning from feminist outcomes is that development actors do not always capture gender data systematically. What can be done to change that?

What Do We Mean by “Gender Data?”
March is International Women’s History Month. Throughout the next weeks, DG will be publishing a series of blogs that highlight and honor the work that we and others are doing to support the vital role of women. We’re kicking off the series with this post, highlighting the importance of gender data.
Three Recommendations for Stronger Data Ecosystems
Incentives, accountabilities, and fitness-for-purpose influence how (and whether) data are used to drive policy. So what opportunities exist in national data ecosystems that can catalyze systemic change, toward greater evidence-based decision-making?
The Common Denominators of Administrative Data and Official Statistics
What does “fit-for-purpose” data actually mean? It depends: on who you ask, and what decision is at stake. For governments and development partners – particularly those who rely on data from country systems for program planning and management – much frustration came from perceived redundancies in statistical and administrative data systems.

Understanding National Data Ecosystems
Within the Sustainable Development Goal context of “leave no one behind,” there exists an opportunity – and a pressing obligation – to support better outcomes for children. But much of the change needed must happen at country and local level, through better use of data and evidence in decision-making.