Stories, ideas, and updates from DGers around the world
The Development Gateway: An IREX Venture blog is where DGers share specific learnings, offer thought-provoking insights, and pose challenging questions for the sustainable development community derived from our work.
Our blog has a deep archive going back to 2005. Each post is a snapshot into our work, priorities, and values.

How IREX and DG’s Data Ecosystem Assessment Tools Advance Local Priorities
IREX’s Data Compass and Development Gateway’s CALM are methodologies for assessing data ecosystems. While each methodology produces different outputs based on different needs, both prioritize local collaboration and development to produce insights and outputs that reflect local priorities and actionable recommendations that institutions can own and implement.

Measuring digital transformation? Get real.
Senior Associate Annie Kilroy explores the limitations in how digital transformation has been measured and outlines recommendations for how to better assess the value and impact of digital transformation.
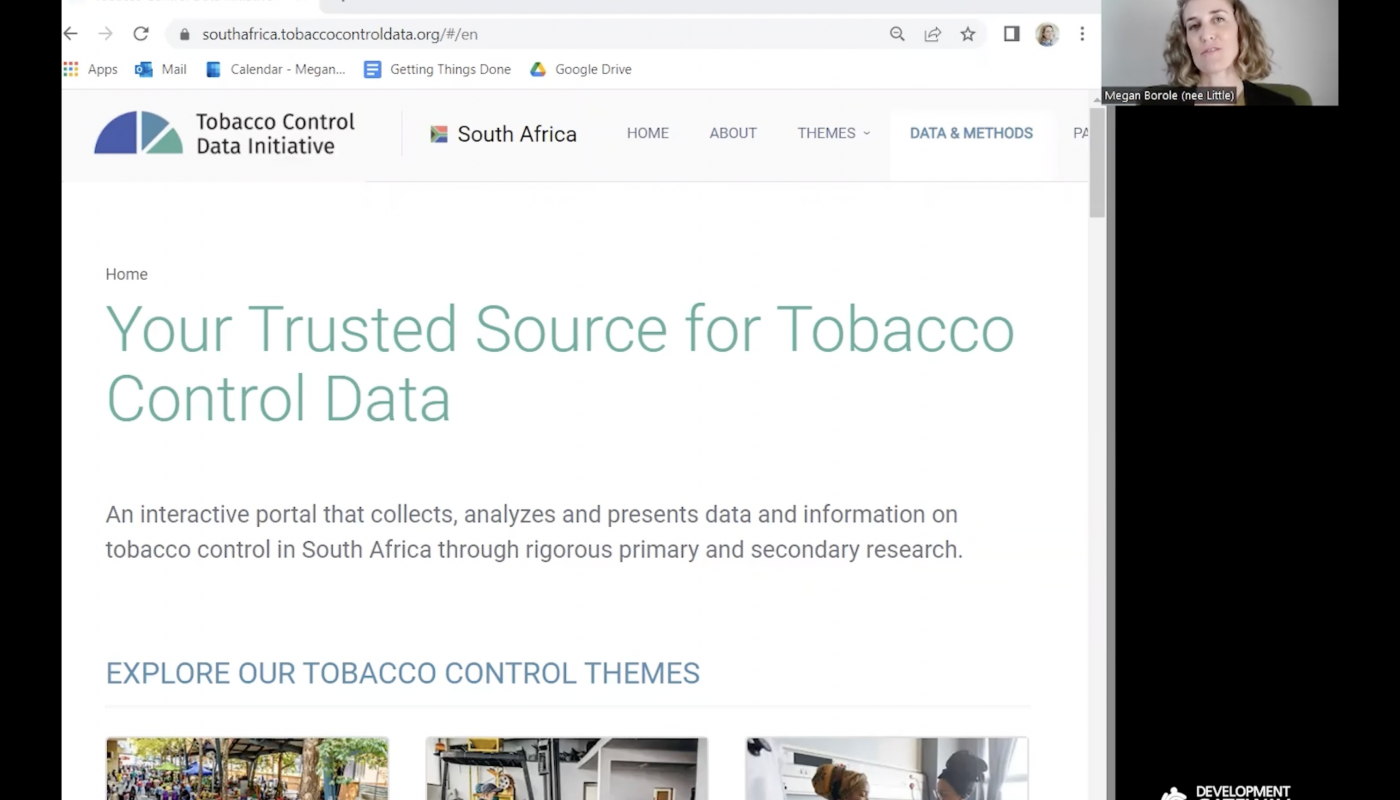
TCDI South Africa Website Demo
Megan Borole (nee Little) discusses Development Gateway's Tobacco Control Data Initiative (TCDI) Dashboard for South Africa, which was launched in May 2021, and highlights some of the vital information present on the platform.

Échos du secteur de la noix de cajou – Joseph Zerbo
Joseph Zerbo, conseiller aux affaires économiques directeur général du Conseil burkinabé du cajou (CBA), dresse un panorama de la filière cajou au Burkina Faso.

Voices of the Cashew Sector – Joseph Zerbo
Joseph Zerbo, Economic Affairs Advisor General Manager of the Burkinabe Cashew Council, provides an overview of the cashew sector in Burkina Faso.

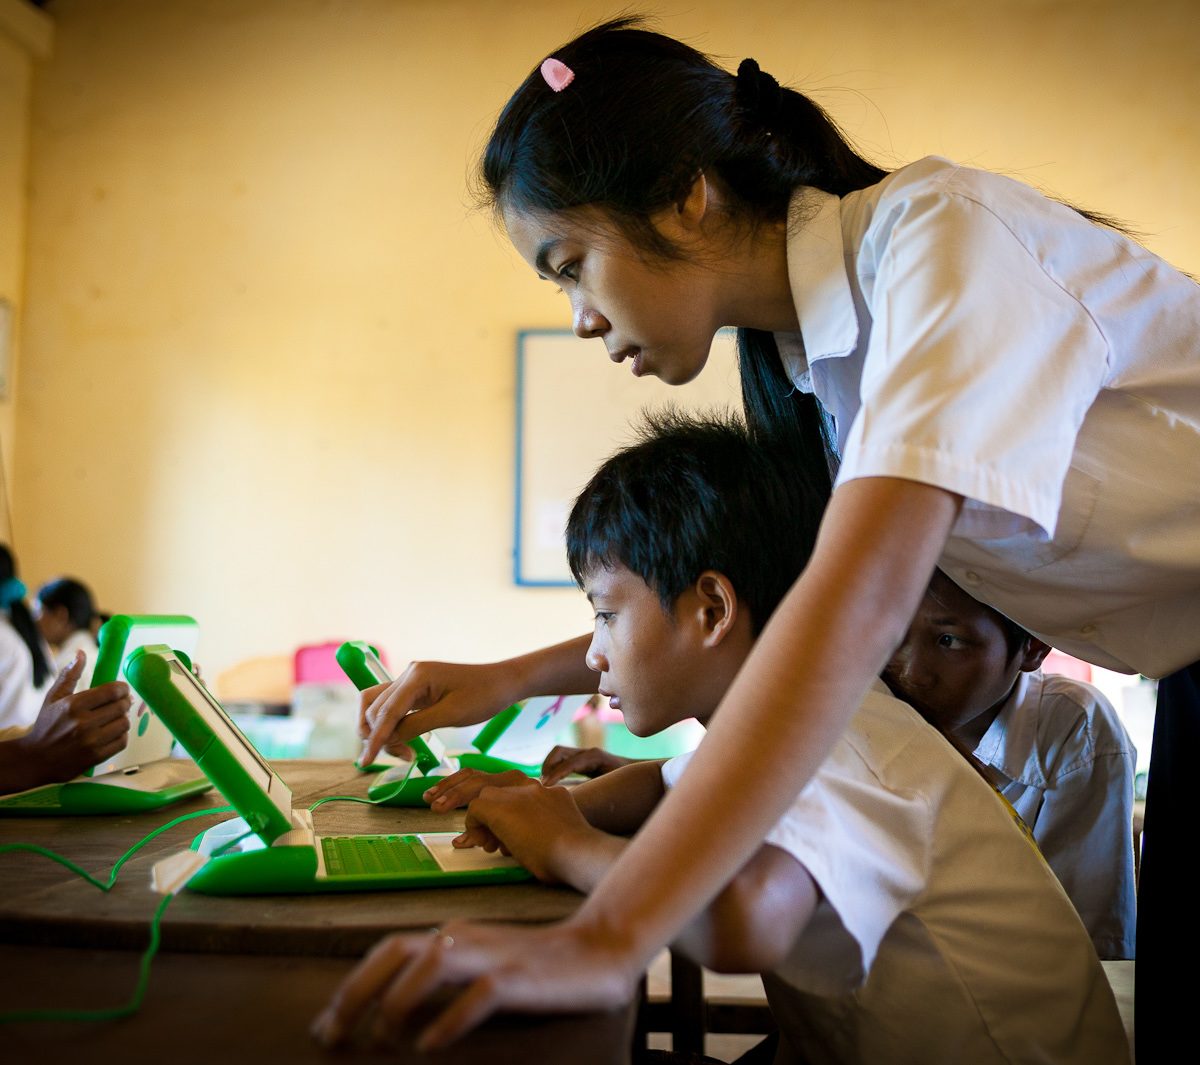
Data for Learning: 5 Lessons to Make Evidence-based Education Quality Improvements
Data can be a powerful resource for education reform. Without it, education leaders can be immobilized because they do not have enough information to recognize that problems exist or to make the case for change. However, data only provides value if it is used to inform decisions. Unfortunately, many education systems struggle with this step. So, how can education leaders best be supported to use data to make better decisions in support of quality education improvements? In collaboration with local partners, IREX is supporting the development of data systems and tools to improve education systems through better, evidence-based decision-making.

Échos du secteur de la noix de cajou – Roland Oroh
Roland Oroh, Président du Comité de pilotage national du Nigéria, donne un aperçu du secteur du cajou au Nigeria et explique comment la plateforme Cashew-IN développée par CNFA et DG soutiendra son travail.

Voices of the Cashew Sector – Roland Oroh
Roland Oroh, Chairman of the Nigeria National Cashew Steering Committee, gives an overview of the cashew sector in Nigeria and explains how the Cashew-IN platform developed by CNFA and DG will support his work.

Challenging Pessimists—and Optimists—to Reimagine Data and Power
Josh Powell and Jenna Slotin reflect on the Data Values Project and building a movement for change in data for development.

Five Tips for Successful Co-Design
As co-designing gains traction in the international development sector, Deputy Director of Programs Andrea Ulrich outlines five ways in which DG has found success co-designing projects with stakeholders.
