Posts by Lindsey Fincham

Launching: Digital Advisory Support Services for Accelerated Rural Transformation (DAS)
The Digital Advisory Support Services for Accelerated Rural Transformation (DAS) Program launched in March 2022 and will go through March 2025. Development Gateway: an IREX Venture (DG) will implement the grant in partnership with Jengalab and TechChange to advance Information and Communication Technology for Development (ICT4D) in the agricultural sector across Africa, the Middle East, and Central Asia.
Filling Tobacco Control Data Gaps in Nigeria
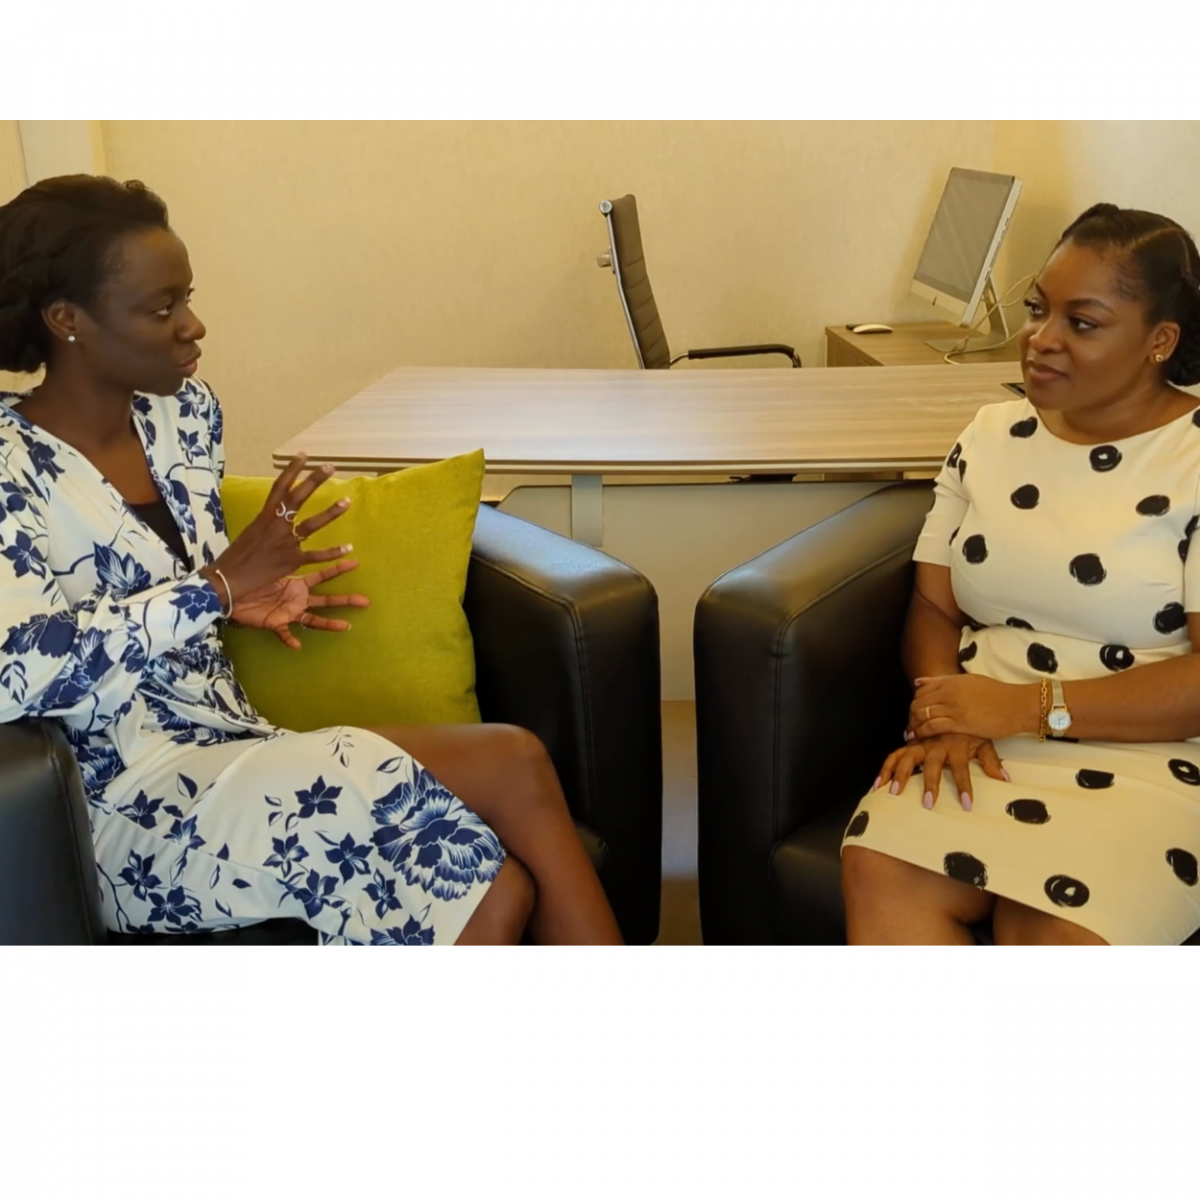
Development Gateway’s Aminata Camara Badji and Seember Ali discuss the Nigeria’s Tobacco Control Data Initiative Dashboard, which launched June 28, 2022.
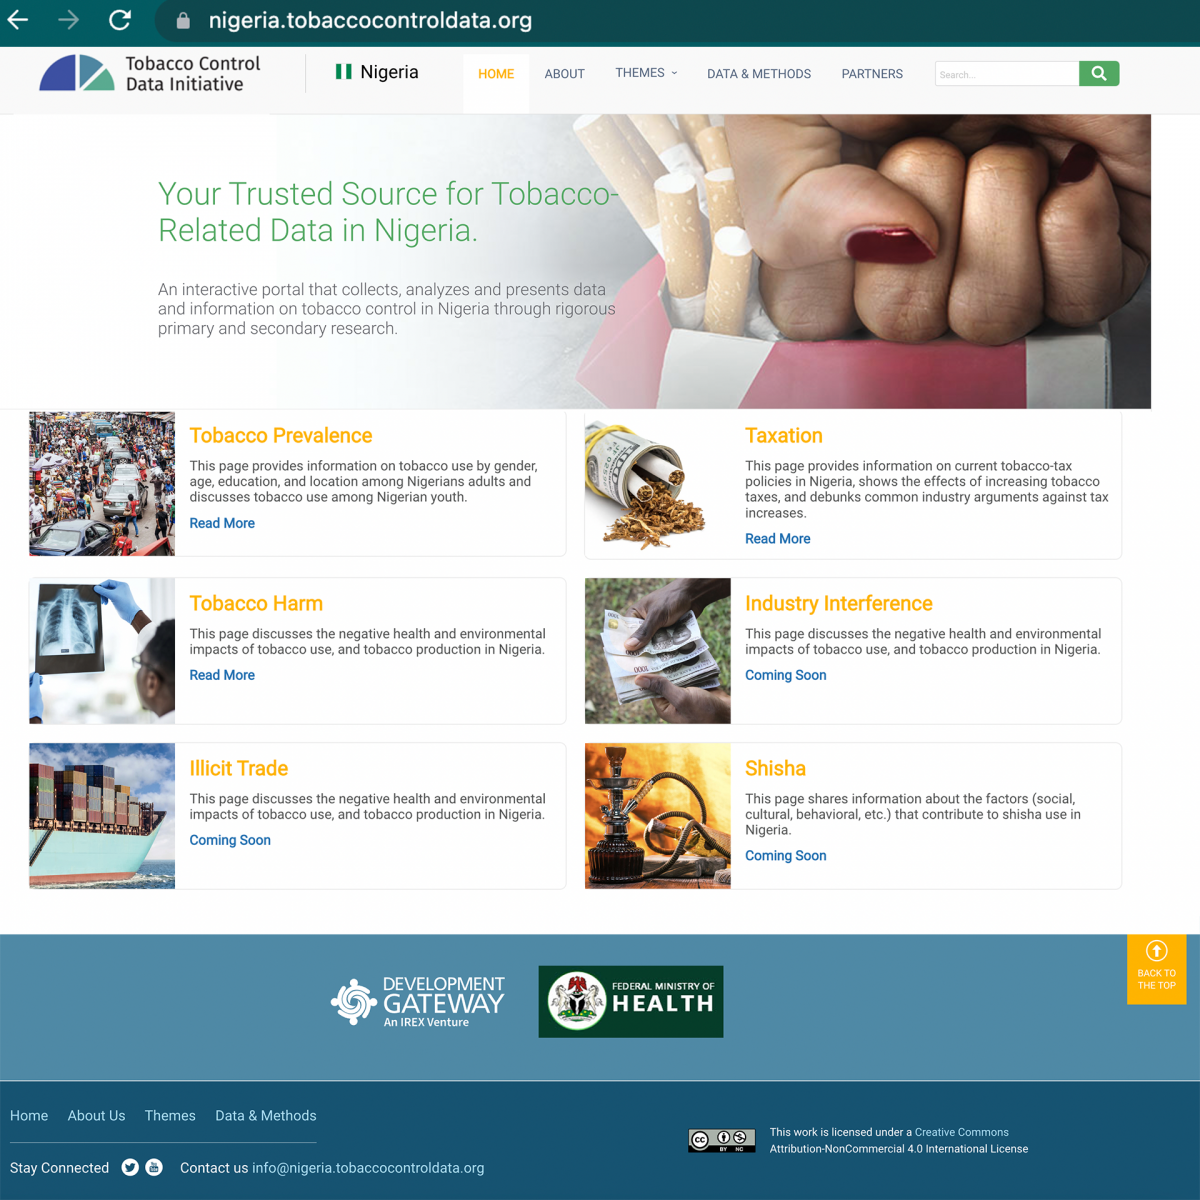
Advancing Tobacco Control in Nigeria: The TCDI Website
In June 2022, Development Gateway launched the Nigeria - Tobacco Control Data Initiative (TCDI) Dashboard. The TCDI website creates a “one-stop-shop” to access the relevant data that Nigeria’s policymakers need to advance tobacco control legislation and was created in response to the impending threat of increased tobacco use in Nigeria and the various dangers that accompany it.
The Evolution of Ghana’s Fertilizer Sector – From Subsidies to Crop Specifics
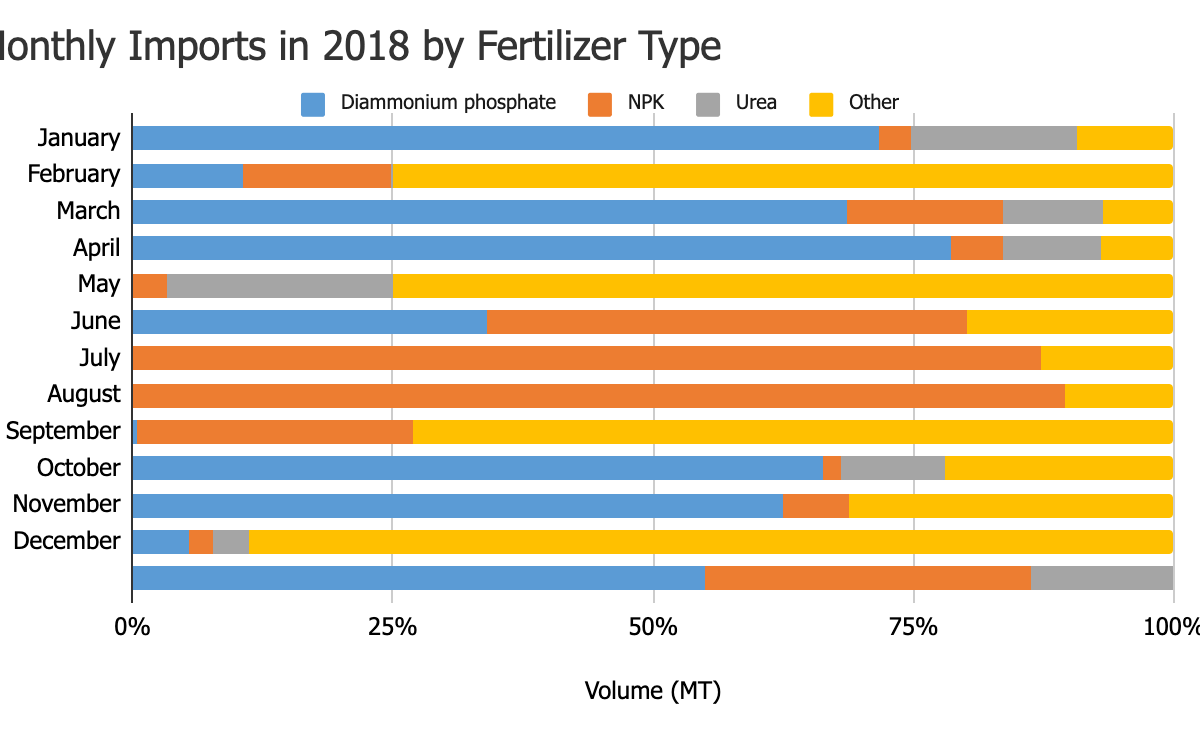
In looking at the data and talking to stakeholders in Ghana, several key trends are starting to emerge in the country’s fertilizer market and in turn through the data captured in the VIFAA Ghana Dashboard. These trends are important for decision-makers planning for each season, and when thinking about the future of the market. In this blog we’ll dive into these features of the Ghana market, including where (and how) the data fits in.
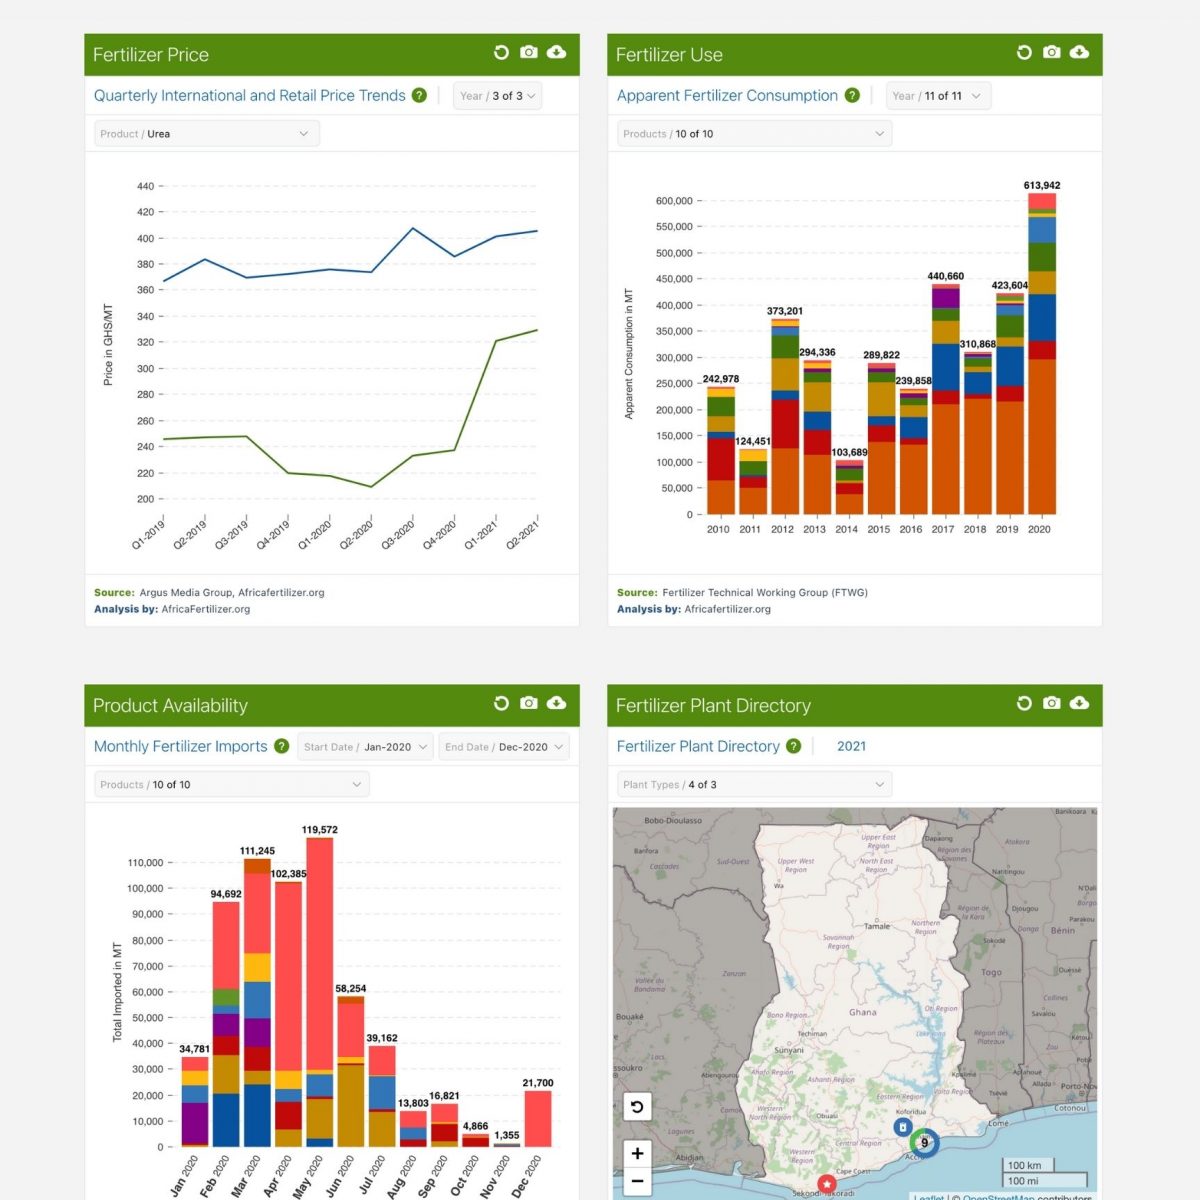
Why Does Ghana Need a Fertilizer Dashboard?
Launching this week, the VIFAA Ghana Fertilizer Dashboard aims to fill key fertilizer information gaps, increase data-driven policy and investment decisions in the fertilizer sector, and develop comprehensive, user-centered fertilizer data dashboards. Here is a deep dive into what is visualized on the dashboard.

From Rumors to Evidence-Based Advocacy
Mr. Gideon Negedu, the Executive Secretary of The Fertilizer Producers & Suppliers Association of Nigeria (FEPSAN,) describes using rumors for planning and the importance of the VIFAA Nigeria Dashboard in evidence-based advocacy.
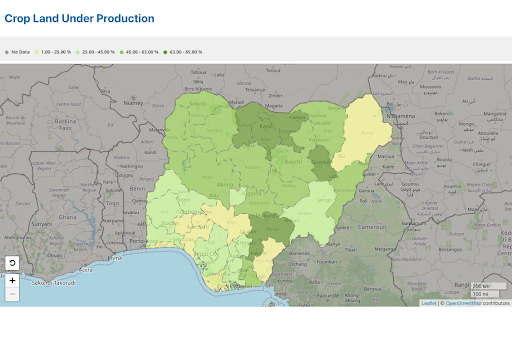
Decision-Making: from Soil to Farmers
Professor Victor O. Chude is the Registrar/CEO of Nigeria Institute of Soil Science (NISS), where his work centers around efforts to produce and use more region and crop-specific fertilizers to increase crop yields and food security. Professor Chude describes how the newly launched VIFAA Dashboard supports his work and feeds into decision-making.

Reducing Errors and Speeding Calculation through Automation
Armel Cyrille Brou, DCDJ Fellow in Côte d’Ivoire, provided support to the data management team at an Ivorian health facility focused on treating patients with HIV/AIDS. Armel developed an application that reduces the time spent calculating patient program schedules from five minutes to less than 30 seconds.
What’s Your Story and How Can Data Help Tell It?
For as long as Development Gateway has specialized in data, we have also specialized in data visualizations. In that time, we have discovered the pitfalls and learned ways that data visualizations can increase data use. In this post, we look specifically at selecting the right type of visualization for the story you want to tell.
The Building Blocks for Successful Data Visualization Tools
In 2020, we sought to answer a pivotal question: what are the good practices and lessons learned from the many existing women’s, children's, and adolescent’s health data visualization tools? In partnership with UNICEF, DG worked to identify good practices, as well as to determine any differences for emergency-focused data visualization tools, using COVID-19 as a test case.