Global Goals, National Priorities: Kenya Forestry App
At the United Nations General Assembly last week, government, public, and private actors signaled their intent to achieve a sustainable 2030 — and recognition that we only have 14 more years to turn rhetoric into reality.
For the past several months, we worked with the Government of Kenya to show how technology and the data revolution can support national achievement of the global goals. Working with the Office of the Deputy President of Kenya — fellow GPSDD champions — and the University of Eldoret, we made a prototype tool for engaging citizens to work toward Sustainable Development Goal 15: “Protect, restore and promote sustainable use of terrestrial ecosystems, sustainably manage forests, combat desertification, and halt and reverse land degradation and halt biodiversity loss.”
Why does Goal 15 matter so much in Kenya? According to 2015 data, the country has less than 7% forest cover, a sharp decrease from earlier decades, and well below international norms. Despite having over 7,000 types of native trees, Kenyan farmers — after cutting down trees for domestic use or export — typically replant only three or four types of tree. And these species are often not planted in their ecologically correct zones, leading to a less diverse ecosystem, and weak or stunted tree cover.
The goal of this strategy is to reverse this trend by engaging citizens through technology — specifically, an educational, and easy-to-use tool that shows where deforestation is the biggest problem — and eventually (when all the data is received), assist to identify what trees should be planted where. Over the past few months, the Development Gateway team used a data set from the Kenya Open Data Portal to visualize forest coverage by county. By opening up and visualizing data, we are enabling further scrutiny by the academic community; visualizing the problem for civil society organizations, and citizens; and paving the way for an informed dialogue on sustainable forestry practices.
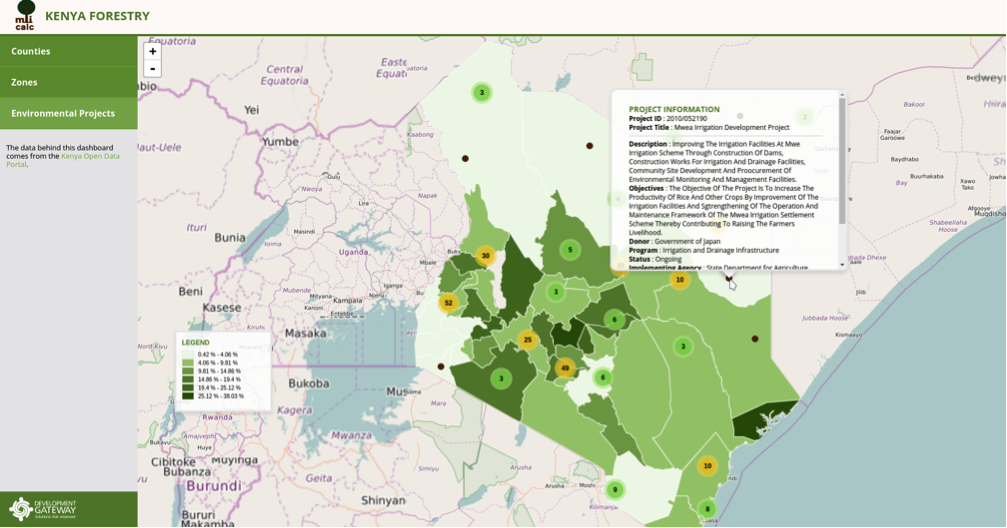
Figure 1: Kenya Forestry Prototype
This tool builds upon the University of Eldoret’s Forestry Department’s work, which had included a mobile Android application MtiCalc — an application to help local farmers do basic forest and woodlot calculations. Our forestry app debuted at the Kenya National SDG Roadmap meetings.
A Look at the Tech Behind the Dashboard
When we started developing this prototype, we did not have all features clearly defined — but we did have a pretty clear idea about what our final product should look like. Our main challenges were time and complete data. With this in mind, we set a goal of achieving a simple tool able to give users information quickly and simply, with functionality that can easily be extended in future.
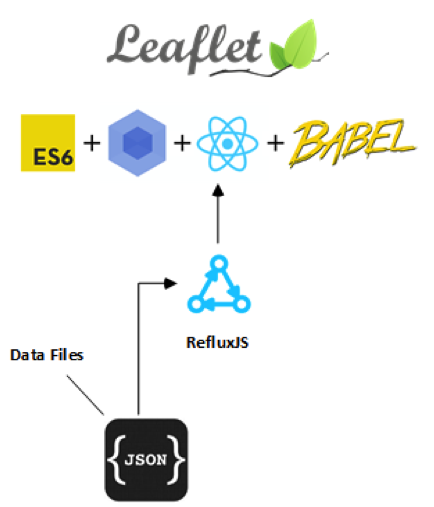
Figure 2: Technologies used in the forestry application
As DG has extensive experience building similar applications, and given the constraints mentioned above, we worked to leverage as much existing code as was possible. We turned to reactjs, our organizational go-to JavaScript library; and leaflet, which pairs well with React and provides a lightweight build and fast maps for low-bandwidth connections.
Datasets we obtained were simplified and stored in JSON format. This is very convenient considering that, in the future, we could pull data from a server through an API without making many changes to the code. There are three main open datasets used in the platform to highlight different aspects of interest in the map: forest coverage, projects related to environment, and three tree species types.
Map layers include details of forest coverage by counties. These were transformed from “shape” format to GeoJSON since this is more suitable for use in web applications. Layers were also simplified to reduce the size and speed up download time. As it was not possible to get a layer of regions, we “built” a layer generated with the counties that make up each region. Qgis helped us to do this and also to “dissolve” polygons by attributes. Likewise, using the information we had available, we calculated the coverage for each region.
Conclusion and Next Steps
In the near future, through this collaboration, we aim to expand this tool to include more datasets and features that helps farmers, CSOs and concerned citizens know what trees to plant where. But in the meantime, we still hope the forestry app offers a meaningful example of how simple tech and already-available data can be used to accelerate progress toward the SDGs.
Image: Romy Chevallier CC BY-NC-ND 2.0
Share This Post
Related from our library
A Year After USAID: Reclaiming Control of Data Systems
Just months after the 2025 U.S. aid freeze was announced, we published a blog post warning that the USAID cuts would result in a data crisis, with some countries losing access to their digital health data. This blog explores how those systems – and the countries relying on them – have fared nearly a year on.

Introducing The HackCorruption Civic Tech Tools Repository
Introducing the Civic Tech Tools Repository: an open-source hub of digital solutions to fight corruption. Designed for growth through GitHub contributions, it brings together tools, code, and resources across six key areas for HackCorruption teams and beyond.
Beyond Kigali: Where Does Africa Go from Here with AI?
As the AI momentum builds, Development Gateway is asking different questions: where the data comes from, how reliable it is, how legacy systems will supply usable data, and whether governments have the capacity to govern and trust the AI tools they’re being urged to adopt.